


Services on Demand
Article
 English (pdf)
 Article in xml format
 Article references
Indicators

Related links
-
 Cited by Google
 -
 Similars in Google
Share

 Permalink
South African Journal of Industrial Engineering
On-line version ISSN 2224-7890
Print version ISSN 1012-277X
S. Afr. J. Ind. Eng. vol.25 n.1 Pretoria Jan. 2014
CASE STUDIES
Cycle time analysis of tipping trailer frame: A case study in a heavy equipment industry
M. MarsudiI, *; H. ShafeekII
IDepartment of Industrial Engineering King Abdulaziz University, KSA. mmarsudi@kau.edu.sa
IIDepartment of Industrial Engineering King Abdulaziz University, KSA Suez Canal University, Industrial College of Education, Egypt. hsaliman@kau.edu.sa
ABSTRACT
A key element with which manufacturing industries should concern themselves in respect of cost and efficiency of operation is the cycle time for preparing their products. A reduction in operational time can result in dramatic improvements in both cost and efficiency. Unfortunately, cycle time problems are sometimes difficult to analyse: there are many factors related to this parameter. This paper presents a cycle time analysis of a tipping trailer frame in a heavy equipment industry. The cycle time analysis, based on the cycle time data collected by a time study, together with the use of an Arena software simulation, is outlined. From the results of this study, it was found that the manufacturing cycle time was 56 hours, and that resources were under-utilised.
OPSOMMING
Die siklustyd vir die voorbereiding van produkte is krities tot die vervaardiging industrie. 'n Vermindering in die operasionele tyd kan lei tot drastiese verbeterings in beide die koste en doeltreffendheid. Siklustydprobleme is egter dikwels moeilik om te analiseer omdat daar baie faktore is wat dit beïnvloed. Hierdie artikel stel 'n siklustydanalise voor van 'n tiepsleepwaraam in 'n swaartoerustingindustrie. Die siklsustydanalise, gebaseer op gemete siklustyd data saam met 'n Arena simulasie, word bespreek. Die studie het bevind dat die vervaardigingsiklustyd 56 ure was en dat hulpbronne onder benut was.
1 INTRODUCTION
'Manufacturing cycle time' is the sum of the processing times of all the steps required to complete a product, plus all the waiting or queue time the product experiences at each stage of the process. The reduction of manufacturing cycle time is very important in product manufacture. A shorter manufacturing cycle time will make the production process more effective and productive. Reducing the manufacturing cycle time is achieved by speeding up a company's order-to-delivery time, getting the product into the customer's hands as quickly as possible at the lowest possible cost. Although there are many studies of manufacturing cycle time, it is always relevant to study it further: manufacturing cycle time can influence inventory, production costs, response to customer orders, and flexibility. Competition between manufacturers today is not focused only on cost and quality, but also the cycle time. According to Rasmussen and Walden [1], by reducing manufacturing cycle time, costs can be reduced, and productivity and efficiency can be increased [2].
This paper discusses the cycle time in a company in Malaysia. This company, XX Engineering Sdn. Bhd., produces truck-mounted equipment such as garbage compactors, multi-lifts, and trailers. The discussion in this paper is focused on the cycle time of producing a tipping trailer frame, which is a part of the complete trailer product. A study of the cycle time of the tipping trailer frame is very useful for the company because it needs to improve the efficiency of its production lines. Improved production lines will enable the company to handle continually increasing product demand.
2 LITERATURE REVIEW
Cycle time is the total time required to produce a product from start to finish [3]. Different terms are sometimes used to connote the cycle time concept. These terms include 'Time Line', 'Cycle Time', 'Time to Market', 'Speed', and 'Slip Rate' [4]. The discussion of cycle time also often relates to other topics such as throughput, utilisation, and model simulation. So previous studies relating to cycle time, throughput, and simulation will be discussed briefly.
Japan is the only country that emphasises the routine use of both cycle-time analysis and process simplification [5]. About half of Japan's businesses use these practices more than 90 per cent of the time. Less than 25 per cent of businesses in the United States, Canada, and Germany use process cycle-time analysis or process simplification to improve their business processes [4].
There may be several causes of a manufacturer's long order-to-delivery cycle. Two common factors that can stretch the order-to-delivery cycle are too many non-value-added activities, and measuring the wrong parameters. For the first factor, it can be stated that the average time of receiving and entering an order in most companies is less than 5 per cent of the order-to-delivery cycle [6]. Inventory thus spends 95 per cent of the time between order entry and shipment waiting for the next step in the process. Complicated paperwork and long waits during the work process can add days to the cycle but no value to the product. In the case of measuring the wrong parameters, most companies measure their performance against criteria such as equipment utilisation, productivity, or order completion date, and think they are doing fine if they get high scores [6]. But a company can excel according to these criteria and still lose out to the competition if it cannot get its product to the customer by the promised time [7]. Nowadays many manufacturing companies apply various control and evaluation techniques in order to improve productivity. We must recognise that proper evaluation of standard time is a prerequisite for applying these techniques. But due to the complexity and diversity of products, collected production data are still only utilised when counting the total amount of time taken for production, instead of estimating the standard time for each process [8].The goal of this paper is to create an initial understanding of the impact of the selected controllable input variables on cycle time, distribution and throughput, so that we can help to improve the cycle time performance. This understanding is very important to a factory before it makes investment decisions to improve cycle time and distribution without the loss of throughput [9]. A neural network (NN) with a modeling method is proposed to generate the cycle time (CT)-throughput (TH) profiles for single/multi-product manufacturing environments. Such CT-TH profiles illustrate the trade-off relationship between CT and TH, the two critical performance measures, and thus provide a comprehensive performance evaluation of a manufacturing system [10].The process simulation tools enable users to readily experiment with options that have the potential of increasing the batch size and/or reducing the cycle time. The base case process already operates at its maximum batch size (imposed by the granulator). Consequently, the only option for throughput increase is to reduce the cycle time of the time bottleneck equipment, which is the bin that supplies material to the tablet coater [11].
The use of simulation in improving cycle time has been discussed by many researchers [9, 12, 13, 14]. Based on their study on many manufacturing systems, they have concluded that simulation can improve cycle time by between 15 and 45 per cent. Simulation is a powerful technique that helps decision-makers to solve difficult problems in the design, control, or improvement of complex systems in order to reduce cost, improve quality or productivity, and shorten time-to-market. However, for several reasons the technology is still under-utilised: (1) simulation modeling is a time-consuming and knowledge-intensive process that requires knowledge not only about simulation but also about application and implementation tools; (2) most simulation models developed with current technology are 'rigid' customised ones that cannot be reused or easily adapted to other similar problems; and (3) transforming related knowledge and information from the application domain to simulation is an unstructured or ill-defined process that is dependent on the skill and experience of individual modelers [15]. The relationships between key indicators of manufacturing system performance, such as cycle time (CT), throughput (TH), utilisation, work-in-process (WIP), and the variability factor (to be defined shortly in this paper), are complicated and difficult to quantify [16]. For many companies, the key aspects of current competitiveness in order to raise customer satisfaction focus on delivery time, quality, and cost [17]. The optimal manufacturing run time minimises the long-run average production-inventory cost [18]. The life-cycle perspective in manufacturing decision-making combines discrete-event simulation - commonly used for the conceptual evaluation of manufacturing systems - with life-cycle assessment, to allow manufacturing decision-makers to assess how the life-cycle environmental performance of a manufacturing system responds to various changes in its configuration [19]. A simplified simulation model that captures the main characteristics of the real manufacturing process and proposes a set of real-time location systems (RTLSs)-enabled dispatching rules has been developed [20]. The quality of a fabrication process is maintained through continuous improvements identified via real-time monitoring of the end-to-end processes. Highly-integrated applications capable of making complex real-time decisions monitor every aspect of the fabrication process [21].
Djassemi (2005) has discussed the performance of cellular manufacturing (CM) systems in a variable demand and flexible workforce environment using simulation modeling. The views of two parties were incorporated into simulation models to rectify the existing discrepancies. Their simulation results showed that the practice of using flexible cross-trained operators can improve the flexibility of CM in dealing with an unstable demand, and can reduce the load imbalance that is inherent in machine dedication in manufacturing cells [22]. Sukhotua and Peter. [23] discussed a number of approaches in the facility design for modelling material flow using queueing networks. In these approaches, Poisson arrival or Markovian job routing assumptions were used. However, for many manufacturing environments, these assumptions lead to an inaccurate estimation of the material handling system's performance, and thus lead to poor facility designs. The modelling approach proposed here has been shown to provide more accurate results than previous methods used in facility design that are based on numerical comparisons with results from discrete-event simulation [23]. Marcheta et al. [24] presented an analytical model to estimate the performances (the transaction cycle time and waiting times) for total product movement.
The model is based on an open queuing network approach. The model's effectiveness in performance estimation was validated through simulation. Process analysis is recognised as a major stage in business process reengineering that has developed over the last two decades [24]. Lina et al. [25] had outlined a manufacturing process analysis with emphasis on linking a company's strategy to operational process. Two issues, namely process modelling and simulation based analysis, were investigated. A compound workflow model (CWM) was proposed to provide a graphic presentation of the production process that can be easily understood. A two-stage simulation analysis method was provided to define cause-and-effect relations quantitatively and efficiently, in order to identify drivers for improvement. It was determined that the three main concerns considered in the simulation are the manufacturing environment, PSC (production planning, scheduling and control) factors, and the process structure [25].
Cortesa et al. [26] presented a real-life assembly line balancing problem for a motorcycle manufacturing company. Results from the initial situation in the company are compared with those provided by a heuristic method and by a novel neighbourhood search method. An ARENA simulation model was developed to test the different proposals. The model was validated by comparing the simulation results from the initial company scenario with the real operation results. Consequently, the extension to the developed proposals allowed them to select an adequate assembly line for the company, resulting in a greater productivity level and a more balanced line with respect to the operation times in the stations and the activity of the workers [26].
Based on the brief discussion of the previous studies above, two points can be underlined:
• Cycle time and throughput are two important parameters to be analysed in a manufacturing system.
• The use of simulation is still under-utilised, even though it is is a powerful tool for analysing complex systems, including manufacturing systems.
3 PROBLEM FORMULATION
In this section the problem being studied will be clearly stated; also, the process flow to produce a tipping trailer frame, and the goal and objectives of the study will be presented.
3.1 Problem statement
Cycle time is the main issue addressed in this case study. Based on our discussion in point 2 above (the literature review), it is very important to study the problem of cycle time. For the company XX Engineering Sdn. Bhd. in Malaysia, analysis of the cycle time for producing a tipping trailer frame is very critical because:
• There has been a steadily increasing demand for the company's product from its customers in recent years. Reducing the product's delivery time to its customers is a very important factor enabling the company to keep ahead of its competitors.
• All manufacturing industries are a profit-oriented business. So reducing production costs is important to increasing profits. Workers' salaries are one component of production costs: so the use of resources (especially human resources) in production needs to be analysed; and resource use has a proportional relationship with cycle time [2].
In the light of the cycle time issues mentioned above, the following questions can be formulated:
• What is the minimum time needed to produce one unit of tipping trailer frame?
• How are resources used to produce one unit of tipping trailer frame?
To understand more about the XX Engineering company, the detail of its production process flow will be discussed below.
3.2 Production process flow
Figure 1 illustrates the process flow for producing a tipping trailer frame in a heavy equipment industry. There are 19 workstations in the assembly process. The activities at the three main workstations involved in producing a complete tipping trailer frame will be discussed follow.
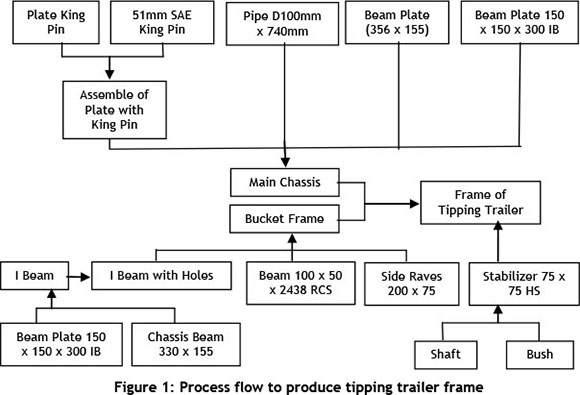
The three workstations in question were the main chassis, bucket frame, and tipping trailer frame workstations. The main chassis components were prepared and brought to the cutting station by one worker (Worker A). These components were a pipe (diameter 100mm x 740mm), a beam plate (356 x 155), and a beam plate (150 x 150 x 300 IB for the main chassis). All three components of the main chassis were measured and cut by Worker A at the cutting station. Then the components of the main chassis were assembled and welded, with the assembly part of the plate with king pin being added to the main chassis by Worker B. Using the welding process, the beam plate measuring 150 x 150 x 300 IB for the bucket frame part (prepared by Worker C) and the chassis beam part measuring 330 x 155 (prepared by Worker C) were assembled by one worker (Worker D) at the bucket frame station. This assembly was then sent to the drilling station. An I-beam with holes was made at this station by one worker (Worker E). Lastly, the I-beam with holes was sent to the bucket frame station, where it was assembled and welded, with side raves 200 x 75 and the beam 100 x 50 x 2438 RCS, by Worker D. Using a welding process, the main chassis (produced at main work station 1 ) was assembled with the bucket frame (produced at main work station 2) by Worker D. A bush part (prepared by both Worker A at the lathing & drilling bush workstation and Worker E at the tapping bush workstation) and a shaft part (prepared by Worker A at the stabiliser shaft workstation) were assembled and welded by Worker E, making up a stabiliser part. Two stabilisers that had been manufactured at the stabiliser station by Worker E were fixed by Worker E on to the assembly of the main chassis and bucket frame, to produce a tipping trailer frame at the bucket frame main chassis_stabilizer_floor workstation. A complete tipping trailer frame was produced by adding two steel floor boards (prepared by Worker C) to the tipping trailer frame.
3.3 Goal of the study
As mentioned earlier, XX Engineering faced constantly increasing demand for its product. The company also had very limited space in the existing plant for expansion. The company faced many questions to solve this situation. Clearly, the goal of this study was to answer the questions mentioned in point 3.1 above. Based on these answers, the possible improvements to the existing production lines can be executed.
3.4 Objective of the study
To achieve the goal of the study, the objective of the study needs to be formulated. The objective of this study was to analyse the manufacturing cycle time and resource utilisation issues at the company in question (i.e. XX Engineering Sdn. Bhd.).
4 METHODOLOGY
To accomplish the objectives, the methodology flowchart was as shown in Figure 2. Generally, the first step was a stopwatch time study to identify the processing time at each workstation; the second was to use an Arena simulation to identify the time needed to produce one unit, and to identify the utilisation of resources in the production line.
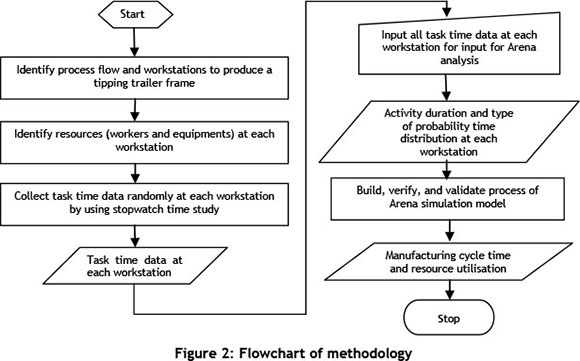
Process flow, workstations, and resources at the workstations were identified by direct observation, followed by personal investigations such as interviewing and discussion with the relevant person, who could be a head of production department, or a shop floor worker, or others. And task time data at each workstation also needed to be collected randomly by using a stopwatch time study. Once the task time data at each workstation was known, it was used to determine activity duration and the type of probability time distribution at each workstation. This process was done by using the Input Analyzer of Arena. All the information about process flow, workstations, resources, and probability at each workstation was needed to build the Arena simulation model. This model was verified by using the running procedure in Arena module. The validation process was conducted by comparing the output of the real system with the model output of the existing system. Finally, based on the output of the Arena simulation model, manufacturing cycle time and resource utilisation can be defined.
4.1 Stopwatch time study
A stopwatch time study involves making direct observations using a stopwatch. The stopwatch method is repetitive timing (snap back): the stopwatch will be set to zero after every reading. There is thus no relationship between any of the readings. In this study, the sample size required to predict the true time within a ±10% precision and 95% confidence level was obtained using the following formula [27]:
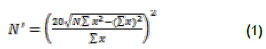
where N' = sample size, N = number of random individual readings (the aim was to have five for this study), x = each stopwatch reading or individual observation.
4.2 Arena simulation development
The Arena simulation software is widely-used in the industry for projects to create simulation models of business processes, logistic systems, production processes, and transportation processes. It is a general purpose simulation tool with unlimited application possibilities. In this study, Arena version 7.1 was used to analyse the performance parameters of the production line being studied. Those performance parameters are mainly the manufacturing cycle time and resource utilisation. The Arena model developed in this study was verified by ensuring that the model design (the conceptual model) had been transformed into a computer model with sufficient accuracy. By using Arena's running procedure module, verification of the Arena model could also be verified. Besides the verification, the other important step is model validation - the task of ensuring that the developed models function as they do in the actual model. As mentioned earlier, model validation for this study was done by comparing the output of the real system and the model output of the existing system.
Even though many workstations were shown in Figure 1, essentially this assembly process can be modeled as an M/M/1 system, using exponential distribution to analyse the service types and arrival times [19]. The first 'M' gives the arrival time distribution, and the second 'M' is for service time distribution. The '1' indicates that is there just a single server. Other than modeled as M/M/1, the 'input analyzer' tool of the Arena simulation software (version 7.1) was also used in this study to analyse the resultant data obtained from the stopwatch time study.
As mentioned earlier, the use of Arena software in this study is to analyse the performance parameters of the production line being studied. One of these is resource utilisation. There are two types of resource utilisation in the Arena statistics report: 'instantaneous utilisation' and 'scheduled utilisation'. They can be described as below [28]:

where T is the length of the simulation,
B(t) is the number of units of a particular resource that are busy at time t,
M(t) is the number of units of that resource that are available at time t,
0 < B(t) < M(t) at all times t.
If the resource has a fixed capacity, then M(t) is a fixed constant for all t; but if the resource capacity follows a variable schedule, then M(t) will vary with t. In this study, instantaneous utilisation is the same as scheduled utilisation because the resource capacity is fixed.
The Arena simulation in this study was run for seven days, using the following assumption to define the problem:
• The process line is never starved.
• Setup times are not taken into consideration because in a real system the setup process has been accomplished by the end of working time.
• The eight working hours per day do not include breaks.
• Transportation of work materials is performed by workers who are not involved in operations.
5 EXPERIMENT PROCEDURES
The following steps are conducted in a stopwatch time study:
1. Obtain and record all the information available about the task at each workstation.
2. Break down the task into precise elements.
a. Record the times for each task element.
b. Repeat step (a) to get five individual readings.
c. Compute the average time for each task element
3. Sum the average times for each element to develop a total task time at each workstation.
4. Repeat steps (2) to (3) until the required sample size is met.
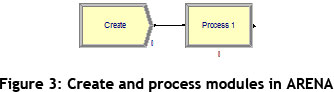
In this study, there were two steps for constructing the Arena simulation model of a tipping trailer frame production line. The first was 'structure of creating and processing each product', and the second was 'structure of combining products'. The information for each module is described below.
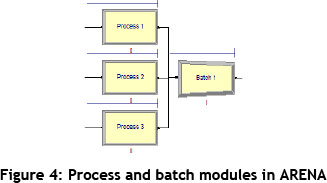
In order to create each product (entity) in the simulation model, the 'create' module was used to generate the arrival of each product. Then the 'create' module was connected with the 'process' module (Figure 3). Data collected during the stopwatch time study (point 4.1 above) was used for the process module. In the assembling process, two or more independent products can be assembled to get one assembled product. For this purpose, the 'process' and 'batch' modules were used (Figure 4).
6 RESULT AND DISCUSSION
6.1 Duration of workstations' activity
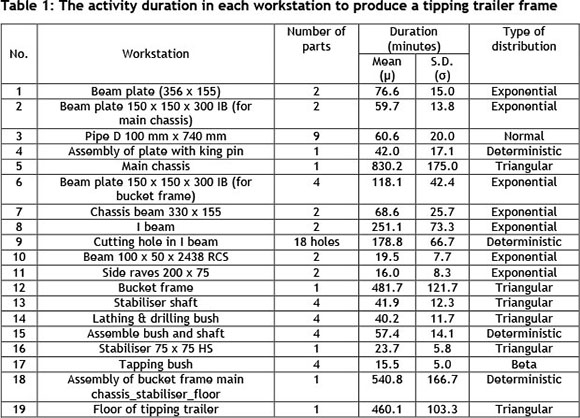
Based on the stopwatch time study and Arena's input analyser (in this case a particular probability distribution at each workstation resulted from the output of Arena's input analyser), the activity duration of tipping trailer frame manufacture can be summarised as shown in Table 1.
6.2 ARENA simulation
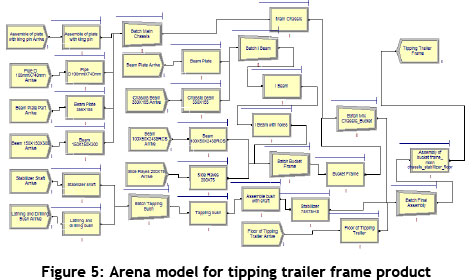
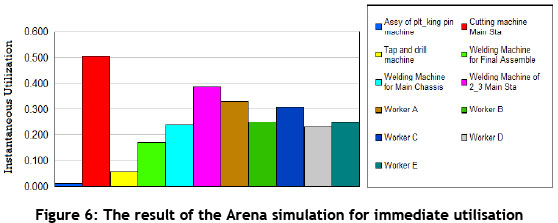
Based on both the process flow in Figure 1 and the activity duration data in Table 1, the Arena model of the production line in this study can be created (Figure 5). The result of the Arena simulation - in terms of the cycle times at each workstation to produce one tipping trailer frame, and the immediate utilisation of each resource - is shown in Table 2 and Figure 5 respectively. In this case, the assignment of workers to each workstation has been discussed earlier at point 3.2.
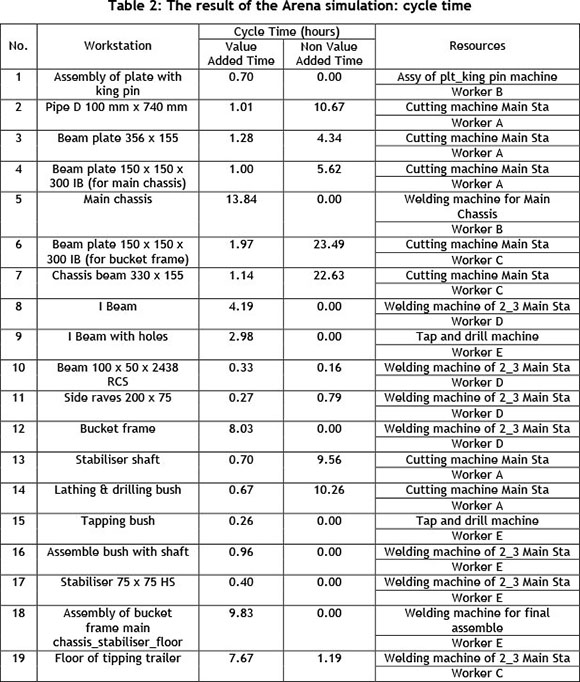
The results of the Arena simulation shown in Table 2 and Figure 6 were verified by running the Arena simulation model many times. This needs to be done to ensure that each program path was correct. For the validation of the Arena simulation result in this study, comparison of the simulation results with historical records shows the consistent manufacturing cycle time. Based on the simulation result, it takes 56 working hours to produce one unit product. This result is nearly the same as the historical result, which showed that at least 75 working hours were needed to produce one unit product. The percentage of the time improvement between the simulation result and the historical result can be calculated as follows:

The percentage of the time improvement found in this study is supported by previous researchers [6, 9, 10, 11]: its value is still in the range between 15 and 45 per cent. This is a significant enough improvement to improve both cycle time and productivity.
From Table 2, it can be stated that the highest value-added cycle time was at the main chassis workstation - 13.84 hours. On the other hand, the highest non-value-added cycle time happened at the beam plate 150 x 150 x 300 IB (for bucket frame) workstation, which was 23.49 hours. The second-highest non-value-added time was 22.63 hours at the chassis beam 330 x 155 workstation. Both of these two high non-value-added stations were located at Main Work Station 2. Thus, to improve the manufacturing cycle time of this production line, Main Work Station 2 should get more attention than the others. In this case, by referring to Table 2, we can assign Worker A to help Worker C to work the at beam plate 150 x 150 x 300 IB (for bucket frame) workstation, or at the chassis beam 330 x 155 workstation. In this scenario, the non-value-added cycle times at both of those workstations can be reduced.
Based on Figure 4, the highest immediate utilisation was 0.5 for a machine named 'Cutting machine Main Sta'. This machine was used at several workstations: pipe D 100 mm x 740 mm, beam plate 356 x 155, beam 150 x 150 x 300, lathing and drilling bush, stabilizer shaft, beam plate, and chassis beam 330 x 155. It is not surprising, therefore, that this machine has the highest immediate utilisation when compared with other resources. This simulation result also showed that not all the resources in this studied production line have maximum immediate utilisation yet. To improve the use of resources, the use of a certain welding machine should not be limited to one task only: if possible, it also should be used for other tasks, thus increasing its utilisation. For example, by referring to Table 2, besides being used for the welding task at the main chassis workstation, the welding machine can also be used for the welding task at the assemble of bucket frame main chassis_stabiliser_floor workstation. From the simulation result, this action would increase the utilisation of the welding machine from 0.24 (see Figure 5) to 0.41 .The same action can be taken to increase the worker utilisations. For example, if Worker A is assigned to help Worker C at the chassis beam 330 x 155 workstation, Worker A's utilisation increases from 0.33 to 0.37.
7 CONCLUSION AND FUTURE STUDY
This study investigated the cycle time for manufacturing a tipping trailer frame product. After collecting cycle time data for each workstation on the product production line, the data was used in an Arena simulation model, allowing both the manufacturing cycle time and the resource utilisation parameters of the production line to be analysed. The result showed that the minimum time needed to produce one product unit was 56 working hours. Additionally, the use of resources on the production line was not yet at an optimum level. To improve this, the company could reduce the number of its workers (currently the utilisation of all workers is under 30%), and also not use a certain welding machine for a limited task only. This study found that all the welding machines, as well as a number of other machines on the production line, are under-utilised. The lowest and the highest value of machine utilisation were those for the 'Assy of plt_king pin machine' and the 'Cutting machine Main Sta' respectively.
Apart from the stopwatch time study and the Arena simulation, many factors affecting the cycle time for a tipping trailer frame can be focused on in a future study. These factors include the employees, the machines and equipment, and the condition of the workstations. The employees factor includes employee fatigue problems, and the problem of unbalanced task distribution between employees. As an employee tires, the process flow of the product is disturbed and a lot more time is taken to finish the product. And, based on indirect observation of the company, it appears that the tasks have not been divided in a balanced manner, taking into account the age, experience level, and skills of the employees. Another factor that needs to be investigated is that of old machine technology and the bad arrangement of equipment and machines. The old condition of the machines caused their cutting speed to be slower, thus increasing their operation time. The bad arrangement of equipment and tools also caused the operators to waste time in searching for them. Finally, smoke and heat generated by welding activity creates uncomfortable working conditions - one example of a workstation condition factor that influences the cycle time of a tipping trailer frame.
ACKNOWLEDGEMENTS
This paper was funded by the Deanship of Scientific Research (DSR), King Abdulaziz University, Jeddah, under grant No. (829-006-D1433). The authors therefore acknowledge with thanks the DSR's technical and financial support.
REFERENCES
[1] Rasmussen, N. & Walden, D. 1999. Observation from the 1997-1998 CQM study group on cycle time reduction. Cycle Time Reduction, pp. 1-50. [ Links ]
[2] Pinedo, M., Chao, X. 1999. Operations scheduling. United States of America: McGraw Hill, pp. 116-122. [ Links ]
[3] Jordan, D.W. 1993. Reducing project durations through cycle time reduction. American Association of Cost Engineers Transactions (AACE), pp. F.3.1-F.3.4. [ Links ]
[4] Laidlaw, F.J. 1991. Acceleration of technology development by the advanced technology program: The experience of 28 projects funded. Cycle Time, pp. 3-43. [ Links ]
[5] Groves, R. 1991. Leadership in tomorrow's global marketplace. Vital Speeches of the Day, pp. 144-146. [ Links ]
[6] Horning, F.N. & McCann, J.P. 2003. Find out what's slowing the process from order to delivery and speed things up. Post-Gazette.com Business. http://old.post-gazette.com/businessnews/20030304forummccann0304p6.asp [July 28, 2013]. [ Links ]
[7] Horning, F.N. & McCann, J.P. 2001. The private sector: Cycle time reduction. Business News, pp. 1-4. [ Links ]
[8] Ko, C.S., Cha, M.S. & Rho, J.J. 2007. A case study for determining standard time in a multi-pattern and short life-cycle production system. Computers & Industrial Engineering, 53, pp. 321-325. [ Links ]
[9] Sivakumar, A.I. & Chong, C.S. 2001. A simulation based analysis of cycle time distribution, and throughput in semiconductor backend manufacturing. Computers in Industry, 59, pp. 78-45. [ Links ]
[10] Yang, F. 2010. Neural network metamodeling for cycle time-throughput profiles in manufacturing. European Journal of Operational Research, 205, pp.172-185. [ Links ]
[11] Papavasileiou, V., Koulouris, A., Siletti, C. & Petrildes, D. 2007. Optimize manufacturing of pharmaceutical products with process simulation and production scheduling tools. Institution of Chemical Engineers, 85, pp.1086-1097. [ Links ]
[12] Wang, M., Sun, G. & Wang D. 1993. Manufacturing simulation - An effective tool for productivity improvement productivity and reducing manufacturing cycle time through simulation modeling. Proceeding of 3rd International Microelectronic & Systems Conference, Malaysia. [ Links ]
[13] Domaschke, J. & Brown, S. 1998. Effective implementation of cycle time reduction. Proceeding of the 1998 Winter Simulation Conference, USA. [ Links ]
[14] Toh, G.K., Teck, U.W., Lie, A., Sun, G., Ming, W. & Kok, K. 1995. Reducing manufacturing cycle time of wafer fab with simulation. World Scientific, pp. 889-896. [ Links ]
[15] Zhou, M., Chen, Z., He, W. & Chen, X. 2010. Representing and matching simulation cases: A case-based reasoning approach. Computers & Industrial Engineering, 59, pp. 115-125. [ Links ]
[16] Na Li, N., Zhang, M.T., Deng, S., Lee, Z.H., Zhang, L. & Zheng, L. 2007. Single- station performance evaluation and improvement in semiconductor manufacturing: A graphical approach. Int. J. Production Economics, 107, pp. 397-403. [ Links ]
[17] Cuatrecasas, A.L., Santos, F.J. & Sanchez, C.V. 2011. The Operations-Time Chart: A graphical tool to evaluate the performance of production systems - From batch-and-queue to lean manufacturing. Computers & Industrial Engineering, 61, pp. 663-675. [ Links ]
[18] Chiu, Y.S.P., Lina, H.D. & Chang, H.H. 2011. Mathematical modeling for solving manufacturing run time problem with defective rate and random machine breakdown. Computers & Industrial Engineering, 60, pp. 576-584. [ Links ]
[19] Löfgren, B. & Tillman, A.M. 2011. Relating manufacturing system configuration to life-cycle environmental performance: Discrete-event simulation supplemented with LCA. Journal of Cleaner Production, pp. 2015-2024. [ Links ]
[20] Thiesse, F. & Fleisch, E. 2008. On the value of location information to lot scheduling in complex manufacturing processes. Int. J. Production Economics, 112, pp. 532-547. [ Links ]
[21] Goss, R., Maxim, C., Adhikari, D. & Rothe, J. 2011. Leveraging new SEMI standard to reduce waste and improve flow for semiconductor manufacturing. Robotics and Computer-Integrated Manufacturing, 26, pp. 658-664. [ Links ]
[22] Djassemi, M. 2005. A simulation analysis of factors influencing the flexibility of cellular manufacturing. International Journal of Production Research, 43(10), pp. 2101-2111. [ Links ]
[23] Sukhotu, V. & Peter, B.A. 2012. Modelling of material handling systems for facility design in manufacturing environments with job-specific routing. International Journal of Production Research, 50(24), pp. 7285-7302. [ Links ]
[24] Marcheta, G., Melacinia, M., Perottia, S. & Tappiaa, E. 2012. Analytical model to estimate performances of autonomous vehicle storage and retrieval systems for product totes. International Journal of Production Research, 50(24), pp. 7134-7148. [ Links ]
[25] Lina, H., Fana, Y. & Stephen T.N. 2009. Manufacturing process analysis with support of workflow modelling and simulation. International Journal of Production Research, 47(7), pp. 1773-1790. [ Links ]
[26] Cortes, P., Onieva, L. & Guadix, J. 2010. Optimising and simulating the assembly line balancing problem in a motorcycle manufacturing company: A case study. International Journal of Production Research, 48(10), pp. 3637-3656. [ Links ]
[27] Barnes, R.M. 1980. Motion and time study: Design and measurement of work. 7th edition, New York: John Wiley. [ Links ]
[28] Law, A.M. & Kelton, W.D. 2007. Simulation modeling and analysis, 4th edition, McGraw-Hill. [ Links ]
* Corresponding author

