


Services on Demand
Article
 English (pdf)
 Article in xml format
 Article references
Indicators

Related links
-
 Cited by Google
 -
 Similars in Google
Share

 Permalink
South African Journal of Industrial Engineering
On-line version ISSN 2224-7890
Print version ISSN 1012-277X
S. Afr. J. Ind. Eng. vol.25 n.1 Pretoria Jan. 2014
GENERAL ARTICLES
Adapting modern portfolio theoryfor prioritising asset care planning inindustry
A.F. van den HonertI; P.J. VlokII, *
IDepartment of Industrial EngineeringStellenbosch University, South Africa
IIDepartment of Industrial EngineeringStellenbosch University, South Africa. pjvlok@sun.ac.za
ABSTRACT
Productivity improvement within any organisation can lead to increased turnover. This study focuses on developing a maintenance productivity improvement model that is based upon an established financial investment portfolio technique known as the Modern Portfolio Theory (MPT). The model can be used as a tool to minimise and diversify the long term risk associated with variances or fluctuations in the increase in productivity in multiple maintenance service centres. This is achieved by optimising the most efficient way of splitting resources, such as time and money, between these multiple service centres, resulting in increased productivity and a more constant maintenance work load. This model is verified through the use of an efficient frontier, resulting in a graphical method to determine the link between the expected increase in productivity and the standard deviation of the increase in productivity. Ultimately this model can be adapted for use in many sectors within an organisation, over and above the application in maintenance prioritisation. This study concludes that the model offers a simple tool to aid decision-making among various combinations of assets within a maintenance context; and this model, adapted from MPT, was successfully validated with the use of an efficient frontier.
OPSOMMING
'n Verbetering in produktiwiteit kan lei tot groei in omset in enige organisasie. Die fokus van hierdie studie is die ontwikkeling van 'n produktiwiteitsverbeteringsmodel in instandhouding. Die model is gebaseer op die gevestigde finansiële beleggings portefeulje tegniek bekend as die 'Moderne Portefeulje Teorie' (MPT). Die model kan gebruik word om die langtermyn risiko as gevolg van afwykings en/of verwisselinge in die produktiwiteit van verskeie onderhoudswerkswinkels te verminder en/of te diversifiseer. Die verbetering kan bereik word deur die optimering van die mees doeltreffende manier om hulpbronne te verdeel tussen verskeie dienssentrums. 'Hulpbronne' kan byvoorbeeld tyd of geld wees. Die optimering lei tot 'n verbetering in produktiwiteit van 'n organisasie sowel as 'n meer konstante werkslading vir die onderhoudswerkswinkels. Die model is geverifieer met die gebruik van 'n doeltreffende begrensing wat lei tot 'n grafiese voorstelling om die verband tussen die verwagte toename in produktiwiteit en die standaard afwyking van die toename in produktiwiteit te bepaal. Die toekomstige vooruitsig vir hierdie model is dat dit kan aangepas word om van toepassing te wees in vele segmente van 'n organisasie. Die resultate van hierdie studie toon dat hierdie model as 'n eenvoudige instrument kan gebruik word om met die besluitneming in verband met die onderhoud van verskeie kombinasies van bates te vergemaklik. Die resultate toon dat die model, wat gebaseer is op die MPT, suksesvol geverifieer is deur die gebruik van 'n doeltreffende grens.
1 INTRODUCTION
There are currently two major categories of maintenance in industry: corrective maintenance and preventive maintenance [1]. The majority of companies choose the former, only maintaining their assets upon failure. This is due to the perception that implementing preventive maintenance wastes money, as it pays for something to be maintained periodically that is not broken [2]. It is preventive maintenance, however, that keeps assets from breaking.
Productivity can be seen as the efficiency with which an organisation converts its inputs into outputs [3]. Thus, in order to increase the efficiency of maintenance, it is desirable to increase the productivity of the maintenance work centre while minimising the variability of productivity. Hence there will be a more constant flow of work, indicating that preventive maintenance is partially in use.
In order to get top management to agree to make use of preventive maintenance, a tool is required to aid them in splitting the maintenance budget so that preventive maintenance is included over and above their normal failure maintenance budget. This will give them the best return for the money they invest. In order to do this, Modern Portfolio Theory (MPT) is adapted to optimise the productivity of the maintenance work centres within an organisation.
The main drawback with MPT is that it relies on historical data. This is because, when working with stocks, their past trends have no influence on future trends. However, with productivity, patterns of past events can be used to pre-construct future patterns [4]; thus the use of MPT will be advantageous in this application.
In this article the basics of MPT are discussed, followed by how it has been adapted for the asset care field. Next, a case study is presented with data from the Anglo American Group's Kumba iron ore mine. Finally, validation of the model is achieved by the use of an efficient frontier.
2 THE MODERN PORTFOLIO THEORY
In 1952 Harry Markowitz published his newly-developed Modern Portfolio Theory (MPT) in a paper entitled "Portfolio Selection" [5]. MPT is a financial theory used to assist investors in creating a portfolio that minimises the market risk for a given expected return, or maximises the expected return for a given level of market risk [6]. The portfolio's overall risk is minimised further through diversification within the portfolio's assets [7]. The method used in MPT, together with the major equations needed for MPT for financial assets (such as stocks), are outlined below.
First, after selecting various assets and determining their monthly prices, the assets' return is calculated. Asset return is the monthly percentage increase of the asset, and can be written as follows:
where
Ri,j is the return from month i to month i+1 of asset j
Xi+ij is the value at month i+1 of asset j
Xi,j is the value at month i of asset j
Next, the expected return of the portfolio is needed. It is calculated as the weighted average of expected returns of the individual assets within the portfolio, and can be written as follows [8]:
where
E(RP) is the expected return of the portfolio
ωi; is the fraction of the portfolio invested in asset i
Ri; is the average return of asset i
However, the portfolio fractions ωi are subject to two constraints, namely,  , and 0 < ωi < 1 where i = 1,2,...,N.
Thereafter it is necessary to define and distinguish between correlation and covariance. Correlation is the measure of how two assets interact with one another, and it can vary between -1 and 1. A correlation of 1 indicates that the two assets react in unison; a correlation of -1 indicates that the two assets move exactly opposite to one other; and a correlation of 0 indicates that the two assets have no connection whatsoever in market shifts [9]. The effectiveness of diversification depends heavily on the correlation coefficients between pairs of assets [10]. The equation for calculating the correlation coefficient is shown below:
where
ρi,j is the correlation between asset i and j
xi is the return of asset i
xj is the return of asset j
n is the sample size
Covariance, much like correlation, is also a measure of the amount by which two assets alter over time. However, its magnitude is different [11]. Covariance can be calculated from the two assets' correlation, as follows [8]:
where
σij is the covariance between asset i and j
ρij is the correlation between asset i and j
σi is the standard deviation of asset i
σj is the standard deviation of asset j
Then the market risk is calculated as the variance of the portfolio's return, which can be written as follows [8]:
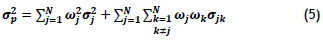
where
 is the variance of the portfolio
ωi is the fraction of the portfolio invested in asset j
σj is the standard deviation of asset j
ωk is the fraction of the portfolio invested in asset k
σJk is the covariance between asset j and k
The portfolio's return volatility or Standard Deviation (SD) comes from the variance of the portfolio, and is calculated as follows:
Once the model is built, the return variance  is minimised by manipulating the fractions of the assets (ωi where i = 1,2,...,N) invested in the portfolio. Extra constraints can be added, such keeping the return above a certain value or constraining individual portfolio weights.
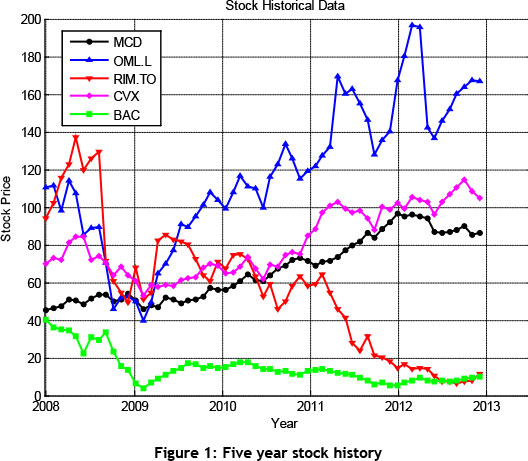
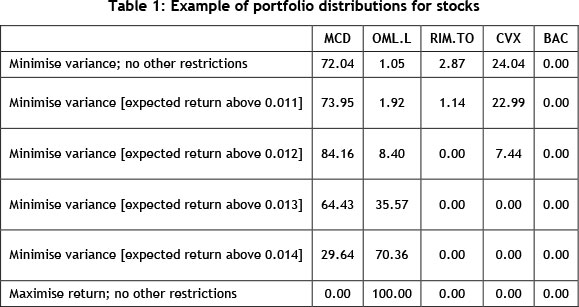
An example of MPT was run, using five well-known financial assets over a period of five years1. The adjusted closing values of the following five financial assets were used: MacDonald's (MCD), Old Mutual plc (OML.L), Research in Motion Limited (RIM.TO), Chevron Corporation (CVX), and Bank of America Corporation (BAC). The historical stock prices of these five financial assets have been plotted in Figure 1. The correlation coefficient between OML.L and CVX is 0.503, which represents a fairly positive relationship between the two stocks. This can be verified by viewing the figures of the previous history of the stocks. This example shows how to invest capital in order to minimise the portfolio risk (variance) while constraining the return to be greater than certain values, as summarised in Table 1.
3 LINKING ASSET CARE INTO MPT
Within the asset care domain, the amount of preventive maintenance achieved should be increased, as this will lower the risk of a catastrophic failure sometime in the future. Intuitively, it can be deduced that minimising the variance in productivity within a maintenance department will encourage more consistent continual maintenance, rather than maintenance upon failure of an asset. Thus, by using MPT as a tool, top management can assess the best way to split their budget to increase the overall maintenance productivity of the company.
It logically follows that - just as the above example assesses different stocks - different maintenance service centres should be assessed. Similarly, the monthly asset value in the above example should be replaced by each maintenance service centre's monthly productivity. Then a few extra constraints can be added, which will be explained below. After that, the variance of increase in productivity is minimised, subject to these extra constraints, resulting in an optimised percentage split that top management can use to distribute an extra budget for improved productivity in maintenance.
Since the variance of the portfolio is being minimised, a constraint can be added to ensure that the increase in productivity (the portfolio's return, in the above example) stays above a certain target level [8]. It was decided to force the portfolio's expected increase in productivity to be greater than or equal to the current average increase in productivity over all the service centres combined. This can be any value or percentage that management desires, as shown by the formula below:
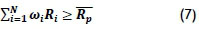
where
ωi is the fraction of the portfolio invested in service centre i
Ri is the average increase in productivity of service centre i
 is the average increase in productivity of all the service centres combined
Another constraint that was implemented was called the 'importance constraint', to ensure that the individual portfolio weights were all greater than or equal to a minimum individual constraint, depending on their importance to the operation of the company as a whole. The importance was calculated as follows:
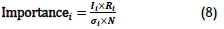
where
It is the percentage importance of service centre i to the company
Ri is the average increase in productivity of service centre i
σi is the standard deviation of service centre i's increase in productivity
N is the number of service centres used in the model
Next, the importance constraint was implemented as follows:
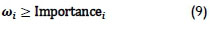
We now discuss the implementation of these constraints in the context of a case study of Anglo American's Kumba iron ore mine at Sishen in the Northern Province.
4 CASE STUDY WITH DATA FROM KUMBA IRON ORE MINE
Within the mining context, it is important to increase the productivity of the maintenance departments by assisting top management with a tool for deciding how best to split resources (financial and time) among the departments. For this article, 'productivity' is defined as the number of tasks completed divided by the number of hours taken to complete these tasks within the service centre. Thus, by increasing the productivity the number of jobs should increase, and the time taken for these tasks should decrease, in turn increasing maintenance efficiency. Data from the past four years from eight service centres on the Kumba iron ore mine was obtained and applied to this model. Intermediate results are below, along with the final results obtained.
Table 2 displays the average increase in productivity and its associated standard deviation, calculated from the data obtained, and also displays the relative importance of each work centre to the production facility as a whole (which can be defined at the user's discretion). All the values presented here are the necessary inputs, apart from the optimisation constraints, required for the model created.
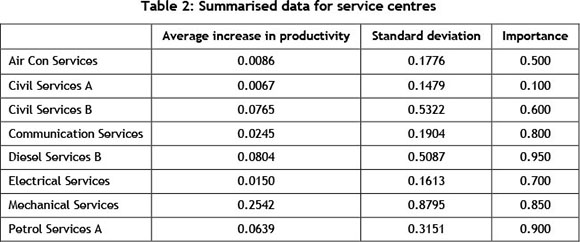
Using the input data from Table 2, the model was run four times using different optimisation constraints. Table 3 shows how management should split the use of time and/or money between the mine's eight service centres used in this case study. This includes implementing the importance constraint and multiple return constraints.
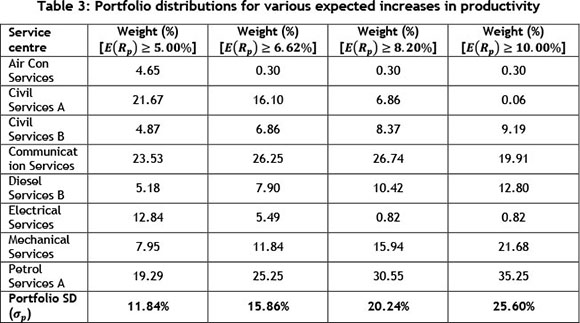
The results in Table 3 show the optimal percentage portfolio split among the eight service centres for the four iterations of the model, using different optimisation constraints each time. The portfolio weights are fairly well distributed for an expected increase in productivity greater than or equal to 5 per cent. However, as the required expected increase in productivity is increased, the portfolio weight shifts more towards Civil Services B, Diesel Services B, Communication Services, Mechanical Services, and Petrol Services A, and is less dependent on the remaining three service centres.
From these results, the optimal component percentages are identified that are needed to distribute assets (financial or time) in order to reduce the variability of the increase in productivity, and thus improve overall productivity and ensure that productivity is more constant, with smaller fluctuations. Next, an efficient frontier is plotted in order to validate these results.
5 THE EFFICIENCY FRONTIER FOR VALIDATION
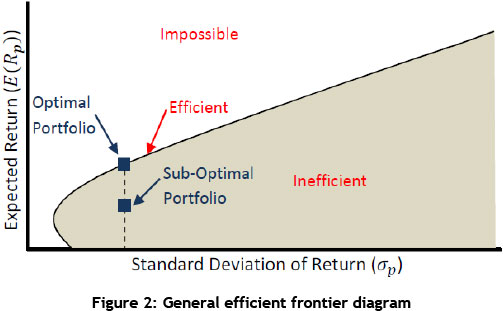
An efficient frontier is a set of optimal portfolios that offers the highest expected return for a specific level of risk, or the lowest risk for a given level of expected return [12]. At least one portfolio can be created from all available investments for every point on the efficient frontier that has the expected risk and return corresponding to that point [13]. It is not possible to have a portfolio lie above the efficient frontier. On the other hand, portfolios that lie below the efficient frontier are sub-optimal, because they do not offer sufficient return for the level of risk [12].
Mathematically, it can be seen that the relationship between expected return and portfolio weight in any asset is linear, and that the relationship between portfolio weight and variance is quadratic [14]. The weights can thus be eliminated, and expected return can be expressed as a quadratic function of variance [14]. It is intuitive that all points below the minimum variance are second-rate, as they represent a lower expected return for any given level of risk [14].
Figure 2 depicts an efficient frontier. As discussed above, the inefficient (where sub-optimal portfolios will lie) and impossible regions can be seen, as well as the efficient frontier line along which all the optimal portfolios will lie.
One method of constructing the efficient frontier is by repeated optimisation, in which the expected return constraint is increased each time. This expected return is plotted against the corresponding standard deviation [15]. A newer, more efficient method of plotting an efficient frontier [16] is presented below.
Through convoluted mathematics, the following relationship between the portfolio's expected return (µp) and the portfolio's standard deviation (σp) is derived [17],
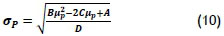
This is subject to:

where
∑ = [σij] is the n x n variance-covariance matrix
µ is a 1 x n column vector of the expected returns
1 is a 1 x n column vector of 1 's
From the equation above, an efficient frontier for the case study data was created to validate the results of the model. Below is a plot of the efficient frontier, along with the individual service centres and the four optimal portfolio selections used in the case study.
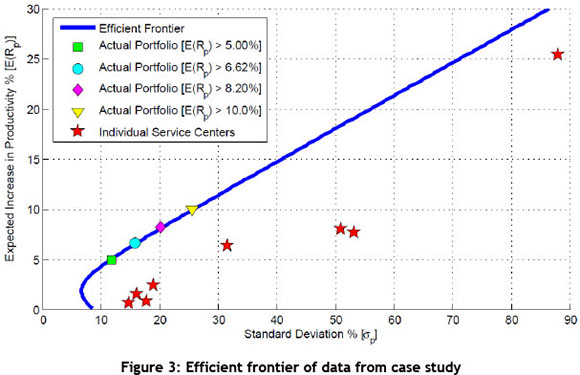
It can been seen on the efficient frontier that the standard deviation increases as the expected return constraint is increased using the optimisation model, and the new portfolio again lies on the efficient frontier. This confirms that the MPT optimisation model is in fact providing the most optimal solution for the given constraints. Management can choose an acceptable level of risk (standard deviation) and then read off its corresponding expected increase in productivity, after which a portfolio can be created to suit these constraints. Similarly, management can choose a desired expected increase in productivity with its associated standard deviation, and another portfolio can be created (Back, 2013).
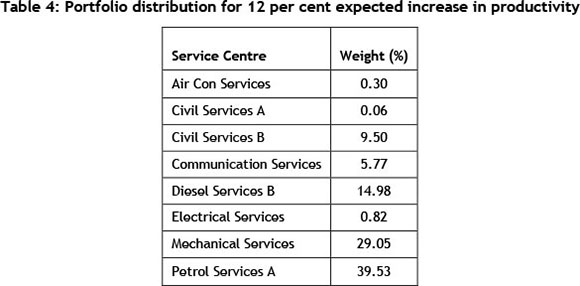
For example: using the case study's efficient frontier, if management desires a 12 per cent expected increase in productivity, they will have to deal with a corresponding standard deviation of 31.8 per cent - which will result in the portfolio split shown in the table below.
6 CONCLUSION
By using this model, with constraints tailored to organisational needs, it is possible to achieve an optimal percentage split among various assets, such as service centres, that can be used by senior management to make decisions and, if implemented, to increase the organisation's overall productivity - which in turn will increase its efficiency. This allows senior management to aim for any rational position along the efficiency frontier that suits the organisation's current requirements for long-term growth.
Furthermore, this model offers management a simple tool for aiding maintenance decision-making among various combinations of assets; yet it can also be adapted for use in many other areas of an organisation.
REFERENCES
[1] Mobley, Keith R. 2004. Maintenance fundamentals. Elsevier Inc. [ Links ]
[2] Strategic Work Systems. 2013. Strategic work systems. [Online]. http://www.swspitcrew.com/articles/articles.asp?ID=144 [ Links ]
[3] The Times 100 Business Case Studies. 2013. The Times 100 business case studies. [Online]. http://businesscasestudies.co.uk/business-theory/operations/improving-productivity.html#axzz2Ps4LTItZ [ Links ]
[4] Lee, Michael. 2013. Knowing our future. Infinite Ideas Limited. [ Links ]
[5] Investopedia. 2013. Investopedia: Modern portfolio theory. [Online]. http://www.investopedia.com/terms/m/modernportfoliotheory.asp [ Links ]
[6] Gruber, Edwin J. & Elton, Martin J. 1997. Modern portfolio theory, 1950 to date, Journal of Banking & Finance, pp. 1743-1759. [ Links ]
[7] Markowitz, Harry. 2012. Portfolio selection, The Journal of Finance, pp. 77-91. [ Links ]
[8] Gruber, Edwin J., Elton, Martin J., Brown, Stephen J. & Goetzmann, William N. 2003. Modern portfolio theory and investment analysis. John Wiley & Sons. [ Links ]
[9] Columbia Business School. 2013. Columbia Business School. [Online]. http://ci.columbia.edu/ci/premba\_test/c0331/s7/s7\_5.html [ Links ]
[10] Elmhurst College. 2013. Elmhurst College. [Online]. http://www.elmhurst.edu/~cbe/vcroom/bus442/learn/test2.html [ Links ]
[11] Investopedia. 2013. Investopedia: Calculating covariance. [Online]. http://www.investopedia.com/articles/financial-theory/11/calculating-covariance.asp [ Links ]
[12] Investopedia. 2013. Investopedia: Efficient frontier. [Online]. http://www.investopedia.com/terms/e/efficientfrontier.asp [ Links ]
[13] Investing Answers. 2013. Investing Answers. [Online]. http://www.investinganswers.com/financial-dictionary/investing/efficient-frontier-1010 [ Links ]
[14] Back of the Envelope. 2013. Back of the Envelope. [Online]. http://vineetv.wordpress.com/2012/11/16/fm-markowitzs-portfolio-theory-ii/ [ Links ]
[15] Rardin, Ronald L. 1998. Optimization in operations research. Prentice Hall. [ Links ]
[16] The Calculating Investor. 2011. The Calculating Investor. [Online]. http://www.calculatinginvestor.com/2011/06/07/efficient-frontier-1/ [ Links ]
[17] Roychoudhury, Saurav. 2007. The optimal portfolio and the efficient frontier. National Science Foundation. [ Links ]
* Corresponding author
1 The historical financial data can be found at http://finance.yahoo.com/.

