


Services on Demand
Article
 English (pdf)
 Article in xml format
 Article references
Indicators

Related links
-
 Cited by Google
 -
 Similars in Google
Share

 Permalink
South African Journal of Industrial Engineering
On-line version ISSN 2224-7890
Print version ISSN 1012-277X
S. Afr. J. Ind. Eng. vol.25 n.1 Pretoria Jan. 2014
GENERAL ARTICLES
microfocus x-ray computed tomography (CT) analysis of laser sintered parts#
A. du PlessisI, II, *; T. SeifertIII; G. BooysenIV; J. ElsIV
ICT Scanner Unit, Central Analytical Facilities Stellenbosch University, South Africa. anton2@sun.ac.za
IIPhysics Department Stellenbosch University, South Africa
IIIDepartment of Forestry and Wood Science Stellenbosch University, South Africa
IVCentre for Rapid Prototyping and Manufacturing Central University of Technology Bloemfontein, South Africa
ABSTRACT
Microfocus X-ray computed tomography (CT) scanning is a three-dimensional (3D) non-destructive technique that is useful in many research and technology fields. Similar to two-dimensional (2D) X-ray inspections, this 3D technology allows the investigation of almost any material down to 1 micron spatial resolution and higher. In this paper we present a characterisation and demonstration of the use of CT to analyse the 3D volume of laser sintered parts including analyses of porosity, dimensional measurement of cracks and other features, and a demonstration of quality testing methods which can be used to quickly identify problems in production.
OPSOMMING
Mikrofokus X-straal rekenaar-tomografie (RT) is 'n drie-dimensionele (3D) nie-destruktiewe tegniek wat bruikbaar is in baie navorsing en tegnologie velde. Soortgelyk aan twee dimensionele (2D) X-straal inspeksies, laat hierdie 3D tegnologie dit toe om enige materiaal in 3D te ondersoek tot 1 mikron (en hoër) ruimtelike resolusie. In hierdie artikel word 'n karakterisering en demonstrasie van die gebruik van RT aangebied om die 3D volume van laser-gesinterde onderdele te analiseer, insluitend die analise van porositeit, dimensionele metings van krake en ander eienskappe en 'n demonstrasie van kwaliteit toets metodes wat gebruik kan word om vinnig probleme in produksie te identifiseer.
1 INTRODUCTION
X-ray computed tomography (CT) scanners have been widely used since the 1970s for medical imaging; and they continue today to be unique and very useful tools in the medical diagnosis of soft tissue and bone. In the early stages of non-destructive testing and research, medical scanners were frequently used - as they still are - for this purpose [1,2]. Since then, specialised industrial X-ray CT systems have been developed with higher X-ray penetration energies and better spatial resolution than medical scanners. In recent years industrial CT has become an established technique for the industrial and academic investigation of almost any material. Industrial applications include its use as a reverse engineering tool, similar to a coordinate measurement machine (CMM), but with the advantage of being able to measure hidden surfaces - an important factor in identifying material and sample problems in production, especially in the aerospace and automotive sectors [3]. As the technology becomes more readily available, with increased computing power and storage space at lower costs, it is envisioned that more and more cost-effective and feasible industrial CT applications will emerge. In the academic research environment, industrial CT scanning has been applied in many diverse fields, including geology [4,5], archaeology [6], forensic science [7], forestry and wood science [2,8], biology [1,9], soil science [10], composite science [11], and mechanical and electronic engineering [12,13].
The working principles of CT can be found in numerous good literature sources, such as the recent one by Kalender [14]. A recent good review of the use of CT in geological applications is presented in Ketchan and Carlson [15], which covers all the relevant issues for industrial and scientific microfocus CT. Industrial CT has not been specifically reviewed recently, though there are many publications and well-known applications of CT in industrial engineering and manufacturing processes (see, for example, [12, 16, 17]).
In this paper, a basic characterisation and demonstration of the capabilities of the recently-commissioned microfocus X-ray CT scanner at Stellenbosch University is presented, focusing the examples on laser sintered parts provided by the Centre for Rapid Prototyping and Manufacturing at the Central University of Technology, Free State. This demonstration includes examples of dimensional measurement, volume determination, and porosity quantification. Such information can be used to improve the laser sintering process - for example, to minimise porosity by varying laser sintering parameters and measuring the resulting porosity using CT scanning. CT scanning can also be used for quality control in a production process. It can be applied to any part or component manufactured in any process, and is not limited to laser sintered parts.
2 EXPERIMENTAL DETAILS
The Stellenbosch CT scanner facility, forming part of the Stellenbosch University's Central Analytical Facilities, was launched in April 2012. The instrument is a General Electric Phoenix V|Tome|X L240 with additional NF180 option. This is a system with two tubes, a reflection (direct) type tube up to 240 kV, and a transmission tube up to 180 kV that is meant for higher resolution work, with a minimum focal spot size of 700 nm.
The sample is placed on a rotating stage, and two-dimensional (2D) X-ray images are acquired at various angles around the object as it rotates. These images are then reconstructed after scanning to provide full three-dimensional (3D) density data. The data can then be manipulated using volume imaging software. Full 3D rendering of images with different thresholding allows one to view images of specific components or parts of objects. The data can also be presented in the form of thin slice images, as a stack of 2D slices, Digital Imaging and Communications in Medicine (DICOM), or other formats, depending on client needs. 2D inspection without reconstruction is also simple and fast and much cheaper than full 3D reconstruction. For the largest single scannable volume, spatial resolution (volumetric pixel or 'voxel' size) is 150 microns, while smaller samples allow improved resolutions down to 1 micron. The absolute largest sample size is 60 cm wide and 120 cm high, attained using multi-scanning and detector shifting. For metals, the limitation lies in the maximum penetrating power; but there is no clear guideline for this, since less penetration will simply result in lower contrast and imaging quality.
Reconstruction is performed on a cluster of PCs using the Datos software that is provided with the system. 3D data sets are analysed further using VG Studio Max 2.1, as well as demo versions of additional modules of VG Studio Max and VSG Avizo Fire. A dedicated workstation is also available for client use for large data set manipulation and analysis.
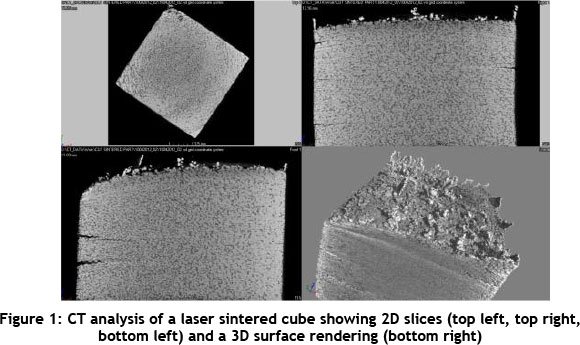
As a simple example, the CT analysis of a laser sintered cube is shown in Figure 1, both as 2D slices and as a 3D surface view.
3 DIMENSIONAL MEASUREMENT
For dimensional metrology, there is no standard dimensional calibration procedure for industrial CT scanners. A technical overview of CT scanning can be found in the form of an ASTM publication [18]. There have been numerous recent efforts to produce dimensional calibration standard objects, which are descriptions of methodologies for dimensional metrology and for comparing dimensional measurement accuracy between various laboratories [19-22]. In this initial characterisation, we used a set of gauge blocks from Mitutoyo (516 series) obtained from the coordinate measurement machine (CMM) at the Stellenbosch University Rapid Product Development Labs. These rectangular steel blocks have NIST-traceable certified dimensions ranging from 1 mm to 100 mm, accurate to within 0.3 microns. Dimensional measurement can be done with the CT scanner in three ways: (1) 2D inspection using enlargement factor calculation; (2) 2D inspection using accurate translation stage and cross-hair; and (3) full 3D CT scan and dimensional analysis using software such as VG Studio or Avizo Fire.
Using standard 2D inspections, dimensions can be determined either directly by using the translational stage movement while watching a fixed point on the image (from one edge to the next), or by using a function calculating the image enlargement factor for the given position. The latter is less accurate due to various factors, including changes in X-ray emission angle and less-than-optimal initial enlargement calibration function. The direct method, using the accurate translation stage distances, only suffers from the problem that a distance from one edge to another edge will seem to vary due to the loss of depth information, making it possible to make measurement errors.
Using a full 3D CT scan of the calibration blocks (see Figure 2), dimensional measurements can be done more accurately; but again this depends on various factors such as initial dimensional calibration, X-ray emission characteristics, data reconstruction parameter variations, choice of edge position in a gradient region (edge effect), and problems arising (such as beam hardening). A dimensional calibration was done with a series of calibration blocks. The results are shown in Figure 3. Other forms of dimensional calibration have been suggested and implemented elsewhere, such as calibration cubes with glass spheres or hollows. The authors are in the process of developing similar dimensional standard objects for this range and for the range from 1 to 100 microns, which is used for image resolution assessment.
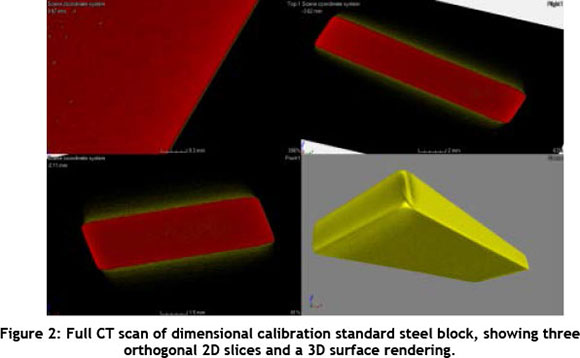
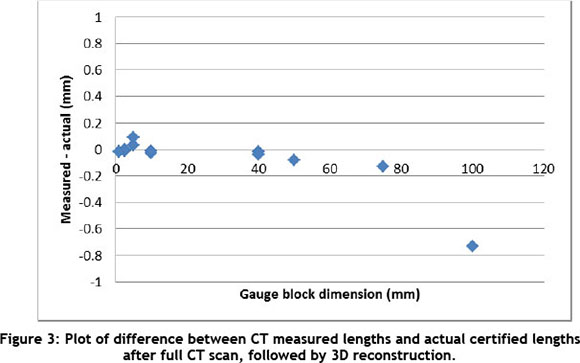
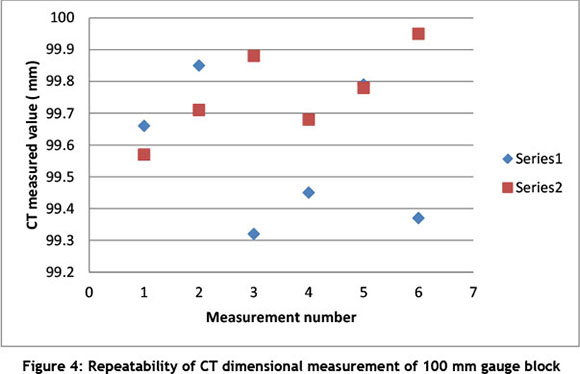
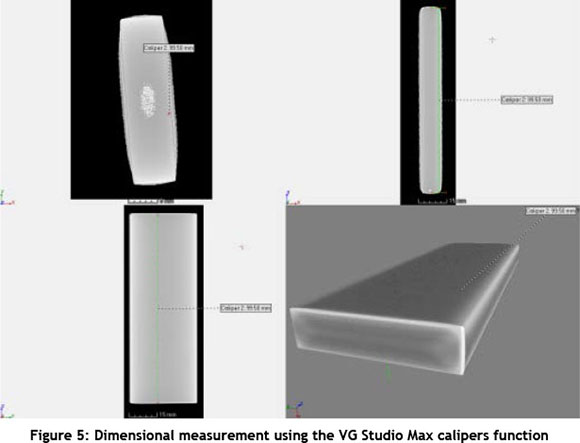
Figure 4 demonstrates the typical repeatability of the dimensional measurement. The differences can be attributed to unwanted artefacts reducing the quality of the edges where the measurement is done, as shown in Figure 5. Improvements to the scan and reconstruction settings can change this, but this is shown as a typical result without special precautions. The two series are two scans taken with 54 micron and 104 micron voxel sizes respectively; the measurement number refers to measurements taken at different places on the block data set.
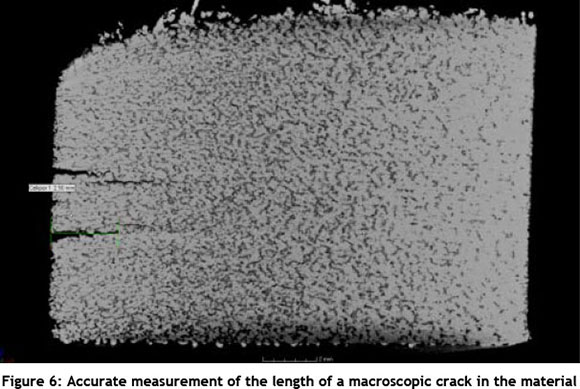
A simple dimensional measurement on a laser sintered part is shown in Figure 6, where the length of a crack in the cube is measured as 2.5 mm.
4 DENSITY CALIBRATION AND STANDARD PHANTOMS
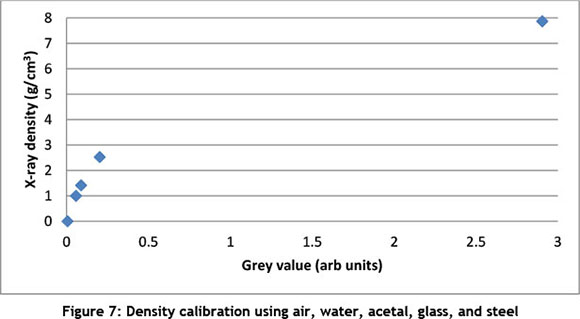
A preliminary density calibration was conducted by using air, water, acetal, glass, and steel. The results in Figure 7 show that a larger grey value corresponds to increased density, as expected. Such a calibration function can be further expanded in the region of interest - for example, by using more types of metals when the density of a metal is to be determined accurately. Clearly, density variations within a sample will be distinguishable, as will voids or pores in a metal, since the difference in grey value is considerable.
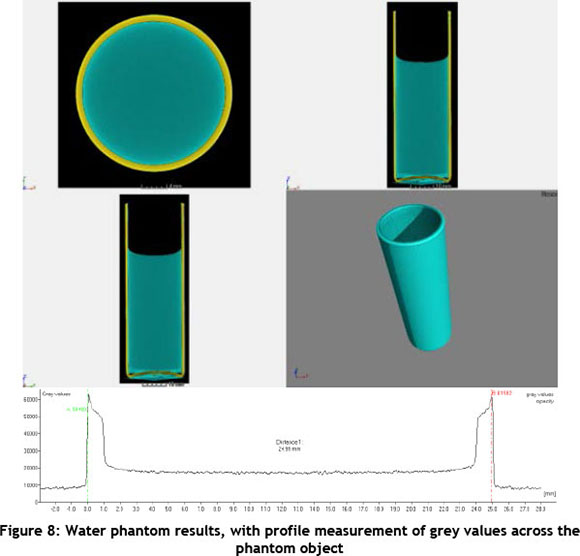
A standard water phantom, used widely in CT standardisation and density calibration, is shown in Figure 8. This shows the separation of glass, water, and air clearly. A grey value cross section is also shown, which indicates the expected result that the water density is constant across the tube. The glass seems to have a more dense outer shell. Such a phantom is used to confirm the lack of unwanted effects or image problems.
5 POROSITY ANALYSIS
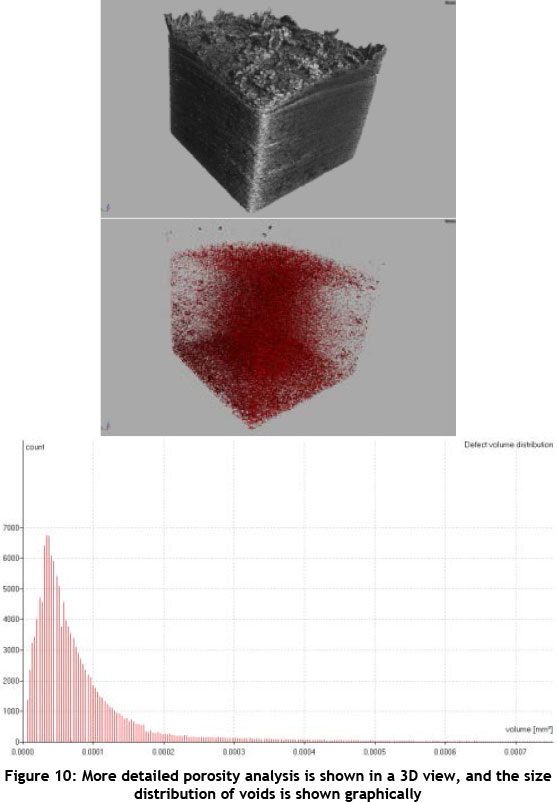
Porosity analysis can be done in detail, using different kinds of software. One such example is VG Studio Max 2.1. A very simple check for porosity can be provided by thresholding the enclosed voids and calculating the total void volume against the total material volume. This was done for a representative 3D volume within the sintered cube, providing a value of 12 per cent void volume, as shown in Figure 9. A similar calculation done with Avizo Fire resulted in a value of 13 per cent; small differences were due to choice of subvolume and visual discrimination of void edges. A demonstration of a more detailed analysis is shown in Figure 10. In this analysis, the void volumes are calculated for each void, and thus the void volume distribution can be determined. A 3D view of the identified voids is shown next to a 3D surface view of the same part for visual inspection of the spatial distribution of voids. Increased porosity was observed in the middle of the cube, which might be explained by the laser scanning velocity profile in the laser sintering process. (Slower turnaround at edges can result in more melting and hence less porosity.)

6 DEFECT DETECTION QUALITY CONTROL FOR LASER SINTERED PART
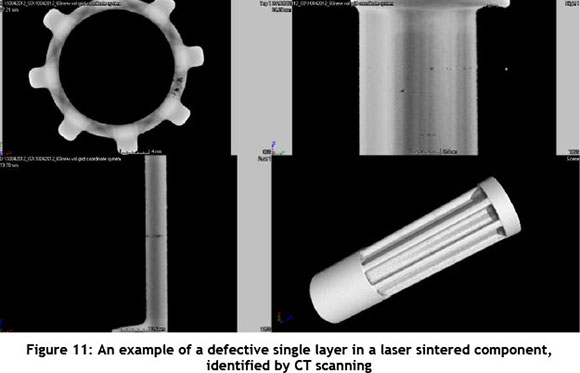
An example of defect detection is shown in Figure 13, where a single layer of the part was found to have significant porosity, but it was not found elsewhere in the part. This can be explained by a problem in the laser sintering process: one layer was faulty because of a problem with the powder delivery or laser power while sintering that layer. This defect was not known before scanning, but it was easily found, indicating the value of this kind of 3D inspection technology.
7 CONCLUSION
We have presented a basic characterisation of the recently-established CT scanner facility at Stellenbosch University. Analyses of particular interest to the laser sintering and rapid product development (3D printing) community were presented.
Dimensional calibration was demonstrated, as well as the process of dimensional measurement from CT data. This is especially useful for the accurate and non-destructive measurement of components, and allows, for example, wall thickness measurements. Density calibration was demonstrated, and the use of phantoms in the CT scanning process was discussed. Image quality, 2D inspections, and artefacts were also discussed. The measurement of porosity and defects within metal parts were demonstrated with actual laser additive manufactured components.
Other useful applications of the technology include the generation of surfaces from scan data, including internal surfaces - which is not possible with laser scanners, for example. Such CAD data can be compared with original CAD data (part-to-CAD comparison), or different parts can be compared with each other for quality control in production processes. The analysis of variations in density and porosity within components is also possible in any material and from any production process, for metals, plastics, or composite materials. We hope this stimulates further interest in making use of this technology, in both academia and industry in South Africa.
ACKNOWLEDGEMENT
We acknowledge VSG Avizo Fire and VG Studio Max for demo versions of their software and support. We also acknowledge financial support from the NRF and from Stellenbosch University. The instrument was purchased with a grant from the NRF, and co-funded by the University. This paper was presented at the Rapdasa conference in November 2012.
REFERENCES
[1] Nikolova, P., Blaschke, H., Matyssek, R., Pretzsch, H. & Seifert, T. 2009. Combined application of computer tomography and light microscopy for analysis of conductive xylem area of beech and spruce coarse roots. European Journal of Forest Research, 128(2), 145-153. [ Links ]
[2] Seifert, T., Nickel M. & Pretzsch, H. 2010. Analysing the long-term effects of artificial pruning of wild cherry by computer tomography. Trees 24(5), 797-808. [ Links ]
[3] Simon, M., Tiseanu. I., Sauerwein, C., Wälischmiller, H., Sindel, M., Brodmann, M. & Schmücker, M. 2006. Advanced computed tomography system for the inspection of large aluminium car bodies. European Conference on nondestructive testing, Berlin. TH 3.4.2. Online: http://www.ndt.net/article/ecndt2006/sessi-92.htm. [ Links ]
[4] Cnudde, V., Masschaele, B., Dierick, M., Vlassenbroeck, J., Van Hoorebeke, M. & Jacobs, P. 2006. Recent progress in X-ray CT as a geosciences tool. Applied Geochemistry, 21(5), 826-832. [ Links ]
[5] Friedrich, J.M., Ruzicka, A., Ebel, D.S., Thostenson, J., Rudolph, R.A., Rivers, M.L., Macke, R.J. & Britt, D.T. 2012. Three dimensional petrography of Kernouvé: A story of vein formation, compaction, and metamorphism. 43rd Lunar and Planetary Science Conference, held March 19-23, 2012 at The Woodlands, Texas, 2. [ Links ]
[6] Bugani, S., Cloetens, P., Colombini, M.P., Giachi, G., Janssens, K., Modugno, F., Morselli, L. & Van de Casteele, E. 2008. Evaluation of conservation treatments for archaeological waterlogged wooden artefacts. 9th International Conference on NDT of Art, Jerusalem Israel, 25-30 May 2008, 6. [ Links ]
[7] Vandevoor, F.M, Bergmans, L., Van Cleynenbreugel, J., Bielen, D.J., Lambrechts, P., Wevers, M., Peirs, A., Willems, G. 2004. Age calculation using X-ray microfocus computed tomographical scanning of teeth: A pilot study. Journal of Forensic Science 49(4), 1-4. [ Links ]
[8] Zu Castell, W., Schrödl, S. & Seifert, T. 2005. Volume interpolation of CT images from tree trunks. Plant Biology, 7, 737-744. [ Links ]
[9] Jorgensen, S.M., Demirkaya, O. & Ritman, E.K. 1998. Three-dimensional imaging of vasculature and parenchyma in intact rodent organs with X-ray micro-CT. Am J Physiol Heart Circ Physiol 275, 1103-1114. [ Links ]
[10] Tippkötter, R., Eickhorst, T., Taubner, H., Gredner, B. & Rademaker, G. 2009. Detection of soil water in macropores of undisturbed soil using microfocus X-ray tube computerized tomography ((JCT). Soil and Tillage Research, 105(1), 12-20. [ Links ]
[11] Desplenterea, F., Lomova, S.V., Woerdemana, D.L., Verpoesta, I., Weversa, M. & Bogdanovich, A. 2005. Micro-CT characterization of variability in 3D textile architecture. Composites Science and Technology, 65(13), 1920-1930. [ Links ]
[12] Harrer, B., Kastner, J., Winkler, W. & Degischer, H.P. 2008. On the detection of inhomogeneities in steel by computed tomography. 17th World Conference on Nondestructive Testing, 25-28 Oct 2008, Shanghai, China, 7. [ Links ]
[13] Sekhar, V.N., Neo, S., Yu, L.H., Trigg, A.D. & Kuo, C.C. 2010. Non-destructive testing of a high dense small dimension through silicon via (TSV) array structures by using 3D X-ray computed tomography method (CT scan). 12th Electronics Packaging Technology Conference (EPTC), 462-466. [ Links ]
[14] Kalender, W.A. 2011. Computed tomography: Fundamentals, system technology, image quality, applications. 3rd edition, Publicis Publishing. [ Links ]
[15] Ketchan, R.A. & Carlson, W.D. 2001. Acquisition, optimization and interpretation of X-ray computed tomographic imagery: Applications to the geosciences. Computers & Geosciences, 27, 381-400. [ Links ]
[16] http://en.wikipedia.org/wiki/Industrial_CT_scanning (June 2012). [ Links ]
[17] Lettenbauer, H., Georgi, B. & Weiß, D. 2007. Means to verify the accuracy of CT systems for metrology applications (in the absence of established international standards). International Symposium on Digital industrial Radiology and Computed Tomography, June 25-27, 2007, Lyon, France, 6. [ Links ]
[18] ASTM. 1992. Standard guide for computed tomography (CT) imaging, ASTM designation E 1441-92a. [ Links ]
[19] Bartscher, M., Hilpert, U., Goebbels, J. & Weidemann, G. 2007. Enhancement and proof of accuracy of industrial computed tomography (CT) measurements. Annals of the CIRP, Vol. 56/1. [ Links ]
[20] Bartscher, M., Neukamm, M., Hilpert, U., Neuschaefer-Rube, U., Härtig, F., Kniel, K., Ehrig, K., Staude, A. & Goebbels, J. 2010. Achieving traceability of industrial computed tomography, Key Engineering Materials, 437, 79-83. [ Links ]
[21] Kruth, J.P., Bartscher, M., Carmignato, S., Schmitt, R., De Chiffre, L. & Weckenmann, A. 2010. Computed tomography for dimensional metrology. Annals of the CIRP, Vol. 60. [ Links ]
[22] Carmignato, S. 2012. Accuracy of industrial computed tomography measurements: Experimental results from an international comparison. Annals of the CIRP, Vol. 61. [ Links ]
# This article is an extended version of an article presented at the 2012 RAPDASA conference
* Corresponding author

