


Serviços Personalizados
Artigo
 Inglês (pdf)
 Artigo em XML
 Referências do artigo
Indicadores

Links relacionados
-
 Citado por Google
 -
 Similares em Google
Compartilhar

 Permalink
South African Journal of Industrial Engineering
versão On-line ISSN 2224-7890
versão impressa ISSN 1012-277X
S. Afr. J. Ind. Eng. vol.24 no.3 Pretoria Nov. 2013
CASES STUDIES
Measuring the leanness of manufacturing systems by using fuzzy TOPSIS: A case study of the 'Parizan Sanat' company
M.A. AlemiI; R. AkramII*
IDepartment of Industrial Engineering. Islamic Azad University - Semnan branch. Semnan, Iran. Dr.m.alemi@gmail.com
IIDepartment of Industrial Engineering. Semnan University. Semnan, Iran. Rasoul.Akram@yahoo.com
ABSTRACT
The implementation of lean manufacturing concepts has had a significant impact on various industries. Many companies around the world have attempted to implement lean manufacturing, but the lack of an obvious understanding of lean measurement and its performance has caused its implementation to fail. This paper presents an innovative approach by using fuzzy TOPSIS to measure the production leanness of manufacturing systems, as a paradigm. This approach is applied to the Parizan Sanat company.
OPSOMMING
Die implementering van maer-vervaardigingkonsepte het 'n wesenlike impak op verskeie industrieë gehad. Baie maatskappye wêreldwyd het gepoog om maer-vervaardiging te implementeer, maar die 'n gebrek aan verstaan van die maer-meeting en die gepaardgaande uitvoering daarvan het die gevolg gehad dat die implementering van maervervaardiging misluk het. Hierdie artikel bied 'n innoverende benadering tot die meet van produksie maerheid deur van wasige TOPSIS gebruik te maak. Hierdie benadering word toegepas op die Parizan Sanat maatskappy.
1 INTRODUCTION
Lean production, and related techniques and tools, have become popular over the last two decades because they can bring about remarkable improvements in every part of the manufacturing system. Managers have therefore attempted to enhance productivity and to eliminate waste through lean production techniques. As a result, quality, cost, just-in-time (JIT) delivery, and continuous improvement are the focus of attention. In other words, lean manufacturers make an effort to produce their goods with cost efficiency, pioneer quality, and JIT delivery [1].
Many successful cases from various industries demonstrate the effectiveness of the lean manufacturing concepts. The techniques of waste reduction and continuous improvement help lean practitioners to pursue perfection. However, an effective way to measure the leanness level is absent. This measurement is needed to provide decision-makers with supporting information - such as the current leanness level, the progress of the lean implementation, and the extent of potential improvements - for the correct decision.
This paper presents an innovative approach by using fuzzy TOPSIS to measure the production leanness of a manufacturing system, and as a paradigm. This approach is applied to the Parizan Sanat company.
2 LITERATURE REVIEW
In this section, we review the history of lean production.
2.1 History of lean production
The idea of conducting manufacturing processes in a lean manner originated with Toyota, the Japanese automobile manufacturer that for decades has thrived in the context of global competition. In the Toyota production system, Ohno [2] introduces this company's unique production concepts that helped them overcome difficult times after World War II. In an environment with a lack of resources, the Toyota production system (TPS), also known as a just-in-time (JIT) system, was developed to overcome the limited availability of resources -a limitation that makes any mistake unacceptable. So reducing waste on the shop floor became the main mission.
In the 1980s, a research group at MIT investigated the success of TPS. In contrast with the mass production techniques inherited from Henry Ford almost a century ago, the term 'lean production' has been coined to describe the highly efficient production system that uses fewer resources to produce the same number of good quality products. The findings of the investigations are summarised in The Machine that Changed the World [3], which compares lean production with mass production and points out several advantages to, and issues arising from, lean production. This book rapidly caught the attention of manufacturers and researchers, and made the concept of lean manufacturing very popular. Womack & Jones [4] then published Lean Thinking, which scrutinises the concept of lean production.
Lean production is defined by many authors from different points of view. Havardell [5] considers lean production to be a set of tools and techniques that must be correctly selected to improve what is needed. Karlsson and Ahlström [6] develop a model that characterises the principles of lean production. Nine variables of leanness are thus identified: elimination of waste (EW), continuous improvement (CI), zero defects (ZD), JIT deliveries (JIT), pull of materials (PULL), multifunctional teams (MFT), decentralisation (DEC), integration of functions (IF), and vertical information systems (VIS).
Detty & Yingling [7] summarise eight tenets of the lean production philosophy, including process stability, standardised work, level production, just-in-time, quality-at-the-source, visual control, production-stop policy, and continuous improvement. Shah & Ward [8] review 16 key references to the practice of lean manufacturing between 1977 and 1999.
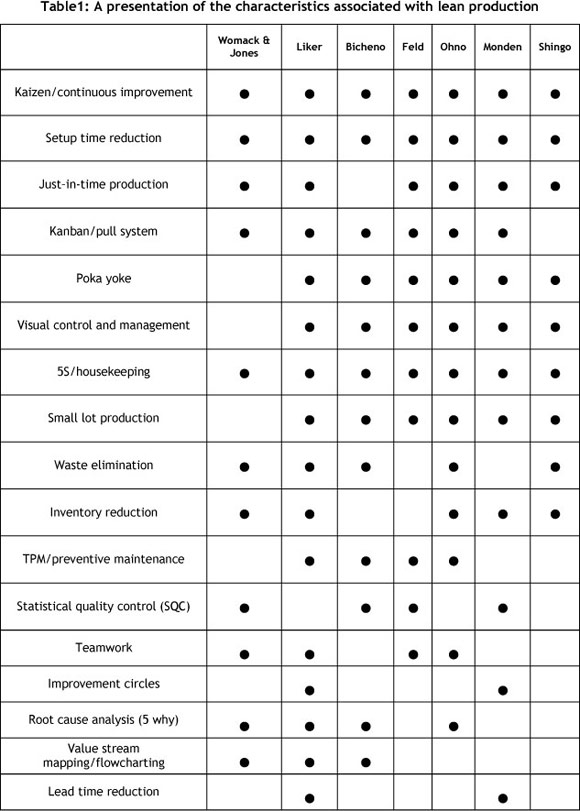
The Table below presents the most frequently-mentioned characteristics of lean production in the work of authors such as Womack, Bicheno [9], Ohno, Monden [10], Liker [11], Feld [12], Dennis [13], Schonberger [14], Shingo [15], Rother & Shook [16], Jones & Womack [17], and Smalley [18].
2.2 Lean performance evaluation
In order to measure the degree of leanness in manufacturing firms, Soriano-Meier & Forrester [19] performed a survey of more than 30 firms in the UK ceramics tableware industry. Wan [20] developed a mathematical model to assess the leanness and agility of manufacturing systems. In his model, the leanness and agility of decision-making units (DMUs) are quantified by comparing them with benchmarks derived from historical data.
Fullerton & Wempe [21] emphasised that it is important to consider both non-financial and financial measures when evaluating lean performance. Bayou & Korvin [22] developed a systematic measurement algorithm to evaluate the leanness of manufacturing systems. They used the fuzzy logic methodology, since they believed that leanness is a matter of degree. While they applied the measure to compare the production leanness of the Ford Motor Company with that of General Motors, they selected the Honda Motor Company as the benchmarking firm. They chose just-in-time (JIT), Kaizen, and quality controls as lean production attributes.
3 THE LEANNESS EVALUATION METHODOLOGY
The evaluation method is applied in the following steps:
Step 1 : In this research, we use a lean production questionnaire by Goodson [23] as an assessment tool to measure the leanness of a production system. This questionnaire has 20 questions with linguistic answers.
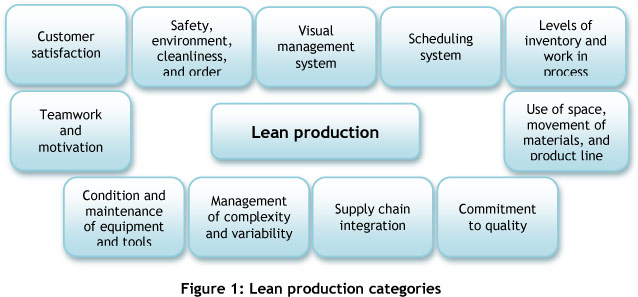
Step 2: As the background to this questionnaire, lean production parameters and features are classified into 11 categories (See Figure 1). Each question in the questionnaire is associated with a category. We fill the rating sheet of categories with the average scores of the associated questions.
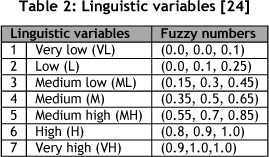
Step 3: After filling the rating sheet of categories, linguistic variables are transformed into fuzzy numbers using Table 2. Now we use fuzzy TOPSIS to determine the ranking order of all the categories. This ranking reflects the current status of the plant before applying important coefficients.
Step 4: To determine the importance of each category from the experts' points of view (ŵj.†), we use paired comparison matrix to specify the degree to which one parameter is preferred over another.
Step 5: Finally, to compute the leanness scoreǂ of the company, we calculate the sum of the rate of each category multiplied by its importance degree, as follows:

3.1 Basic concepts of fuzzy TOPSIS
A decision-making problem is the process of finding the best option from all the feasible alternatives. In almost all such problems, the multiplicity of criteria for judging the alternatives is pervasive. That is, for many such problems, the decision-maker wants to solve a multiple criteria decision-making (MCDM) problem. But in this paper we use fuzzy Topsis to rank the 11 categories of lean production in a company. We use the linguistic variables (shown in Table 2) to rate and describe the situation of the company according to the parameters of lean production.
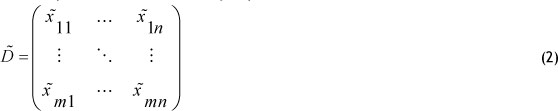
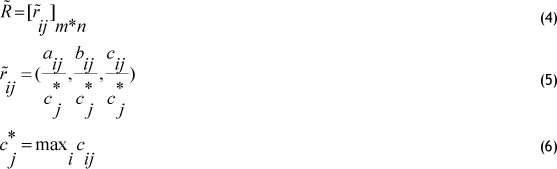
A MCDM problem can be concisely expressed in matrix format as:
where

where
 and
and  are linguistic variables that can be shown by triangular fuzzy numbers:
 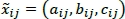 and
and 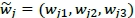 .
.
The rows of the matrix are the 11 categories that form lean production, the columns of the matrix are the persons who have answered the lean questionnaire,  is the rating of i'th category according to the opinion of j'th person about the situation of the company, and
  is the weight of that person's opinion.
To avoid the complicated normalisation formula used in classical TOPSIS, we make use of the linear scale transformation to transform the various criteria scales into a comparable scale. Thus it is possible to obtain the normalised fuzzy decision matrix denoted by  :
:
The normalisation method mentioned above is to preserve the property to which the ranges of normalised triangular fuzzy numbers belong [0, 1].
Considering the different importance of each criterion, one can now construct the weighted normalised fuzzy decision matrix as:

where

According to the weighted normalised fuzzy decision matrix, we know that the elements  are normalised positive triangular fuzzy numbers, and their ranges belong to the closed interval [0, 1]. Then we can define the fuzzy positive ideal solution (FPIS, A*) and fuzzy negative ideal solution (FNIS, A-) as:

where 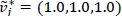 and
and 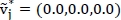
The distance of each category Ai = (i = 1, 2,..., m) from A * and A - can be calculated by:
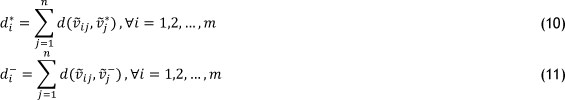
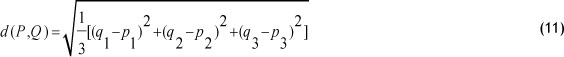
For example, if P and Q are fuzzy numbers, their distance can be calculated by:
Moreover, a closeness coefficient is usually defined to determine the ranking order of all categories once the di* and d-i of each category Ai = (i = 1,2,...,m) has been calculated. The closeness coefficient of each category is calculated by [24]:

4 CASE STUDY
In this research, we distributed the questionnaire to engineers and managers of the Parizan Sanat company, who are very familiar with product lines. (The Parizan Sanat company is one of the largest companies in the field of garage equipment manufacturing, with after-sales services, calibration, and training. This company exports its products to several countries.)
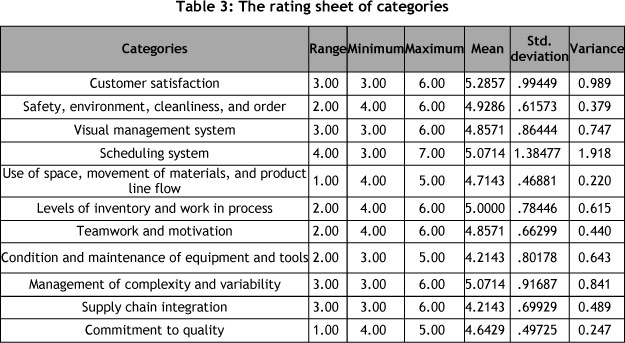
Then the rating sheet of categories was filled. The results are given in Table 3. The Cronbach alpha coefficient for this questionnaire is 0.862.
We transformed the linguistic variables to fuzzy numbers using Table 2; and then we used fuzzy TOPSIS to determine the ranking order of all categories. The results of the fuzzy TOPSIS method are given in Table 4.
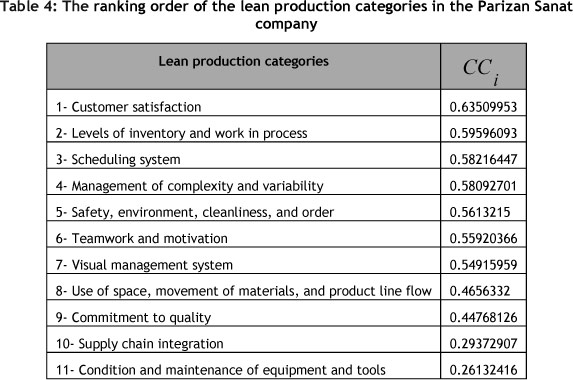
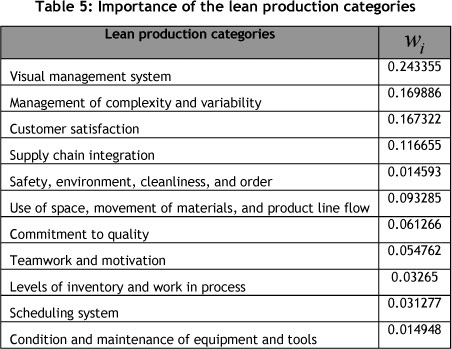
In the next step, pairs of comparison matrix are used to determine the importance of each category from the experts' points of view (Wi). The results are given in Table 5.
4.1 Calculating the leanness score
Finally we compute the leanness score of the company using (Eq.1). The result is computed as below:
L.S = 0.106266 + 0.019458 + 0.018209 + 0.098691 + 0.008191 + 0.030623 + 0.133641 + 0.043437 + 0.027428 + 0.034265 + 0.003906 = 0.524115
Thus the leanness score of the Parizan Sanat company is 0.524115.
The final score is a single, unit-less and integrated lean performance score. According to the proposed lean measurement method, the leanness score shows the whole performance picture of a manufacturing system.
According to our studies, we define a score of 0.5 as a mediocre level of leanness; and whenever this score is closer to 1, it indicates that the production system is more successful and further advanced in the field of the lean production.
5 CONCLUSIONS
This study presents a systematic method of measuring the leanness of manufacturing systems using fuzzy TOPSIS, and develops a measure of lean production with the following characteristics: it is relative, dynamic, long-term, integrative, holistic, and objective. Lean production parameters and features are classified into 11 categories, and their levels are measured in the Parizan Sanat company. Finally, the leanness score of the company is computed.
Visual management system, management of complexity and variability, and customer satisfaction are identified as the most important components of lean performance.
Since the maximum leanness score is 1, we can say that this company is at the mediocre level of leanness. By using Table 4, it is clear that the company should focus more on certain parameters, such as the condition and maintenance of equipment and tools, supply chain integration, and the visual management system.
In addition, the lean performance of all periods can be recorded dynamically, based on a monthly or quarterly period. In this way the lean performance trend of each period can be analysed.
Moreover, we probe all relationships between the lean production categories using the Pearson correlation coefficient, and find the following meaningful relationships:
- There is a positive meaningful relationship between customer satisfaction and the visual management system, with a correlation coefficient of 0.767.
- There is a positive meaningful relationship between the scheduling system, levels of inventory, and work in process, with a correlation coefficient of 0.85.
Based on this method, managers and decision-makers can easily analyse the effectiveness of their manufacturing strategies and identify potential opportunities for improvement.
REFERENCES
[1] Behrouzi, F. & Wong, K.Y. 2011. Lean performance evaluation of manufacturing systems: A dynamic and innovative approach. Procedia Computer Science, 3, 388-395. [ Links ]
[2] Ohno, T. 1988. Toyota Production System. Portland, OR: Productivity Press. [ Links ]
[3] Womack, J.P., & Jones, D.T. 1990. The machine that changed the world. New York, NY: Macmillan. [ Links ]
[4] Womack, J.P., & Jones, D.T. 1996. Lean thinking: Banish waste and create wealth in your corporation. New York, NY: Macmillan. [ Links ]
[5] Havardell, D. 2008. ACA group. http://www.Theacagroup.com. Access date: 22 June 2008. [ Links ]
[6] Karlsson, C. & Ahlstrom, P. 1996. Assessing changes towards lean production. International Journal of Operations and Production Management, 16, 24-41. [ Links ]
[7] Detty, R.B. & Yingling, J.C. 2000. Quantifying benefits of conversion to lean manufacturing with discrete event simulation: A case study. International Journal of Production Research, 38(2), 429-445. [ Links ]
[8] Shah, R. & Ward, P.T. 2003. Lean manufacturing: Context, practice bundles, and performance. Journal of Operations Management, 21, 129-149. [ Links ]
[9] Bicheno, J. 2004. The new lean toolbox: Towards fast, flexible flow (3rd ed.). Buckingham: PICSIE Books. [ Links ]
[10] Monden, Y. 1998. Toyota production system: An integrated approach to just-in-time (2nd ed.). London: Chapman & Hall. [ Links ]
[11] Liker, J.K. 1998. Becoming lean: Inside stories of U.S. manufacturers. New York: Productivity Press. [ Links ]
[12] Feld, W.M. 2001. Lean manufacturing: Tools, techniques, and how to use them. Boca Raton: St. Lucie Press. [ Links ]
[13] Dennis, P. 2002. Lean production simplified: A plain language guide to the world's most powerful production system. New York: Productivity Press. [ Links ]
[14] Schonberger, R.J. 1982. Japanese manufacturing techniques: Nine hidden lessons in simplicity. New York: Free Press. [ Links ]
[15] Shingo, S. 1984. A study of the Toyota production system from an industrial engineering viewpoint. Tokyo: Japan Management Association. [ Links ]
[16] Rother, M. & Shook, J. 1998. Learning to see: Value stream mapping to create value and eliminate muda. Brookline: Lean Enterprise Institute. [ Links ]
[17] Jones, D.T., & Womack, J.P. 2002. Seeing the whole. Brookline, MA: Lean Enterprise Institute. [ Links ]
[18] Smalley, A. 2004. Creating level pull. Brookline, MA: Lean Enterprise Institute. [ Links ]
[19] Soriano-Meier, H. & Forrester, P. 2002. A model for evaluating the degree of leanness of manufacturing firms. International Journal of Integrated Manufacturing Systems,13, 104-109. [ Links ]
[20] Wan, H. 2006. Measuring leanness of manufacturing systems and identifying leanness target by considering agility. Ph.D. thesis, Virginia Polytechnic Institute and State University. [ Links ]
[21] Fullerton, R. & Wempe, W. 2009. Lean manufacturing, non-financial performance measures, and financial performance. International Journal of Operations & Production Management, 29, 214-240. [ Links ]
[22] Bayou, M. & Korvin, A. 2008. Measuring the leanness of manufacturing systems: A case study of Ford Motor Company and General Motors. Journal of Engineering Technology Management, 25, 285-304. [ Links ]
[23] Goodson, R. 2002. Read a plant - fast. Harvard Business Review, 80(5). [ Links ]
[24] Chen, C.-T. 2000. Extensions of the TOPSIS for group decision-making under fuzzy environment. Fuzzy Sets and Systems, 114, 1-9. [ Links ]
† - Wi differs from ŵj mentioned in section 3.1
ǂ - L.S
* Corresponding author

