


Serviços Personalizados
Artigo
 Inglês (pdf)
 Artigo em XML
 Referências do artigo
Indicadores

Links relacionados
-
 Citado por Google
 -
 Similares em Google
Compartilhar

 Permalink
South African Journal of Industrial Engineering
versão On-line ISSN 2224-7890
versão impressa ISSN 1012-277X
S. Afr. J. Ind. Eng. vol.24 no.3 Pretoria Nov. 2013
GENERAL ARTICLES
Examining how manufacturing corporations win orders
Sang-Bing TsaiI, 1, *; Yu-Cheng LeeII; Chia-Huei WuIII; Jiann-Jong GuoIV
IBusiness School. Nankai University, China. Department of Technology Management. Chung-Hua University, Taiwan. sangbing@hotmail.com
IIDepartment of Technology Management. Chung-Hua University, Taiwan. ycl@chu.edu.tw,
IIIDepartment of Technology Management. Chung-Hua University, Taiwan.hsmotel@ms68.hinet.net
IVGraduate Institute of China Studies. Tamkang University, Taiwan.jj03082011@gmail.com
ABSTRACT
This study adopted 14 criteria for order-winners and qualifiers as the attributes for evaluation. The first stage used a simultaneous importance-performance analysis to analyse the competitive market situations of a corporation and its competitors. The second stage used the decision-making trial and evaluation laboratory method to analyse the attributes' causal relationships and levels of influence; then two methods of analysis were integrated to analyse and re-formulate the competitive strategies for the winning orders. As well as serving as a novel theory-based method to examine how manufacturers win orders, the proposals in this study can be applied to practical industry experiences.
OPSOMMING
Veertien kriteria vir mededinging word vir attribuut evaluering voorgehou. Ten aanvang word gelyktydige vertonings gemeet ten opsigte van mededingers. Tweedens word 'n lukraakmetode aangewend by die evaluering van attribute se kousale verhoudings en invloedspeile vir mededingingspeile om sodoende bestellings te bekom. Die resulterende voorstelle kan in die praktyk toegepas word.
1 INTRODUCTION
In an industry environment with intense competition, corporations that endeavor to attain sustainable operations and continuous growth, and that strive to surpass their competitors, must increase their corporation competitiveness to win client orders. Corporation competitiveness entails low production costs, high quality standards, accurate and rapid deliveries, the flexibility to adapt to market demands, and high service standards. Manufacturing industries include numerous competitiveness dimensions, for which scholars have proposed differing propositions. Companies have responsibility for all their stakeholders, not just for their shareholders. Hayes and Wheelwright [1] asserted that, in addition to dimensions such as cost, quality, and delivery, the flexibility dimension is significant in the competitiveness of manufacturing industries. Porter [2] adopted a cost and differentiation perspective, defined the concept of competitive advantages, and proposed a framework with the five forces analysis and three generic strategies to help corporations to discover unique competitiveness and competitive advantages. A number of scholars, such as Kim and Arnond [3], attested that, in addition to the four dimensions of cost, quality, delivery, and flexibility, the service factor is essential. They therefore divided the competitiveness of manufacturing corporations into five dimensions and 15 competitive attributes for measurement [4-12].
In research on the competitiveness of manufacturing corporations, Hill [13] proposed the concept of 'order-winners and qualifiers'. Hill [14] proposed specific steps to connect the manufacturing strategies of corporations with market strategies, and provided 14 orderwinner and qualifier criteria to help corporations to elucidate market demands and analyse competitive situations in the market, and subsequently to develop competitive strategies to win client orders. The 14 attributes of order-winners and qualifiers are price, delivery reliability, delivery speed, quality conformance, demand increases, product range, design, distribution, design leadership, being an existing supplier, marketing and sales, brand name, technical liaison and support, and after-sales support.
We adopted the above 14 order-winner and qualifier criteria to act as evaluative attributes to analyse holistically how manufacturing corporations obtain client orders. We also combined the simultaneous importance-performance analysis (SIPA) and the decisionmaking trial and evaluation laboratory (DEMATEL) methods to examine the competitive market situations of the corporation being studied and its competitors, as well as the causal relationships between competitive attributes. Finally, we proposed competitive strategies to assist corporations to win orders.
2 LITERATURE REVIEW
2.1 Criteria for order-winners and qualifiers
Hill [14] proposed specific steps to connect organisational manufacturing strategies with market strategies. Five steps are required when implementing Hill's framework, which may exhibit a recursive or recurring phenomenon until the market strategies and corporate objectives are completely supported. These five steps include: (1) defining corporate objectives, (2) determining market strategies to achieve corporate objectives, (3) evaluating how products win and qualify for orders in the marketplace, (4) establishing an appropriate manufacturing process and producing relevant products, and (5) providing manufacturing-related infrastructure to support the production system.
The descriptions and definitions of the 14 order-winner and qualifier criteria are summarised below.
1. Price: Hill [14] proposed that the importance of price gradually increases through various stages (introduction, growth, maturity, saturation, and decline) of the product life cycle.
2. Delivery reliability: the primary measurement indicator of delivery reliability is on-time delivery. This represents a supplier's ability to deliver according to the delivery time scheduled with the client.
3. Delivery speed: corporations satisfy client requirements by providing a faster delivery speed than their competitors.
4. Quality conformance: quality is a competitive factor in the market. Numerous corporations do not achieve market competitive advantages because of poor quality.
5. Demand increases: a corporation's ability to respond quickly to increases in client demands is a significant competitive advantage in certain markets.
6. Product range: in responding to various client demands, suppliers should possess diverse product design and manufacturing abilities.
7. Design: the primary purpose of design is to provide products that fulfil client demands or business specifications and requirements.
8. Distribution: the key to distribution is rapid and reliable delivery. Distribution is part of the entire manufacturing process, and has a key role during delivery.
9. Design leadership: design abilities are primarily exhibited in product functions and quality characteristics. If the functions and qualities of the product design exceed those of competitors, corporations occupy a leading design position in the market.
10. Being an existing supplier: by becoming a qualified supplier for clients, corporations can receive client orders. In contrast, if they are not qualified suppliers, regardless of whether corporations provide excellent quality or low prices, customer orders cannot be obtained.
11. Marketing and sales: the key to marketing and sales is understanding various client demands, and discriminating between segmented markets.
12. Brand name: corporations establish brand awareness through various activities such as design, advertisements, and increasing or maintaining market share to ensure the corporation's ability to maintain orders.
13. Technical liaison and support: prior to signing contracts, clients in specific markets search for product designs and manufacturing technique support services from suppliers. This is a crucial competitive attribute in the market.
14. After-sales support: in certain markets, demands such as product use, warranty, repair and maintenance services, and disposal processing are produced following product sales. After-sales support significantly influences business, particularly when product damage substantially affects customers' usage or operations.
The descriptions and definitions of the 14 order-winner and qualifier criteria indicate that the 14 attributes may exhibit causal relationships and mutual influence. In this study, before using these 14 attributes to evaluate order-winning abilities, we clarified the causal relationships and levels of mutual influence between the attributes.
2.2 Simultaneous importance-performance analysis (SIPA)
Burns [15] proposed the SIPA method to analyse simultaneously the concepts of importance, performance, and competitor performance, and in a simple manner. The basic application of SIPA compares a corporation with its competitors. Numerous attributes are selected for discussion, and questionnaires are distributed to clients. The results of the clients' value or importance levels for the attributes are differentiated as high or low. Clients are also requested to score the attributes of the subject corporation and its competitors individually. These scores are differentiated as poor or good. Eight competitive situations are identified, for which Burns separately provides corresponding market competitive strategies.
1. Neglected opportunity: indicates that the attribute has a high level of importance, and that the corporation and its competitors exhibit poor performance, resulting in neglected potential opportunities. Customers can be gained by seizing and investing in these opportunities.
2. Competitive disadvantage: indicates that the attribute has a high level of importance, and that the corporation's performance is inferior to that of its competitors. The corporation is thus in a state of competitive disadvantage that may result in great losses. Immediate improvements are essential.
3. Competitive advantage: indicates that the attribute has a high level of importance and that the corporation's performance is superior to those of its competitors, thus creating a competitive advantage and a niche that requires long-term protection and sustaining.
4. Head-to-head competition: indicates that the attribute has a high level of importance, and that both the corporation and its competitors exhibit excellent performance. Performance should be carefully maintained.
5. Null opportunity: indicates that the attribute has a low level of importance, and that both the corporation and its competitors have poor performance and investment. This is a null opportunity because clients are unwilling to accept or use a corporation's products or services even when this attribute is improved.
6. False alarm: indicates that the attribute has a low level of importance, and that competitors exhibit a performance superior to that of the corporation. This is a false alarm, because this attribute does not influence the subject corporation or result in client loss. No response is required.
7. False advantage: indicates that the attribute has a low level of importance, and that the corporation exhibits a superior performance compared with those of its competitors. This is a false advantage, because the corporation obtains no benefits or returns from this attribute. Corporations should therefore consider transferring resources to other aspects.
8. False competition: indicates that the attribute has a low level of importance, and that both the corporation and its competitors exhibit good performance. This implies hyper-competition. Corporations should consider transferring resources to other aspects.
Of the eight dimensions proposed for competitive situations in the market, neglected opportunity, competitive disadvantage, competitive advantage, and false advantage are particularly critical because they relate significantly to whether corporations obtain orders. In the neglected opportunity dimension, corporations can gain clients by recognising opportunities in advance and investing resources. If competitive disadvantages are not immediately resolved, corporations continue to lose clients. Competitive advantages require long-term continuity to maintain client support. False advantages do not result in additional clients or orders. Resources should therefore be invested in other competitive attributes [16-19].
3 RESEARCH METHODOLOGY
3.1 Decision-making trial and evaluation laboratory (DEMATEL)
The DEMATEL method was developed by the Battelle Memorial Institute, Geneva. Gabus and Fontela [20] initially used this method to resolve complex global problems such as racial issues, starvation, environmental protection, and resource problems. DEMATEL directly compares the correlation between attributes in complex systems, and uses matrix operations to obtain the direct and indirect causal relationships and levels of influence between all attributes. DEMATEL can transform complex systems into causal relationships with definite structures. In other words, DEMATEL simplifies and categorises the relationships between the attributes of complex systems as cause and effect groups. It then facilitates the identification of the core problem in a complex system, and facilitates methods for improvement using the influence levels of quantified attributes.
Recently, DEMATEL has been widely applied to resolve numerous problems in various fields. Kim [21] integrated the principal component analysis, the analytic hierarchy process, and DEMATEL to evaluate the influence of information within the cattle and agricultural industries. Tzeng, Chiang, and Li [22] used DEMATEL to evaluate digital learning performances. Lin and Wu [23] applied fuzzy DEMATEL to resolve issues related to group decision-making. Lee et al. [24] used DEMATEL to verify the benefits of applying DEMATEL to the Technology Acceptance Model (TAM). Lee and Hsieh [25] used DEMATEL to analyse the causal relationships between service attributes, to adjust their importance, and to resolve core problems.
This study-referenced research on DEMATEL summarises and explains the framework and operation or calculation steps for DEMATEL.
1. Definitions of attribute characteristics and recommended measurement scales
Numerous tools and methods, such as brainstorming, the expert opinion method, and a literature review, are used to list and define various attributes that may influence the performance of complex systems. A measurement scale for the causal relationships and levels of influence between attributes is then established.
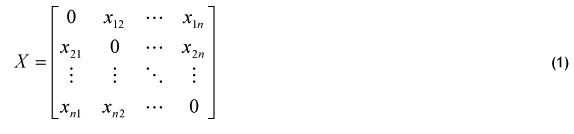
2. Establishing the direct-relation matrix (X)
Assuming that there are n attributes that influence a complex system, the n attributes can be extended as an n x n direct-relation matrix (X), based on mutual influence relationships and levels of influence, and using the expert opinion method. In X, Xij represents the level of influence that attribute i has on attribute j. The diagonal attribute Xii of X in the matrix is set as 0.
3. Calculating the normalised direct-relation matrix (N)
To calculate the normalised direct-relation matrix (N), Kim (2006), Lin and Wu (2008), Lee et al. (2010), and Lee and Hsieh (2011) used the maximum sum of the row vector as the normalisation baseline.
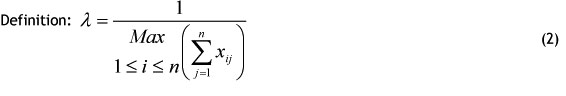
Subsequently, X was multiplied by λ, and N was acquired.

4. Calculating the direct-indirect matrix (T)
After obtaining the known i, the identity matrix (I) can be further used to acquire the direct-indirect matrix (T), also referred to as the total-relation matrix.

5. Calculating the influenced and influential levels for the factors
After obtaining T, we calculated the influence of a certain attribute on other attributes, as well as the degree to which this attribute was influenced by other attributes. We defined tij as the characteristics of the attributes in T, in which i,j = 1,2,...,n. Subsequently, we established Dj as the sum of row i, representing the sum of the attributes influenced by i. Rj represented the sum of column j, that is, the sum of the attributes that influenced attribute i. Acquired from T, Di and Rj both included direct and indirect influences.


6. Drawing a cause and effect diagram
We defined (Dk + Rk) as the prominence, and k = i = j = 1, 2,.., n, indicating the overall influenced and influential levels of a specific attribute (k). This value represented the core level of k in all the problems. (Dk -Rk) was defined as the relation, that is, the variance degree of the influenced and influential levels of k. This value indicated the causal level of k in all of the problems. If the value was positive, k was categorised as the cause. Conversely, if the value was negative, k was categorised as the effect. The causal matrix diagram employed (Dk+Rk) as the horizontal axis and (Dk -Rk) as the vertical axis. The causal matrix diagram was illustrated to simplify a complex causal relationship to a comprehensible visual structure. Based on the location of the attributes in the figure, decision-makers can determine a specific attribute's influenced and influential level, and whether it should be categorised as a cause or an effect. Appropriate decisions can therefore be formulated to resolve problems based on an attribute's category and level of influence.
3.2 Combining SIPA and DEMATEL
The SIPA method, which contains eight competitive situation dimensions, has been used to analyse concepts about the importance of competitive attributes, performance, and competitor performance simultaneously. To examine how corporations win orders, the attributes of neglected opportunity, competitive disadvantage, competitive advantage, and false advantage require further study. SIPA, however, includes a crucial assumption: when analysing the importance of individual attributes and corporate performance, individual attributes are considered mutually independent. That is, the attributes do not exhibit mutual influences because no causal relationships exist. Therefore, after employing SIPA for an analysis, the causal relationships between attributes should be determined. The 14 attributes of order-winners and qualifiers may exhibit causal relationships and mutual influences. The second stage therefore requires an additional DEMATEL analysis to identify the core attributes for corporations to obtain orders. Competitive strategies can then be proposed.
4 RESULTS AND DISCUSSION
This study used a copper-clad laminate (CCL) manufacturing corporation (referred to as Corporation A) in Taiwan as the case study. CCL is the core material used to manufacture printed circuit boards (PCBs). Corporation A is a globally-renowned CCL corporation: its productivity was ranked 10th in the world in 2012. Agents are located in the Americas, Europe, and Africa. The market share of Corporation A has been static recently, and its profitability is lower than its primary competitors. The administrative authorities and management of Corporation A had an urgent need to analyse current market competitive situations and to propose suitable strategies to win client orders. We therefore used Corporation A as the case corporation, and selected Corporations B, C, and D (in the same industry) as its competitors, to examine the order-winning competitiveness of the four corporations and to propose a competitive strategy for Corporation A.
4.1 Questionnaire design and distribution
The questionnaire items were based on the 14 order-winner and qualifier criteria, and used these as the attributes for analysis. The SIPA questionnaires were distributed in November and December 2012. We adopted a 9-point scale as the scoring method in the questionnaire (1 = extremely dissatisfied; 9 = extremely satisfied), and used closed-ended questions to investigate importance and performance. A total of 60 global PCB vendor corporations participated in the SIPA questionnaire, which was primarily distributed to senior staff members in the PCB industry. Thirty-six valid and 24 invalid questionnaires were retrieved. The valid recovery rate was 60 per cent.
The DEMATEL questionnaire was distributed in January 2013. In this study, a group of experts proposed opinions about the 14 order-winner and qualifier attributes for manufacturing corporations. We adopted an 11-point scale (10 = the most significant level of influence; 0 = no influence; ranks between 10 and 0 were scored sequentially according to the level of significance), and applied the expert survey method to the DEMATEL questionnaire. The participants were 14 high-level senior staff in the CCL and PCB industries. The authors visited all of the participants and explained the questionnaire contents before asking the participants to complete the questionnaire. Fourteen formal questionnaires were distributed, and all were retrieved, for a valid recovery rate of 100 per cent.
4.2 The research results of the SIPA questionnaire
In this study we used the mean of importance (7.07) calculated from the questionnaires as the criterion to determine the level of importance (high or low) for each attribute. We used the average performance of the four corporations to determine the performance of each competitive attribute (good or poor) in all four corporations.
To analyse the market competitive situations of Corporations A, B, C, and D, the competitors (Corporations B, C, and D) should be viewed as one. We therefore employed the market shares of Corporations A, B, C, and D in 2012 (3.2 per cent, 4.3 per cent, 7.1 per cent, and 6.0 per cent respectively) as the weight to calculate the competitors' weighted performance.
Using the SIPA method, market strategies were analysed and summarised based on the importance of attributes, the performance of Corporation A, and the weighted performance of its competitors, as shown in Table 1.


[Tabela 3]
The results of the SIPA indicate that, compared with its competitors, Corporation A exhibited competitive advantages in attributes Q7 and Q9. These are strengths of Corporation A; they should therefore be maintained to win more orders. Corporation A exhibited competitive disadvantages in attributes Q1, Q13, and Q14. Corporation A should therefore gather resources to increase the competitiveness of these three attributes to transform disadvantages and win orders. Corporation A exhibited false advantages in attributes Q6 and Q12. Clients perceived these attributes as having a low level of importance. For these attributes, Corporation A performed in a manner superior to its competitors; however, it was unable to obtain more orders. Corporation A should therefore consider transferring corporate resources away from these false advantages and toward other competitive attributes. Corporation A exhibited a neglected opportunity for attribute Q4. Corporation A and its competitors have neglected this potential opportunity; resources should thus be invested in this area to surpass competitors and win orders.
4.3 DEMATEL results
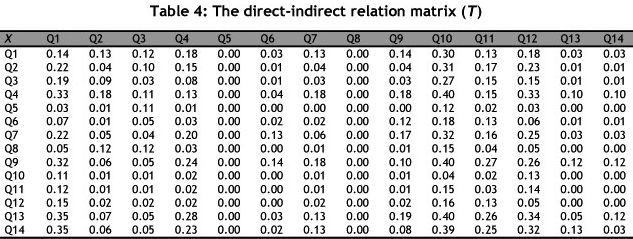
We used the DEMATEL method to analyse the correlation and level of influence between the 14 attributes using data acquired from an expert opinion questionnaire. Table 4 shows the expert opinion investigation results of DEMATEL and the survey results regarding the 14 attributes. The table comprises 196 grids. After deducting the 14 diagonal attributes that had influence levels of 0, there were 182 mutual influence levels. We averaged the scores from the 14 experts and rounded them to obtain integer values. Based on the expert survey results, a direct-relation matrix X can be established, as shown in Table 2.
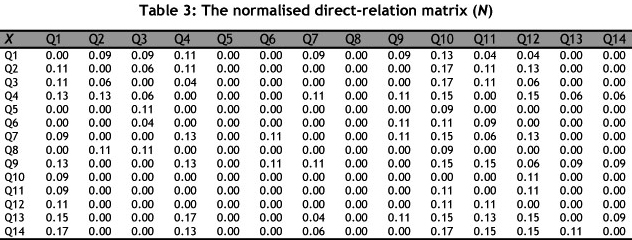
This study used the maximum sum of the row vector as the normalisation baseline to calculate the normalised direct-relation matrix N. For example, for Q1 in Formula (2), the row sum was 0+4+4+...2+0+0=31. Using the same process and reasoning, the sum influences of each row were 32, 26, 45, 9, 16, 36, 14, 47, 9, 14, 15, 46, and 44. We named the inversion of the maximum value of all row sums (47) as λ, and multiplied X by λ in Formula (3). Consequently we obtained N, and rounded the influence coefficient to two decimal places, as shown in Table 3.
The direct-indirect relation matrix (T) can be acquired using Formula (4). We rounded the influence coefficient of T to two decimal places, as shown in Table 4.
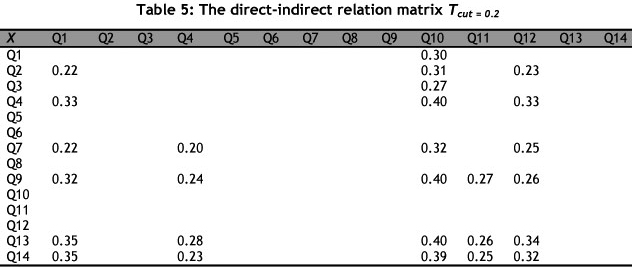
The correlations between attributes are complex. Furthermore, according to Tzeng, Chiang, and Li (2007), Lee et al. (2010), and Lee and Hsieh (2011), by investigating the results of the calculations of each case study and consulting the original expert questionnaire participants, attributes that exhibit a causal relationship with a level of influence lower than a specific value can be perceived as possessing no causal relationships, simplifying the analysis. This study defined attributes with a causal relationship less than 0.20 as exhibiting no causal relationship. We therefore retained 27 values and obtained the direct-indirect relation matrix Tcut=0.2, as shown in Table 5.
The Di of all the rows and Rj of all the columns can be calculated according to Formulas (5) and (6), and the prominence (Di+Rj) and relation (D1-Rj) obtained are shown in Table 6. The prominence and relation of the 14 attributes can also be used as axes, as shown in Figure 1.


Based on the analysis results shown in Table 6 and Figure 1, the causal relationships and levels of mutual influence between the 14 order-winner and qualifier attributes are explained below.
A. High relation and prominence: Q4, Q7, Q9, Q13, and Q14. These five attributes are categorised as causes, and are core items that influence other attributes. They represent the driving factors for resolving problems.
B. High relation and low prominence: Q2, Q3, Q5, Q6, and Q8. These five attributes have minimal influence on only a few other attributes, and they exhibit relative independence.
C. Low relation and high prominence: Q1, Q10, and Q12. These three attributes are categorised as effects, and are core items that are influenced by other attributes. This indicates that they require improvement. However, these attributes cannot be directly improved because they are categorised as effects.
D. Low relation and low prominence: Q11. This attribute is influenced by other attributes. The levels of influence are minimal, however, indicating that this attribute exhibits relative independence.
4.4 Discussion of SIPA integrated with DEMATEL
The analysis results of the SIPA indicate that, compared with its competitors, Corporation A exhibits competitive advantages in attributes Q7 and Q9. These are Corporation A's strengths, and should be maintained. Combining DEMATEL for an analysis showed that Corporation A's Q7 and Q9 attributes are located in a high relation and prominence area. Therefore they are causes. These two attributes should be maintained to obtain orders continuously while increasing the competitiveness of other attributes. We referenced the practical situation of Corporation A, and found that it had recently invested substantial money and resources to achieve an international level of research and development (R&D), employ engineering staff, and purchase R&D equipment. According to the current operations of Corporation A, these investments have resulted in excellent order winning results.
According to the analysis results of the SIPA, Corporation A exhibited competitive disadvantages in attributes Q13 and Q14. Corporation A must concentrate its resources to increase the competitiveness of these three attributes. Integrating DEMATEL to perform analyses showed that Corporation A's Q13 and Q14 attributes are located in a high relation and prominence area, indicating that they are causes. Furthermore, these attributes are core items that influence other attributes and represent driving factors for resolving problems. The DEMATEL analysis results corresponded to those of the SIPA. Therefore Corporation A should immediately begin to focus corporate resources on resolving technical liaison and support- and after-sales service-related issues. Otherwise, Corporation A's longterm competitiveness will be irreversibly surpassed by its competitors. Referencing Corporation A's industry position, the CCL industry is an electronic materials industry that supports numerous technical staff members, client services, and resources for PCB corporations to ensure that their materials are used in PCB products during the design stage. Therefore these materials can easily be adopted in future large-scale orders from clients. Based on the analysis results, Corporation A significantly lacks resource investments in technical and client services, and is inferior to its competitors in these areas. Neglecting the influence of these attributes to win orders results in Corporation A's orders and profits being inferior to those of its competitors in the long-term.
According to the analysis results of the SIPA, Corporation A is superior to its competitors in attributes Q6 and Q12. However, these attributes are Corporation A's false advantages. Despite its superior performance, these attributes are not important to its customers. Corporation A has invested too many resources in these attributes, and yet has not received increased orders. Therefore resources should be transferred to other attributes. Based on the analysis that integrated DEMATEL, attribute Q6 was located in a high relation and low prominence area - it only influenced a few attributes minimally. Attribute Q12 was located in a low relation and high prominence area, indicating that it is categorised as an effect and cannot be directly improved. Referencing Corporation A's practical situation, it has more than doubled its product categories in recent years, resulting in substantially increased inventory costs and expenditures on professional magazine advertisements and product exhibitions. However, these resource investments have not exhibited significant effects.
According to the analysis results of the SIPA, Corporation A and its competitors have missed potential opportunities for attribute Q4. Corporations should recognise opportunities and invest resources to outperform their competitors. Based on the analysis that integrated DEMATEL, Q4 is located in a high relation and prominence area that indicates that it is categorised as a cause and is a driving factor for resolving problems. Corporation A should therefore take advantage of this opportunity that is neglected by its competitors, and improve its performance in this area, using this attribute to form a competitive advantage in the future.
5 CONCLUSION
Corporations must continually create profits. The effective allocation of limited resources is essential to increasing competitiveness and winning orders. This study adopted the 14 order-winner and qualifier criteria as attributes for evaluation to understand further the competitive market situations of the case-study corporation and its competitors.
The SIPA method can simultaneously analyse concepts to do with the importance of competitive attributes, performance, and competitor performance in a simple manner. However, traditional SIPA assumes that, when analysing the importance of individual attributes and corporate performance, individual attributes are mutually independent. Under this assumption, the priorities for attribute enhancement cannot be analysed if the evaluated attributes exhibit causal relationships, thereby resulting in incorrect decisions or resource waste. Additional methods must be used to elucidate the causal relationships and levels of influence between attributes. We therefore included the DEMATEL method in this study.
This study proposed an integrated SIPA and DEMATEL model to analyse how manufacturing corporations obtain orders. We adopted 14 order-winner and qualifier attributes. In the first stage, the SIPA was used to analyse competitive market situations between the casestudy corporation and its competitors. In the second stage, DEMATEL was used to analyse the attributes' causal relationships and levels of influence. Finally, the SIPA and DEMATEL were integrated to re-formulate competitive strategies for winning orders.
The findings of this study and those of the post hoc verification of the case-study corporation industry experience were similar. In addition to serving as a novel theory-based method to examine how manufacturers win orders, the proposals in this study can be applied to practical industry experiences.
ACKNOWLEDGEMENT
The authors would like to thank the National Science Council of Taiwan for supporting this research financially (Grant number NSC 9-2632-H-216-001-MY2).
REFERENCES
[1] Hayes, R.H. & Wheelwright, S.C. 1979. Link manufacturing process and product life cycles, Harvard Business Review, 57(1), pp 133-140. [ Links ]
[2] Porter, M.E. 1980. Competitive strategy: Techniques for analyzing industries and competitions. New York: The Free Press. [ Links ]
[3] Kim, J.S. & Arnold, P. 1993. Manufacturing competence and business performance: A framework and empirical analysis. International Journal of Operations and Production Management, 13(10), pp 4-22. [ Links ]
[4] Baines, T.S., Lightfoot, H.W. & Kay, J.M. 2009. Servitized manufacture: Practical challenges of delivering integrated products and services. Proceedings of the Institution of Mechanical Engineers, Part B: Journal of Engineering Manufacture, 223(9), pp 1207-1215. [ Links ]
[5] Ho, J.W. & Huang, Y.S. 2010. Cost allocation with learning and forgetting considerations in a monopolistically competitive market. International Journal of Systems Science, 41(10), pp 1133-1144. [ Links ]
[6] Linda, C.H. 2010. Product customisation: An empirical study of competitive advantage and repeat business. International Journal of Production Research, 48(13), pp 3845-3865. [ Links ]
[7] Naeme, Z. & Mehdi, S. 2011. A competitive location model to obtain a specific market share while ranking facilities by shorter travel time. The International Journal of Advanced Manufacturing Technology, 55(5-8), pp 807-816. [ Links ]
[8] Coster, R.D. & Bateman, R.J. 2012. Sustainable product development strategies: Business planning and performance implications. Proceedings of the Institution of Mechanical Engineers, Part B: Journal of Engineering Manufacture, 226(10), pp 1665-1674. [ Links ]
[9] Kruger, L.P. 2012. Developing operations strategies - reassessing the strength and importance of competitive operations priorities for South African businesses. South African Journal of Business Management, 43(3), pp 13-28. [ Links ]
[10] Nie, X.B. & Cao, J.D. 2012. Existence and global stability of equilibrium point for delayed competitive neural networks with discontinuous activation functions. International Journal of Systems Science, 43(3), pp 459-474. [ Links ]
[11] Yeh, C.C. & Chen, C.F. 2012. An empirical study of buyer-supplier relationships in the Taiwanese machine tool industry. South African Journal of Business Management, 43(1), pp 69-75. [ Links ]
[12] Claasen, S.J. 2011. 50 years in industrial engineering. South African Journal of Industrial Engineering, 22(2), pp 4-6. [ Links ]
[13] Hill, T. 1993. Manufacturing strategy: The strategic management of the manufacturing function. 2nd edition. Basingstoke: Macmillan. [ Links ]
[14] Hill, T. 2000. Manufacturing strategy: Text and cases. 3rd edition. Basingstoke: McGraw-Hill. [ Links ]
[15] Burns, A.C. 1986. Generating marketing strategy priorities based on relative competitive position. The Journal of Consumer Marketing, 3(4), pp 49-56. [ Links ]
[16] Dolinsky, A.L. 1991. Considering the competition in strategy development: An extension of importance-performance analysis. Journal of Health Care Marketing, 11, pp 31-37. [ Links ]
[17] Yavas, U. & Shemwell, D. 1997. Analyzing a bank's competitive position and appropriate strategy. Journal of Retailing Banking Services, 19(4), pp 43-51. [ Links ]
[18] Matzler, K., Bailom, F., Hinterhuber, H.H., Renzl, B. & Pichler, J. 2004. The asymmetric relationship between attribute-level performance and overall customer satisfaction: A reconsideration of the important-performance analysis. Industry Marketing Management, 33(4), pp 271-277. [ Links ]
[19] Bei, L.T. & Shang, C.F. 2006. Building marketing strategies for state-owned enterprises against private ones based on the perspectives of consumer satisfaction and service quality. Journal of Retailing and Consumer Service, 13, pp 1-13. [ Links ]
[20] Gabus, A. & Fontela, E. 1973. Perceptions of the world problematique: Communication procedure, communicating with those bearing collective responsibility, DEMATEL report No. 1. Geneva, Switzerland: Battelle Geneva Research Center. [ Links ]
[21] Kim, Y.H. 2006. Study on impact mechanism for beef cattle farming and importance of evaluating agricultural information in Korea using DEMATEL, PCA and AHP. Agricultural Information Research, 15(3), pp 267-280. [ Links ]
[22] Tzeng, G.H., Chiang, C.H. & Li, C.W. 2007. Evaluating intertwined effects in e-learning programs: A novel hybrid MCDM model based on factor analysis and DEMATEL. Expert Systems with Applications, 32, pp 1028-1044. [ Links ]
[23] Lin, C.J. & Wu, W.W. 2008. A causal analytical method for group decision making under fuzzy environment. Expert System with Applications, 34(1), pp 205-213. [ Links ]
[24] Lee, Y.C., Li, M.L., Yen, T.M. & Huang, T.H. 2010. Analysis of adopting an integrated decision making trial and evaluation laboratory on a technology acceptance model. Expert Systems with Applications, 37, pp 1745-1754. [ Links ]
[25] Lee, Y.C. & Hsieh, Y.F. 2011. Modifying IPA with DEMATEL composite importance. Paper presented at the meeting of 2011 International Conference on Fuzzy Systems and Neural Computing, Hong Kong, China. [ Links ]
1 The author was enrolled for a PhD in the Business School of Nankai University and for a PhD in the Department of Technology Management, Chung-Hua University.
*Corresponding author

