


Servicios Personalizados
Articulo
 Inglés (pdf)
 Articulo en XML
 Referencias del artículo
Indicadores

Links relacionados
-
 Citado por Google
 -
 Similares en Google
Compartir

 Permalink
South African Journal of Industrial Engineering
versión On-line ISSN 2224-7890
versión impresa ISSN 1012-277X
S. Afr. J. Ind. Eng. vol.24 no.3 Pretoria nov. 2013
GENERAL ARTICLES
The effects of parameter estimation on minimising the in-control average sample size for the double sampling x̅ chart
Michael B.C. KhooI, *; M.H. LeeII; W.L. TeohIII; J.Y. LiewIV; S.Y. TehV
ISchool of Mathematical Sciences. Universiti Sains Malaysia, Penang, Malaysia. mkbc@usm.my,
IISchool of Engineering, Computing and Science. Swinburne University of Technology, Sarawak, Malaysia. mhlee@swinburne.edu.my
IIIDepartment of Physical and Mathematical Science. Faculty of Science, Universiti Tunku Abdul Rahman. Jalan Universiti, Bandar Barat, Malaysia. teohwl@utar.edu.my
IVSchool of Mathematical Sciences. Universiti Sains Malaysia, Penang, Malaysia.youngliew82@yahoo.com.sg
VSchool of Management. Universiti Sains Malaysia, Penang, Malaysia. tehsyin@usm.my
ABSTRACT
The double sampling (DS)  chart, one of the most widely-used charting methods, is superior for detecting small and moderate shifts in the process mean. In a right skewed run length distribution, the median run length (MRL) provides a more credible representation of the central tendency than the average run length (ARL), as the mean is greater than the median. In this paper, therefore, MRL is used as the performance criterion instead of the traditional ARL. Generally, the performance of the DS chart is investigated under the assumption of known process parameters. In practice, these parameters are usually estimated from an in-control reference Phase-I dataset. Since the performance of the DS chart is significantly affected by estimation errors, we study the effects of parameter estimation on the MRL-based DS chart when the in-control average sample size is minimised. This study reveals that more than 80 samples are required for the MRL-based DS chart with estimated parameters to perform more favourably than the corresponding chart with known parameters.
OPSOMMING
Die dubbelmonster -beheerkaart, wat grootskaals gebruik word, is voortreflik vir die opsporing van geringe en middelmatige verskuiwings van prosesmediaan. By 'n regsskuinse verdeling van looplengte lewer de mediaanlooplengte (MLL) 'n beter groottewaarde as die gemiddelde looplengte. Gewoonlik word die vertoning van die bogenoemde -beheerkaart bepaal met geskatte prosesparameters. Die skattings word bepaall op die veronderstelling dat die proses onder beheer is. Aangesien die MLL gebaseerde beheerkaartvertoning betekenisvol beïnvloed word deur skattingsfoute, word dit ondersoek uit minimum gemiddelde monstergrootte. Die uiteindelike resultaat van die navorsing toon dat 80 monsters benodig word vir 'n beter vertoning as die ooreenstemmende beheerkaart vir bekende parameters.
1 INTRODUCTION
Quality is one of the most important decision-making factors for consumers when selecting competing products and services. This is so, whether the consumer is an individual, a retail store, an industrial organisation, or a nation. Statistical process control (SPC) comprises problem-solving approaches that help to achieve quality improvement and minimise production costs. A control chart plays an important role in SPC. It is a simple yet very powerful tool in SPC, enabling a study of the stability of a manufacturing process. Due to its operational simplicity, there has been a significant growth in the use of the Shewhart chart to monitor processes and improve quality in manufacturing and service industries. The Shewhart chart is used to detect large process mean shifts in such industries. However, it lacks the sensitivity to detect small and moderate process mean shifts.
Daudin [1] introduced the DS chart to overcome the drawback of the Shewhart chart in small and moderate process mean shifts. It is a two-stage Shewhart chart that incorporates the idea of the double sampling plan. The DS chart, optimally designed based on the in-control average sample size (ASS0), was provided by Daudin [1]. Inspired by Daudin [1], Irianto & Shinozaki [2] developed an optimisation model to minimise the out-of-control average run length (ARL1). Daudin [1] and Costa [3] revealed that, in some cases, the DS chart outperforms the Shewhart , EWMA, CUSUM, variable sampling interval (VSI), and variable sample size (VSS) charts. The DS type control charts therefore continue to attract ongoing research.
Concerning the DS type control charts, Torng & Lee [4] and Torng et al. [5] studied the DS and DSVSI (combined DS and VSI) charts under non-normality. Using a genetic algorithm, Torng et al. [6,7] developed economic design models of the DS chart for both independent and correlated data. The economic design of the DSVSI chart was discussed by Lee et al. [8], because this chart is effective in detecting small and moderate mean shifts. Using the Markov chain approach, Costa & Machado [9] compared the performances of the variable parameters (VP) and DS charts, in the presence of correlation. The synthetic DS chart suggested by Khoo et al. [10] significantly improves the detection speed, compared with the synthetic , DS , and EWMA charts - although the detection of small shifts is better accomplished with the EWMA chart. The most recent literature on the DS S type charts was studied by Lee et al. [11,12]. Lee et al. [11] found that the DS S chart performs extraordinarily well in detecting the shifts in the process standard deviation and in reducing the sample size of the destructive testing process. Meanwhile, the DSVSI S chart was proposed by Lee et al. [12] to improve efficiency in detecting small standard deviation shifts.
Recently a great deal of research interest has arisen in the area of control charts with estimated parameters. Focusing on the recent works of the type charts with estimated parameters, Zhang et al. [13] and Khoo et al. [14] evaluated the performances of both the synthetic and the DS charts with estimated parameters. They found that there are large differences in the run length properties of the synthetic and DS charts between the cases of the known parameters and estimated parameters. Capizzi & Masarotto [15] discussed the effect of parameter estimation on the performance of the combined Shewhart-EWMA (CSEWMA) chart. For attribute control charts, Testik et al. [16] and Testik [17] investigated the impact of the estimated process mean on the performances of the Poisson EWMA and the Poisson CUSUM charts. All this literature shows that estimation errors affect the in-control cases much more than they do the out-of-control cases. A thorough literature review on the impact of parameter estimation for the properties of the different types of control charts can be found in Jensen et al. [18]. Since the performance of control charts deteriorates significantly because of estimation errors, Jensen et al. [18] pointed out that the effects of parameter estimation need to be investigated for other types of control charts, such as the DS chart.
When the process parameters are estimated, multiple performance measures should be included to evaluate the control chart's properties effectively [18]. For control charts with estimated parameters, the existing literature has put too much emphasis on average run length (ARL) and not enough on the median run length (MRL). Criticisms have arisen following the use of the ARL as the sole representative of the run length (see Gan [19], Bischak & Trietsch [20], and Chakraborti [21]). This is because interpretation based on the ARL alone could be complicated yet deceptive, as the shape of the run length distribution changes with the magnitude of the mean shift and the number of Phase-I samples. In the light of this drawback, the MRL is suggested as a supplementary performance measure in this paper; interpretation based on MRL is more readily understood. For example, an in-control MRL (MRL0) of 250 means that 50 per cent of the time a false alarm will occur by the 250th sample. Since a more reliable interpretation in assessing a chart's performance could be attained by using the MRL, Golosnoy & Schmid [22], Maravelakis et al. [23], and Khoo et al. [24], to mention a few, have all devoted themselves to the development of MRL-based control charts.
As mentioned before, Daudin [1] and Khoo et al. [14] suggested a procedure to minimise the ASS0 for the ARL-based DS chart with both known and estimated parameters. To complement the works of Daudin [1] and Khoo et al. [14], this paper studies the effects of parameter estimation on minimising the ASS0 for the MRL-based DS chart. We therefore investigate the MRL and average sample size (ASS) performance of the DS chart when the optimal parameters that were intended for the known parameters case are used for the estimated parameters case.
The organisation of this paper is as follows: Section 2 reviews the charting procedure of the DS chart with known and estimated parameters; Section 3 studies the effects of parameter estimation on the MRL-based DS chart, for minimising the ASS0; and finally, conclusions are drawn in Section 4.
2 THE DS CHART
The DS chart has the favourable properties of the Shewhart chart. Daudin [1] proposed it to detect small and moderate process mean shifts effectively. The ability of the DS chart to minimise the average sample size used in process monitoring has made the chart an appealing method for quality practitioners. In this section, we briefly explain the design procedure of the DS chart defined by Daudin [1].
Assume that the observations of the quality characteristic being monitored are independently and identically distributed (iid) normal random variables, with a known in-control mean µ0 and a known in-control standard deviation σ0. The warning limits of the first-sample stage are expressed as ±L1 while ±L denotes the control limits of the first-sample stage. The control limits of the combined-sample stage are given by ±L2. Figure 1 gives a graphic view of the DS chart.

As shown in Figure 1, the DS chart is partitioned into a few intervals that are denoted by /1 = [-L1, L1], I2 = [-L, -L1) ᴗ (L1, L], I3 = (-∞, - L) ᴗ (L, + ∞), and I4 = [-L2, L1 ]. Based on Figure 1, the DS chart is implemented as follows [1]:
a. Calculate the sample mean  after a first sample of size n1 is taken.
Here, X1i,j with j = 1, 2, ..., n1 represents the jth observation at the ith sampling time of the first sample.
b. The process is in-control at the first sample if 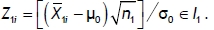
c. The process is out-of-control at the first sample if Z1i Є /3.
d. Select a second sample with size n2 if Z1j Є /2. Then calculate the sample mean  where X2i,j with j = 1, 2, ..., n2 refers to the jth observation at the ith sampling time of the second sample.
e. The combined sample mean at the ith sampling time i = (n11i + n22i)/ (n1+ n2) is calculated.
f. The process is in-control at the second sample if  Otherwise the process is declared to be out-of-control.
It must be emphasised that at the ith sampling time, two possible situations could occur. The first situation occurs when only the first sample of size n1 needs to be obtained. The second situation takes place when the combined samples of size n1 + n2 must be taken.
For the DS chart with known parameters, let Pak denote the probability that the process remains in-control at sampling stage k with k Є {1, 2}. Then the probability that the process is in-control is Pa = Pa1 + Pa2, where [1]
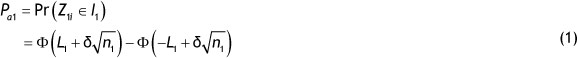
and
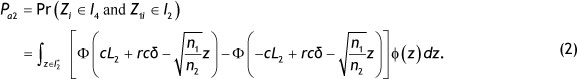
Here, Φ(.) represents the cumulative distribution function (cdf) of the standard normal random variable, while the probability density function (pdf) of the standard normal random variable is expressed as Φ(.). Also, δ = |µ1-µ0|/σ0 refers to the magnitude of the standardised mean shift having an out-of-control mean  , and
, and  .
.
According to Montgomery [25], the run length (RL) distribution of the Shewhart Ẍ chart is geometric. Note that the RL is defined as the number of sample points plotted on a control chart before the chart issues the first out-of-control signal. Since the DS Ẍ chart is a Shewhart type chart, its RL follows the geometric distribution. The cdf of the RL is

with ℓ Є {1, 2, 3, ...}. The MRL of the DS chart can be computed as follows [19]:

The ASS at each sampling time is expressed as [1]

where

In real-world applications µ0 and σ0 are usually unknowns. They are both estimated from an in-control Phase-I dataset, comprising i = 1, 2, ..., m samples, each having n observations. The estimator µ^0 of µ0 is equal to

and the estimator σ0 of σ0 is

where  is the ith sample mean.
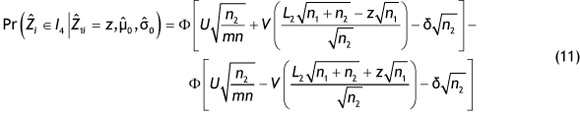
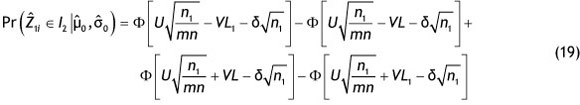
Khoo et al. [14] recently proposed the ARL-based DS chart with estimated parameters. When parameters are estimated, the conditional probability Ṕa = Ṕa1+ Ṕa2 is the probability that the process is declared to be in-control, where [14]
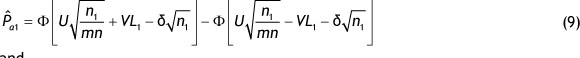
and

where
and

The random variables U and V in Equations (9), (11), and (12) are defined as

And

respectively.
The cdf of RL for the known parameters case can be obtained from Equation (3). However, for the estimated parameters case, the RL distribution no longer follows a geometric distribution [18]. Therefore the cdf of RL for the DS chart with estimated parameters can be calculated as

where ℓЄ {1, 2, 3, ...}. Here, the pdf of U and V, i.e fU (u) and fV (v) are [14]

and

respectively, where fγ (.|k,l) is the pdf of the gamma distribution with parameters k and l. Then the MRL of the DS chart with estimated parameters can be computed using Equations (4) and (15).
For the DS chart with estimated parameters, Khoo et al. [14] showed that the ASS can be obtained as

where
3 EFFECTS OF PARAMETER ESTIMATION ON MINIMISING ASS0
In this article, we investigate the MRL-based DS chart's performance for minimising the ASS0 when process parameters are estimated. In other words, we use the optimal parameters (n1, n2, L1, L, L2) to minimise ASS0, computed for the known parameters case, to compute the MRL0, MRL1, ASS0 and ASS1 of the chart with estimated parameters, in order to study the chart's performance based on parameter estimation. Here, the subscripts '0' and '1' for MRL and ASS refer to the in-control and out-of-control cases respectively. The optimal parameters (n1, n2, L1, L, L2) for the known parameters case are computed employing a nonlinear optimisation algorithm using the Matlab program. The optimisation minimises ASS0, subject to MRL0 = τ, MRL1 = ε and 1 < n1, < nẍ< n1+ n2 < nmax, where n1 < n2. Note that τ and ε are the desired MRL0 and MRL1 respectively, nmax is the upper bound of n1 + n2, and nẍ denotes the sample size of the MRL-based Shewhart chart with known parameters.
When process parameters are known, the DS chart is designed so that its MRL0 and MRL1 (for δ = 0.5, 0.75, 1, 1.25, 1.5, 1.75, 2, 2.5) match that of the optimal EWMA chart with a sample size nEWMA , where nEWMA Є{1, 3} is considered. At the same time, the DS chart is also designed to match the MRL0 and an appropriate MRL1 of the Shewhart chart (having ±2.92362 standard deviation width), where a suitable nẍ is chosen so that the Shewhart chart's MRL1 is as close as possible to that of the EWMA chart, for the same shift δ .
Due to cost constraints, it has become the norm in industries not to use large sample sizes in process monitoring; either small or moderate sample sizes are preferred. Consequently, we fix nmax as 15 in this work.
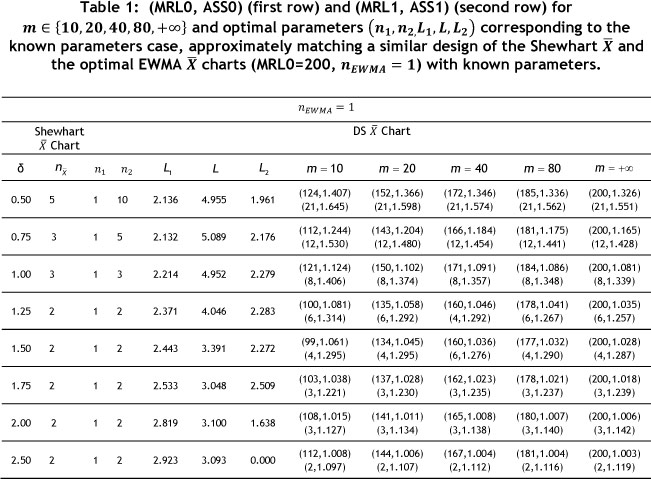
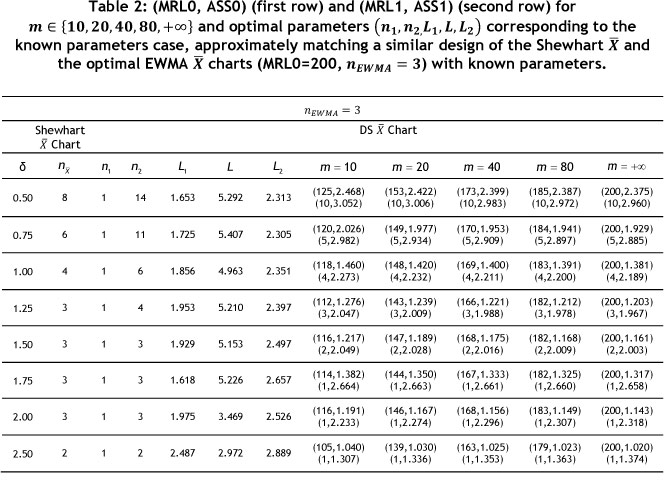
Tables 1 and 2 show the MRL0, ASS0, MRL1 and ASS1 values of the DS chart for various combinations of m, nẌ (equivalent to the Phase-I sample size, n), and δ with the optimal parameters (n1,n2,L1,L,L2) corresponding to the known parameters (m = +∞) case; and nearly matching the same design as the Shewhart chart and the optimal EWMA chart with known parameters. The first and second rows of each cell, for mЄ{10, 20, 40, 80, +∞}, give the (MRL0, ASS0) and (MRL1, ASS1) values, where m is the number of Phase-I samples.
The accuracy of the results in Tables 1 and 2, computed from the optimisation method using Matlab, has been verified with simulation. It is worth pointing out that in this study, MRL0 = τ = 200 and MRL1 = ε are attained for every δ with known parameters (m = +∞).
The desired ε value is designated as the MRL1 value of the optimal MRL-based EWMA chart with known parameters for a particular δ , where the MRL0 value of this EWMA chart is fixed as 200 and nEWMA ={1, 3}. For details about the optimisation procedure of the MRL-based EWMA chart with known parameters, see Gan [19]. We use the parameters (n1, n2, L1,L, L2), given in columns three to seven of Tables 1 and 2, to compute the MRL and ASS values displayed in columns eight to eleven, for the estimated parameters case. Equations (4) and (15) are used to calculate the MRL values of the chart with estimated parameters, whereas Equation (18) is used to compute the ASS value. For example, if ö = 0.75 and nẌ = 6, the optimal parameters (n1, n2, L1, L, L2) (1, 11, 1.725, 5.407, 2.305) for the known parameters case can be obtained from Table 2. With these optimal parameters, (MRL0, ASS0) = (149, 1.977) and (MRL1, ASS1) = (5, 2.934), m = 20 can be computed from the equations given in Section 2.
An examination of the results in Tables 1 and 2 reveals that, for a fixed value of δ and nẌ (= n), the MRL0 value increases and approaches that of the known parameters (m = +∞) case when m increases. The MRL0 value is smaller than the desired value of 200, for m є { 10, 20, 40, 80}. This indicates that more frequent false alarms will occur when estimates are used in place of known parameters.
As for the ASS values, it is seen from Tables 1 and 2 that there is no obvious difference between the various values of ASS0 (and ASS1) for a fixed δ and nẌ(= n) as m changes, even though both ASS0 and ASS1 slowly approach the corresponding values for the known parameters case (m = +∞), as m increases. Furthermore, it is interesting to highlight that all of the ASS1 values needed to detect process changes are larger than the corresponding ASS0 values. This is because the optimisation design minimises ASS0 and not ASS1.
To illustrate how Tables 1 and 2 assist practitioners to carry out sampling, consider the following example: from these tables, it is obvious that more than 80 Phase-I samples are required to minimise the effects of parameter estimation on the MRL-based DS chart. When δ = 1.00 and nẌ = 4 are considered, in the Phase-I analysis a practitioner needs to collect 80 (m = 80) Phase-I samples, each having 4 ( n = nẌ = 4) observations to estimate µ0 and σ0. Then in Phase-II process monitoring, Table 2 suggests the use of parameters (n1, n2, L1, L, L2) = (1, 6, 1.856, 4.963, 2.351) to design the DS chart with estimated parameters. This chart will give (MRL0, ASS0) = (183, 1.391) and (MRL1, ASS1) = (4, 2.200).
4 CONCLUSIONS
Since an in-depth knowledge and a good understanding of the control charts used are vital to quality practitioners, the MRL and ASS are selected as alternative measures to evaluate the performance of the DS chart with estimated parameters. In this paper, we found that adopting estimates instead of known parameters significantly decreases the MRL0 values, especially when the number of in-control samples m and sample size n, used in the Phase-I process, are small. This suggests a higher false alarm rate for the chart with estimated parameters. It is undesirable to have excessive false alarms: unnecessary interruptions in the process will occur, and time will be wasted searching for nonexistent assignable causes. The effects of parameter estimation on the DS chart should therefore not be ignored. There are also some deviations in the ASS values when parameters are estimated, compared with when they are known.
From the results, it is clear that m > 80 Phase-I samples are required for the DS chart with estimated parameters to perform satisfactorily, compared with the chart with known parameters. With this recommended number of Phase-I samples, m can only be implemented for a process with a high production volume. When only a small amount of Phase-I data is available, the optimal parameters that are specially computed for the chart with known parameters are unsuitable for use in the chart with estimated parameters. Therefore the optimal design of the MRL-based DS chart with estimated parameters for minimising ASS0 is a crucial research topic to be pursued. These research findings will be presented in a future paper.
It is obvious from this paper that the performance of the DS chart is adversely affected by parameter estimation. To address this, an extension of this study would be to investigate the impact of parameter estimation on various types of DS charts, such as the triple sampling (TS) , the DS variable sampling interval, and synthetic DS charts. This is because these control charts offer better statistical efficiency than the DS chart.
It would therefore be worthwhile to develop new methods of parameter estimation for these control charts in the future.
ACKNOWLEDGEMENTS
This research is supported by the Universiti Sains Malaysia (USM) Fundamental Research Grant Scheme (FRGS) no. 203/PMATHS/6711232, and the Swinburne University of Technology Sarawak Campus (SUTS) Research Incentives Scheme no. 2-5259.
REFERENCES
[1] Daudin, J.J. 1992. Double sampling X charts, Journal of Quality Technology, 24, pp. 78-87. [ Links ]
[2] Irianto, D. & Shinozaki, N. 1998. An optimal double sampling X control chart, International Journal of Industrial Engineering - Theory, Applications and Practice, 5, pp. 226-234. [ Links ]
[3] Costa, A.F.B. 1994. X charts with variable sample size, Journal of Quality Technology, 26, pp. 155-163. [ Links ]
[4] Torng, C.C. & Lee, P.H. 2009. The performance of double sampling X control charts under non-normality, Communications in Statistics - Simulation and Computation, 38, pp. 541 -557. [ Links ]
[5] Torng, C.C., Tseng, C.C. & Lee, P.H. 2010. Non-normality and combined double sampling and variable sampling interval X control charts, Journal of Applied Statistics, 37, pp. 955-967. [ Links ]
[6] Torng, C.C., Lee, P.H. & Liao, N.Y. 2009. An economic-statistical design of double sampling X control chart, International Journal of Production Economics, 120, pp. 495-500. [ Links ]
[7] Torng, C.C., Lee, P.H., Liao, H.S. & Liao, N.Y. 2009. An economic design of double sampling X charts for correlated data using genetic algorithms, Expert Systems with Applications, 36, pp. 12621-12626. [ Links ]
[8] Lee, P.H., Torng, C.C. & Liao, L.F. 2012. An economic design of combined double sampling and variable sampling interval Xcontrol chart, /International Journal of Production Economics, 138, pp. 102-106. [ Links ]
[9] Costa, A.F.B. & Machado, M.A.G. 2011. Variable parameter and double sampling X charts in the presence of correlation: The Markov chain approach, /nternational Journal of Production Economics, 130, pp. 224-229. [ Links ]
[10] Khoo, M.B.C., Lee, H.C., Wu, Z., Chen, C.H. & Castagliola, P. 2011. A synthetic double sampling control chart for the process mean, IIE Transactions, 43, pp. 23-38. [ Links ]
[11] Lee, P.H., Torng, C.C., Wu, J.C. & Tseng, C.C. 2010. The effectiveness study of double sampling S charts application on destructive testing process, International Journal of Product Development, 12, pp. 324-335. [ Links ]
[12] Lee, P.H., Chang, Y.C. & Torng, C.C. 2012. A design of S control charts with a combined double sampling and variable sampling interval scheme, Communications in Statistics -Theory and Methods, 41, pp. 153-165. [ Links ]
[13] Zhang, Y., Castagliola, P., Wu, Z. & Khoo, M.B.C. 2011. The synthetic Xchart with estimated parameters, IIE Transactions, 43, pp. 676-687. [ Links ]
[14] Khoo, M.B.C., Teoh, W.L., Castagliola, P. & Lee, M.H. 2013. Optimal designs of the double sampling X chart with estimated parameters, International Journal of Production Economics, 144, pp. 345-357. [ Links ]
[15] Capizzi, G. & Masarotto, G. 2010. Combined Shewhart-EWMA control charts with estimated parameters, Journal of Statistical Computation and Simulation, 80, pp. 793-807. [ Links ]
[16] Testik, M.C., McCullough, B.D. & Borror, C.M. 2006. The effect of estimated parameters on Poisson EWMA control charts, Quality Technology and Quantitative Management, 3, pp. 513-527. [ Links ]
[17] Testik, M.C. 2007. Conditional and marginal performance of the Poisson CUSUM control chart with parameter estimation, International Journal of Production Research, 23, pp. 5621-5638. [ Links ]
[18] Jensen, W.A., Jones-Farmer, L.A., Champ, C.W. & Woodall, W.H. 2006. Effects of parameter estimation on control chart properties: A literature review, Journal of Quality Technology, 38, pp. 349-364. [ Links ]
[19] Gan, F.F. 1992. Exact run length distributions for one-sided exponential CUSUM schemes, Statistica Sinica, 2, pp. 297-312. [ Links ]
[20] Bischak, D.P. & Trietsch, D. 2007. The rate of false signals in X control charts with estimated limits, Journal of Quality Technology, 39, pp. 54-65. [ Links ]
[21] Chakraborti, S. 2007. Run length distribution and percentiles: The Shewhart X chart with unknown parameters, Quality Engineering, 19, pp. 119-127. [ Links ]
[22] Golosnoy, V. & Schmid, W. 2007. EWMA control charts for monitoring optimal portfolio weights, Sequential Analysis, 26, pp. 195-224. [ Links ] Maravelakis, P.E., Panaretos, J. & Psarakis, S. 2005. An examination of the robustness to non normality of the EWMA control charts for the dispersion. Communications in Statistics-Simulation and Computation, Communications in Statistics - Simulation and Computation, 34, pp. 1069-1079. [ Links ]
[23] Khoo, M.B.C., Wong, V.H., Wu, Z. & Castagliola, P. 2012. Optimal design of the synthetic chart for the process mean based on median run length, IIE Transactions, 44, pp. 765-779. [ Links ]
[24] Montgomery, D.C. 2009. Statistical quality control: A modern introduction, 6th ed., John Wiley & Sons, New York. [ Links ]
* Corresponding author

