


Servicios Personalizados
Articulo
 Inglés (pdf)
 Articulo en XML
 Referencias del artículo
Indicadores

Links relacionados
-
 Citado por Google
 -
 Similares en Google
Compartir

 Permalink
South African Journal of Industrial Engineering
versión On-line ISSN 2224-7890
versión impresa ISSN 1012-277X
S. Afr. J. Ind. Eng. vol.24 no.2 Pretoria ene. 2013
CASE STUDIES
The effectiveness of lean manufacturing audits in measuring operational performance improvements
P. Taggart*; F. Kienhöfer
School of Mechanical, Industrial and Aeronautical Engineering University of the Witwatersrand, South Africa. patrick.taggart@gmail.com
ABSTRACT
The hypothesis that lean manufacturing audits are an effective way to measure improvements in operational performance was tested using 64 manufacturing sites owned by a FTSE 100 company. Commonly-used lean characteristics were evaluated: policy deployment, standardised work, visual management and housekeeping, quick changeover techniques, total productive maintenance, continuous improvement (kaizen), error proofing, cultural awareness, material control, and levelling (heijunka). Operational performance was assessed employing commonly-used operational performance measures: on-time-delivery, inventory turns, and direct labour utilisation. The findings are that lean manufacturing audits are effective in measuring improvements in operational performance provided that the audit scope and the lean characteristics are aligned up front.
OPSOMMING
Die hipotese dat die amptelike evaluering van stroombelynde produksie effektief gebruik kan word om verbetering in bedryfsdoeltreffendheid te meet, is getoets met die gebruik van 64 vervaardigingsaanlegte wat deur 'n FTSE 100 maatskappy besit word. Stroombelynde tegnieke wat algemeen gebruik word, is geëvalueer: strategiese beplanning, gestandaardiseerde werk, visuele bestuur en huishouding, vinnige oorgangstegnieke, totale gehalte-bestuur, kaizen, foutvoorkoming, kulturele bewustheid, materiaalbeheer, en konstante produksietempo's. Maatreëls wat algemeen gebruik word om bedryfsdoeltreffendheid te meet is gebruik om bedryfsdoeltreffendheid te assesseer: tydige aflewering, voorraadomsetsnelheid, en direkte arbeidsbenutting. Die bevinding is dat, om amptelike evaluering van stroombelynde produksie effektief te gebruik om verbetering in bedryfsdoeltref-fendheid te meet, moet die omvang van die amptelike evaluering en stroombelynde tegnieke vooraf belyn word.
1. INTRODUCTION
Lean manufacturing is a popular change initiative employed by small, medium, and large enterprises. Lean manufacturing principles are as applicable to the entire enterprise as they are to the shop floor [1].
The challenge facing organisations that wish to implement lean manufacturing is to demonstrate that the implementation of lean manufacturing is correlated with improvements in operational performance. Overcoming this challenge is critical, because the implementation of lean manufacturing requires significant investment in improving processes, and in training and developing capable people to support those processes. This investment costs money, and there is often a need within an organisation to show that implementing lean manufacturing will stimulate operational improvements. Furthermore, once lean manufacturing has been adopted, the organisation needs to show that the lean manufacturing approach is continuing to provide benefits: a continuous improvement mentality is integral to the lean manufacturing principle.
A practical approach to overcoming this challenge is to develop and implement a lean manufacturing audit that can measure and track the success of lean manufacturing to increase operational performance. A gap analysis identifies improvement opportunities that may lead to improved operational performance. The audit scores can then be used to correlate the lean characteristics with relevant operational performance measures.
When initiating lean manufacturing, it is important to consider which lean characteristics to implement. Later, when developing an audit to measure the success of this implementation, it is important to consider:
- Which lean characteristics to audit. These should be aligned with those chosen during the initiation phase. Subsequent audits that focus on continuous improvement may require changes to the appropriately audited lean characteristics.
- At what level to audit: the whole enterprise, manufacturing plants only, or the shop floor exclusively.
- How to conduct the audit: scoring system, question structure, scale, etc.
- How to assess and manage the audit process.
This paper examines the relationship between the lean manufacturing audit scores and operational performance measures, using 64 manufacturing sites owned by a FTSE 100 company. The name of the company in this paper is not disclosed to maintain confidentiality. Many of the manufacturing sites were initially separate companies that have been acquired by the FTSE 100 company. The observed sites were not randomly chosen, making it questionable whether the relationship between lean manufacturing audit scores and operational performance measures extends to all manufacturing sites. Nevertheless there is demonstrated value in the research method used (particularly the use of structural equation modelling), as well as recommendations on how the considerations listed above should be managed to conduct an effective lean manufacturing audit. This is part of a larger study to determine whether operational performance improvements can be driven through the improvement of lean manufacturing performance as measured using lean manufacturing audits. The specific improvement projects and efforts to improve the audit scores are not detailed in this paper.
2. LITERATURE REVIEW
2.1 Defining lean characteristics
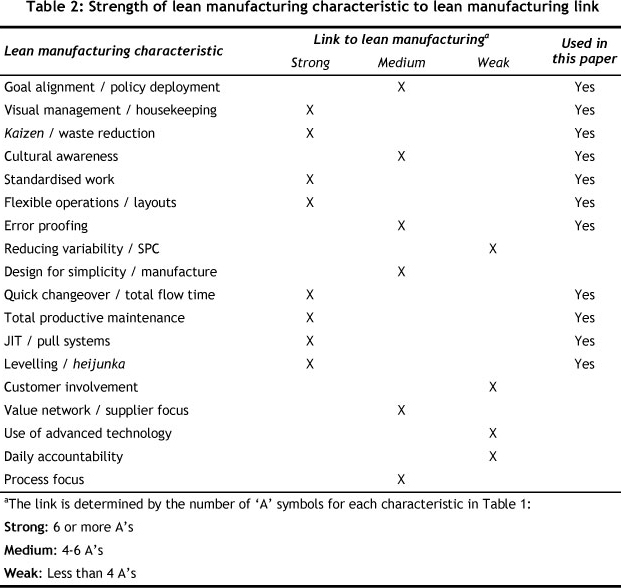
Understanding what constitutes lean manufacturing from the perspective of measurable lean characteristics is fundamental to the successful implementation of lean manufacturing. Lean characteristics commonly used in the literature are given in Table 1.
The frequency of use of each lean manufacturing characteristic in Table 1 implicitly quantifies the strength of that characteristic to measure lean manufacturing implementation (See Table 2).
2.2 Defining operational performance
Implementing lean manufacturing without the use of structured performance measures will not drive changes in operational performance if the structure of the performance measurement framework is not well understood. The measurement framework must consist of well-defined enterprise level stakeholder measures - links that map relationships between measures across multiple levels, and a uniform set of consistent measures within the framework [10]. Fullerton & Wempe [11] caution that the adoption of lean manufacturing will produce mixed results - specifically if non-financial performance measures are not implemented. Non-financial performance measures help bridge the gap between lean manufacturing and the effect on financial performance.
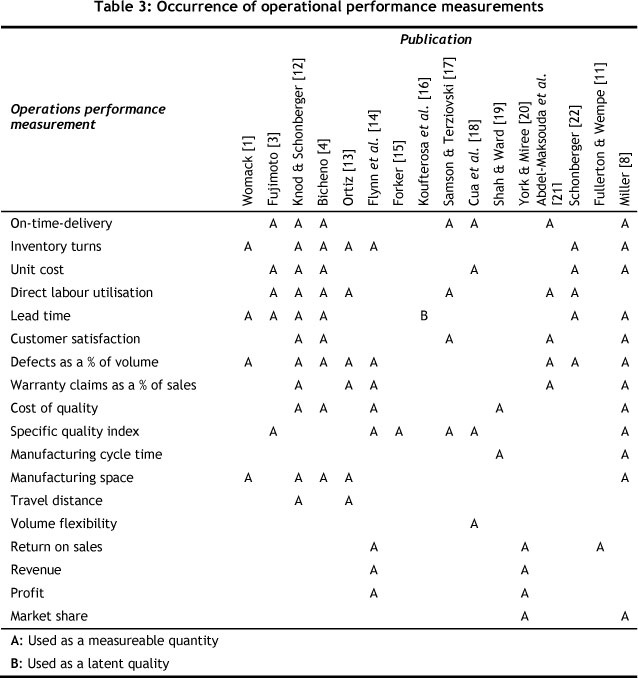
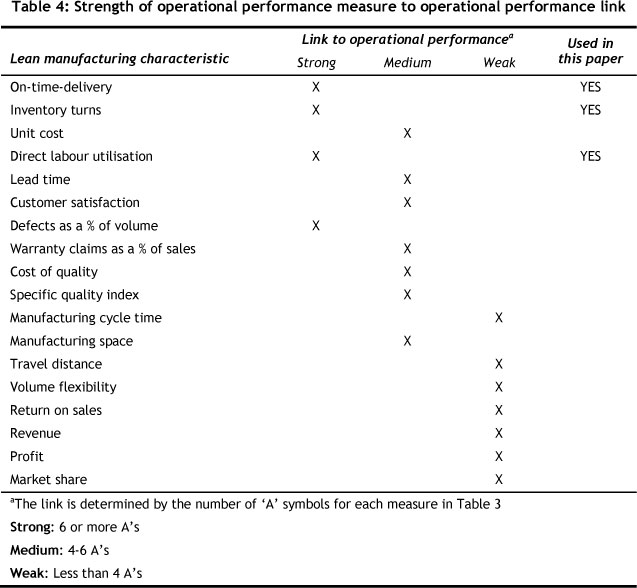
Table 3 lists 17 lean manufacturing, total quality management, and just-in-time publications that reference operational performance measures. Table 4 uses the data from Table 3 to relate the strength of operational performance measures to operational performance.
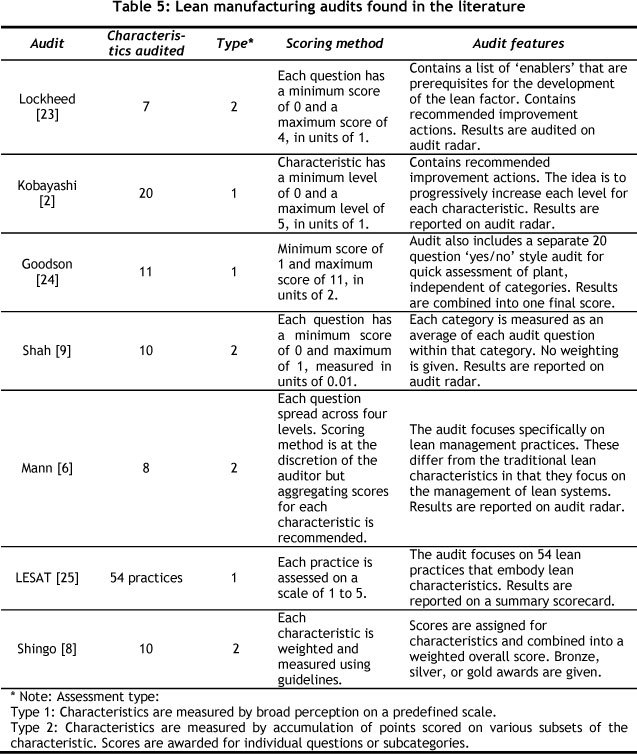
2.3 A summary of popular lean manufacturing audits
Table 5 lists and provides details of popular lean manufacturing audits used in the literature. Each lean manufacturing audit listed in Table 5 shares common features:
- The principle of lean manufacturing is divided into measurable characteristics.
- A rating system is used to measure the extent of implementation of each lean characteristic.
- The rating system for each lean manufacturing characteristic is either directly measured by broad perception, or measured through the accumulation or average of scores awarded for individual questions or subcategories.
Each audit uses a different combination of lean characteristics, and uses varying definitions to describe these lean characteristics. These differences suggest that lean manufacturing audits should not be seen as rigid and exact assessments.
The audit used in this paper was customised by the FTSE 100 company using elements of the audits reviewed in Table 5. Further details are given in the research methodology.
2.4 Defining the research gap
Research is underdeveloped on how best to structure an audit to measure improvements in operational performance effectively. This research addresses this lack by using a defined research methodology to assess data from a structured lean manufacturing audit of 64 manufacturing sites. The results provide insight into the relationship between lean characteristics and operational performance, and into how to structure an audit effectively to measure lean manufacturing efforts to improve operational performance.
The lean characteristics used in this paper are listed in the far right column of Table 2. All characteristics strongly linked to lean manufacturing, and two characteristics moderately linked to lean manufacturing, were used. Three operational performance measures strongly linked in the literature to operational performance were used (see far right column of Table 4).
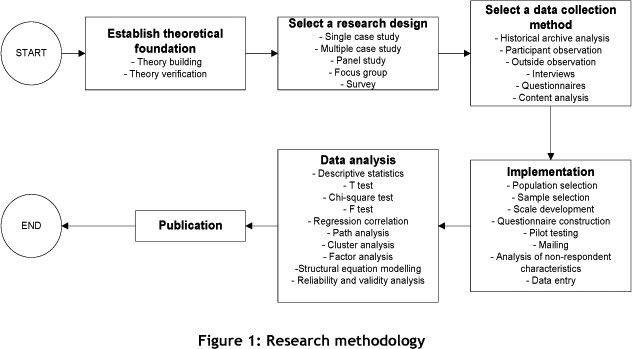
3. RESEARCH METHODOLOGY
A six-step framework based on Flynn et al. [26] was used (see Figure 1).
3.1 Theoretical foundation and research design
The principal research question is this:
Is there a positive correlation between lean manufacturing and operational performance?
The corresponding research hypothesis is as follows:
H1 : There exists a positive correlation between lean manufacturing and operational performance.
The results are used to infer how effectively the lean manufacturing audit measures drives to improve operational performance, and how to structure an audit to decrease variation in operational performance not accounted for by the audit.
3.2 Data collection method
Data for this research was gathered from a database containing lean manufacturing audit scores reflecting the extent of implementation of lean characteristics of 64 manufacturing sites that run job shop and batch operations. The database contained operational performance measures for each site.
The audits used a combination of outside observation and auditing questionnaires. Each site was audited once during the same year on the extent of implementation of lean characteristics by pairs of independent outside auditors, using the same structured lean manufacturing audit. The questionnaire covered 78 questions.
3.3 Implementation
Table 6 provides a summary of the number of questions used to measure each characteristic.
The scale used to evaluate each question was a horizontal numeric scale. The scale ranged from 0 to 4 in increments of 1. A score of 0 was awarded if no implementation of the question was evident at all. A score of 4 was awarded if there was evidence of 100 per cent implementation of the question 100 per cent of the time. The only lean manufacturing characteristic with a different scale was that of policy deployment. For this characteristic a horizontal numeric scale with a range from 0 to 4 in increments of 1 was used, but points were allocated against a set level. Each level had a description of the features needed in order to be awarded the points allocated to that level.
The operational performance measures used in this research were on-time-delivery (OTD), inventory turns, and direct labour utilisation. Exact measures of operational performance were converted into a non-linear numeric scale ranging from 1 to 8. For example, an OTD score of between 81 and 85 per cent translated into a numeric rating of 4 out of 8.
3.4 Data analysis
Structural equation modelling (SEM) is a technique that is able to specify, estimate, and evaluate models of linear relationships among a set of observed variables in the context of a generally smaller number of unobserved variables [27]. SEM models contain observed variables (referred to as manifest variables) and unobserved variables (referred to as underlying latent variables). Latent variables are hypothetical constructs that cannot be directly measured [27]. Multiple manifest variables represent an underlying latent variable.
SEM has become attractive to those doing operations management research, as it is able to find unobserved latent variables from observed measurement variables, and it is able to detail the strength of relationships both between measurement variables and latent variables, and among latent variables. This is advantageous for operations management research, which often tries to find or verify relationships between underlying constructs from a given set of observed measurements in an environment that is not easy to measure and observe mechanistically [27]. This resonates with the lean manufacturing audit, in which lean characteristics are measured to quantify the underlying degree of implementation of lean manufacturing. The present paper is the first known paper to use SEM to analyse the relationship between lean manufacturing and operational performance.
4. RESULTS
4.1 Defining the measurement and structural model
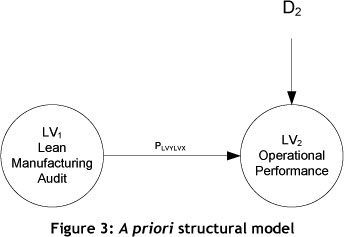
Figure 2 represents the a priori measurement model for this research. The model was over-identified, with a ratio of 3.62. Figure 3 illustrates the structural model defined in this research. The model includes a disturbance term (D2) to account for measurement error or noise.
4.2 Determining the adequacy size of the observation set
The required set of observations needed to ensure an adequate statistical power of 0.8 was more than 97, with a root mean square error of approximation (RMSEA) fit of 0.1, as criteria for accepting the null hypothesis Ho. Since the actual observation set size was 64, the power analysis suggested that the set size may have been inadequate. By increasing the RMSEA fit criteria to 0.12, the observation set size of 64 allowed the accepted adequate power limit of 0.8 to be achieved. There is in fact published SEM research that uses an RMSEA acceptance of 0.13 [27].
4.3 Data screening
All 78 questions used as individual indicators in the lean manufacturing audit had minimum indicator standardised Cronbach's α values of greater than 0.7, which indicated that all 11 lean characteristics had measurements that are reliable in describing the characteristic.
The multicolinearity between most lean characteristics and operational performance measures was less than 0.9. Two pairs of manifest variables had values greater than the recommended maximum value of 0.9, indicating multicolinearity between continuous improvement (LM06_CI) and cultural awareness (LM02_CA), and between error proofing (LM07_EP) and quick changeover (LM08_QC). These characteristics were not combined, as their multicolinearity values, despite being higher than 0.9, did not cause any problems for the measurement model.
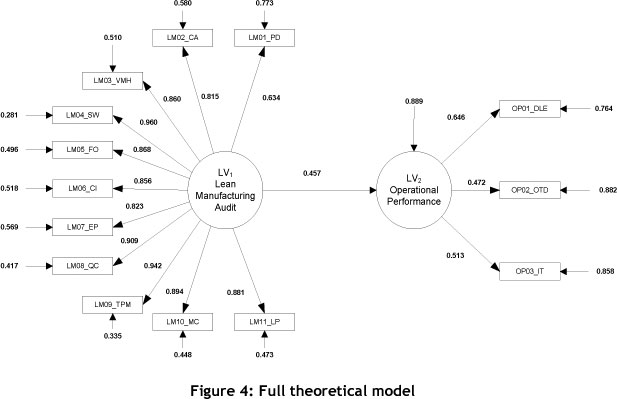
4.4 Assessing the full theoretical model
Figure 4 shows the path coefficients for the full theoretical model, which combines the measurement and structural models. All the lean characteristics, measured using the lean manufacturing audit, were strongly linked as reliable characteristics (standardised path coefficients above 0.8). The exception was policy deployment (LM01_PD), which had a standardised path coefficient of 0.634. Subsequent analysis of the measurement of policy deployment revealed that policy deployment was measured using a different scale which was unable to discern between good and bad performance. Measures for operational performance loaded on to the latent variable of operational performance with the highest standardised path coefficient of 0.646 - which was for direct labour utilisation. The measures for operational performance are therefore less reliable.
5. DISCUSSION AND RECOMMENDATIONS
5.1 Lean manufacturing audits measure operational performance improvements
Figure 4 shows that there is a positive correlation of 0.457 between lean manufacturing (considered to be a latent SEM variable, measured using audit scores) and operational performance (also considered to be a latent SEM variable, measured using operational performance measures). The probability of obtaining such a result when no correlation exists is less than 0.001. Thus the null hypothesis Ho is rejected. A positive correlation must exist if it is true that lean manufacturing audit scores and consequent projects to improve the lean manufacturing audit scores improve operational performance. The proof is, however, not complete, and the next step is to conduct a longitudinal study to prove causality.
There is a large disturbance term (D=0.889) acting on operational performance. This indicates that there is a large amount of variation in operational performance that cannot be accounted for by lean manufacturing performance, measured using lean manufacturing audit scores.
5.2 Operational performance not accounted for by the lean manufacturing audit
Variation in the operational performance not accounted for by the lean manufacturing audit scores could be due to auditor bias, audit scope limitations, ambiguous or inappropriate audit questions, inappropriate rating scales, or inadequate lean characteristic alignment. Each factor is discussed below.
a) Inadequate lean characteristic alignment: there is inadequate alignment between the lean characteristics measured and the lean characteristics that are needed to achieve 'good' operational performance measures.
b) Audit scope limitations: the audits do not fully describe the behaviour needed across the organisation to achieve 'good' operational performance measures. The operational performance measures depend on factors that are outside the scope directly measured by the lean manufacturing audit. This is possible, as on-time-delivery and inventory turns depend on factors such as supplier performance, which are not contained in the current audit.
c) Auditor bias: certain auditors were either too strict or too gentle on manufacturing sites. In this study, the auditors were randomly assigned to the manufacturing sites, which should have reduced the influence of auditor bias. A true assessment of the effect of auditor bias on the audits can only be conducted through a gauge reliability and repeatability study.
d) Ambiguous or inappropriate audit questions: the audit questions are difficult to interpret, or are used in environments where they may not be directly relevant - for example, questioning machine changeover times in a warehouse environment.
e) Inappropriate rating scales: the scale used is unable to discern between good and bad performance - for example, the auditor is forced to give the same lean characteristic score for every site.
5.3 Limitations of this study
The causality that lean manufacturing performance improvements (as measured by audits) are effective in driving improvements in operational performance is yet to be completed. Further longitudinal data is required, in which the lean manufacturing and operational performance is measured at the same site before and after continuous improvement projects.
A further limitation of this study is the small observation set size of 64. This has the effect of decreasing the statistical power of the results. Indicators pointed to the fact that the observation set size was 60 to 31 per cent below ideal values. The observation set size could not be increased, as the FTSE 100 company only owned 64 manufacturing sites.
Because each of the observed manufacturing sites is owned by the same company, it is questionable to generalise that there is a positive correlation between the results of lean manufacturing audits and operational performance measures for all manufacturing sites. Nevertheless, the value of this research lies in showing how SEM can be effectively used to answer the question about how effectively to measure lean manufacturing efforts to improve operational performance, and in recommending how to structure the lean manufacturing audit to answer this question.
5.4 Recommendations for implementing lean manufacturing audits
Based on this research, the following recommendations for implementing lean manufacturing audits are offered.
Of the eleven lean characteristics used in this research, nine were strongly linked to the construct of lean manufacturing, and two exhibited a medium strength link. These eleven provide a good starting point for an intended lean manufacturing intervention at a similar organisation. However, based on the exact type of existing manufacturing conditions, other lean characteristics such as process control and design for simplicity might be more appropriate. In service environments, other lean characteristics might be more appropriate. Determining the characteristics that should be used is beyond the scope of this study, but it should be acknowledged that there are certain universal lean characteristics such as policy deployment and continuous improvement, and other more operation specific characteristics such as quick changeover.
Operational performance measures should be customer-focused. On-time-delivery as measured by the customer is a prime measure, as well as product lead time and average cost relative to the market. A quality index can be added to the list of measures if appropriate. A customer satisfaction survey should be developed to assist in measuring certain aspects relating to lead time, quality, etc. An inventory turns rating system can also be used [7] to assess operational performance and the ability of an organisation to provide sustained value to the customer. The rating system is used to grade an organisation based on whether it is improving its inventory turns or getting worse. Direct labour efficiency should not be used as a lean measure, as it may encourage the use of resources to produce waste. A measurement of productivity should be substituted instead.
The scope of the audit should be aligned with the performance measures that measure the effectiveness of the value stream in solving the customer's exact problem: when they need it solved, and where they need it solved. The scope could include only the factory floor, or it could be extended to the entire value stream, including customer distribution and supplier networks. It is important that the audit consider every step in the value stream, or else it will not result in improved measures of operational performance. Specific audits could be developed that focus only on manufacturing, supply, dealer distribution, and support services.
Audit scores should be assessed statistically to identify outlying organisations, and these organisations should explain why their lean manufacturing audit scores do not correlate with the limits values for the audit set. These organisations should be audited half a year later.
Independent auditors should be used. They could be employees of the company, but from a different manufacturing site. The auditors should be trained to minimise bias. Audits should be administered through a company lean manager, and collated in a central database along with operational performance measures. Auditor bias should be managed annually through a selection of audit checks. These confirmation audits should assess the reliability and repeatability of the auditors. Variations should be investigated for root causes, with the aim of decreasing auditor bias through standardisation.
Questions that are difficult to interpret, or questions used in environments where they may not be directly relevant, should be avoided. There should be no interpretive error.
Care should be taken that the scale used to measure a lean characteristic is appropriate and is able to distinguish measurable differences. Analysis of the measurement scale of policy deployment within the audit used in this paper illustrated this problem.
6. CONCLUSIONS
The SEM technique has been used to show that there is a positive correlation between lean manufacturing (measured as a latent SEM variable using audit scores) and operational performance (also measured as a latent SEM variable). There must be a positive correlation if it is true that lean manufacturing audit scores, and consequent improvement projects to better the lean manufacturing audit scores, improve operational performance. The proof is, however, not complete, and the next step is to conduct a longitudinal study to prove causality.
It is concluded that lean manufacturing audits will only be effective in measuring improvements in operational performance if the audited lean characteristics are aligned with the organisation's environment and the objectives it aims to achieve, and if the audits are planned and executed accordingly. Lean manufacturing audits need to be customised.
ACKNOWLEDGEMENTS
The authors would like to thank Professor Gregory Lee from the Wits Business School for his assistance with the SEM theory used in this research, and Mark Dowdeswell from the Wits School of Statistics & Actuarial Science for reading the paper and suggesting improvements.
REFERENCES
[1] Womack, J.P. & Jones, D.T. 2003. Lean thinking: Banish waste and create wealth in your corporation, Simon & Schuster. [ Links ]
[2] Kobayashi, I. 1995. 20 keys to workplace improvement, Productivity Press. [ Links ]
[3] Fujimoto, T. 1999. The evolution of a manufacturing system at Toyota, Oxford University Press. [ Links ]
[4] Bicheno, J. 2004. The new lean toolbox, Picsie Books. [ Links ]
[5] Liker, J. 2004. The Toyota way: 14 management principles from the world's greatest manufacturer, McGraw-Hill. [ Links ]
[6] Mann, D. 2010. Creating a lean culture: Tools to sustain lean conversions, 2nd ed, Productivity Press. [ Links ]
[7] Schonberger, R.J. 2007. Best practices in lean six sigma process improvement, John Wiley & Sons. [ Links ]
[8] Miller, R.D. 2010. Model & application guidelines: The Shingo Prize for operational excellence, Jon M. Huntsman School of Business, Utah State University. [ Links ]
[9] Shah, R. & Ward, P.T. 2007. Defining and developing measures of lean production, Journal of Operations Management, 25(4), pp. 785-805. [ Links ]
[10] Mahidhar, V. 2005. Designing the lean enterprise performance measurement system, MS thesis, Engineering Systems Division, Massachusetts Institute of Technology, Boston. [ Links ]
[11] Fullerton, R.R. & Wempe, W.F. 2009. Lean manufacturing, non-financial performance measures, and financial performance, International Journal of Operations & Production Management, 29(3), pp. 214-240. [ Links ]
[12] Knod, E.M. & Schonberger, R.J. 2001. Operations management: Meeting customers' demands, McGraw-Hill/Irwin. [ Links ]
[13] Ortiz, C.A. 2008. Lessons from a lean consultant: Avoiding lean implementation failures on the shop floor, Prentice-Hall. [ Links ]
[14] Flynn, B., Schroeder, R. & Sakakibara, S. 1995. The impact of quality management practices on performance and competitive advantage, Decision Sciences, 26(5), pp. 659-691. [ Links ]
[15] Forker, L.B. 1997. Factors affecting supplier quality performance, Journal of Operations Management, 15(4), pp. 243-269. [ Links ]
[16] Koufterosa, X.A., Vonderembse, M.A. & Doll, W.J. 1998. Developing measures of time based manufacturing, Journal of Operations Management, 16(1), pp. 21-41. [ Links ]
[17] Samson, D. & Terziovski, M. 1999. The relationship between total quality management practices and operational performance, Journal of Operations Management, 17(4), pp. 393-409. [ Links ]
[18] Cua, K., McKone, K. & Schroeder, R. 2001. Relationships between implementation of TQM, JIT, and TPM and manufacturing performance, Journal of Operations Management, 19(6), pp. 675-694. [ Links ]
[19] Shah, R. & Ward, P.T. 2003. Lean manufacturing: Context, practice bundles, and performance, Journal of Operations Management, 21(2), pp. 129-149. [ Links ]
[20] York, K.M. & Miree, C.E. 2004. Causation or covariation: An empirical re-examination of the link between TQM and financial performance, Journal of Operations Management, 22(3), pp. 291-311. [ Links ]
[21] Abdel-Maksouda, A., Dugdaleb, D. & Luther, R. 2005. Non-financial performance measurement in manufacturing companies, The British Accounting Review, 37(3), pp. 261-297. [ Links ]
[22] Schonberger, R.J. 2007. Japanese production management: An evolution - with mixed success, Journal of Operations Management, 25(2), pp. 403-419. [ Links ]
[23] Lockheed, . 2006. Lean scorecard and self assessment tool. [ Links ]
[24] Goodson, R.E. 2002. Read a plant - fast, Harvard Business Review, 80(5), pp. 105-121. [ Links ]
[25] Nightingale, D. 2001. LESAT Lean enterprise self-assessment tool, presented at the LAI Plenary Conference, Cambridge, Massachusetts. [ Links ]
[26] Flynn, B., Sakakibara, S., Schroeder, R.G., Bates, K.A. & Flynn, E.J. 1990. Empirical research methods in operations management, Journal of Operations Management, 9(2), pp. 250-284. [ Links ]
[27] Shah, R. & Goldstein, S.M. 2006. Use of structural equation modeling in operations management research: Looking back and forward, Journal of Operations Management, 24(2), pp. 148-169. [ Links ]
* Corresponding author

