


Serviços Personalizados
Artigo
 Inglês (pdf)
 Artigo em XML
 Referências do artigo
Indicadores

Links relacionados
-
 Citado por Google
 -
 Similares em Google
Compartilhar

 Permalink
South African Journal of Industrial Engineering
versão On-line ISSN 2224-7890
versão impressa ISSN 1012-277X
S. Afr. J. Ind. Eng. vol.24 no.1 Pretoria Jan. 2013
The analysis of speed-reporting rates from a cellular network based on a fingerprint-positioning algorithm
Chi-Hua ChenI, 1, *; Chi-Chun LoII, 2; Hui-Fei LinIII, 3
IInstitute of Information Management National Chiao Tung University, Taiwan, ROC. chihua0826@gmail.com
IIInstitute of Information Management National Chiao Tung University, Taiwan, ROC. cclo@faculty.nctu.edu.tw
IIIDepartment of Communication and Technology National Chiao Tung University, Taiwan, ROC huifeilin@mail.nctu.edu.tw
ABSTRACT
The collection of real-time traffic information is an important part of intelligent transportation systems. In particular, cellular floating vehicle data (CFVD) technology has become increasingly widespread, and more and more popular for measuring and forecasting real-time traffic information, based on anonymous sampling of the positions of mobile phones. This study proposes an analytical model to analyse the speed-reporting rates -based on communication behaviour, traffic conditions, and the two consecutive fingerprint-positioning locations from the call arrival and call completion signals of the same call - for a feasibility evaluation of CFVD.
OPSOMMING
Die versamel van werklike, intydse verkeersinligting is 'n belangrike deel van intelligente vervoersisteme. In die besonder het sellulêre bewegende voertuigdata tegnologie toenemend algemeen en populêr geword vir die meting en vooruitskatting van intydse verkeersinligting. Dit word gebaseer op die anonieme monsterneming van die posisie van seltelefone. Hierdie artikel hou 'n analitiese model voor vir die ontleding van die tempo waarteen snelheid gerapporteer word soos gebaseer op die kommunikasiegedrag, verkeerstoestande en twee opeenvolgende vingerafdruk posisioneringsliggings van die oproep aankoms- en voltooiingseine soos ontvang vir dieselfde oproep - om sodoende die tegnologie te evaluaeer vir uitvoerbaarheid.
1. INTRODUCTION
Intelligent transportation systems (ITSs) have become increasingly popular; numerous studies have attempted to examine wireless communication with a traffic information service [1]. For example, ITIS Holdings commercially applied the patented cellular floating vehicle data (CFVD) technology to measure and forecast real-time traffic information by anonymous sampling of the positions of mobile phones [2]. They retrieved the double-handover signals from the cellular network, and analysed their time signatures to infer traffic information. However, the location accuracies of some handover pairs are low [3]. Although a fingerprint-positioning algorithm (FPA) has been proposed to improve location accuracy [3,4], the speed-reporting rate of the FPA has not been investigated. This study uses the FPA to provide greater location and speed accuracies, and proposes an analytical model for analysing the speed-reporting rate for the CFVD feasibility evaluation.
The remainder of the paper is structured as follows. Section 2 discusses and compares the location determination and speed estimation methods. Section 3 provides the speed estimation based on the FPA, and proposes an analytical model to analyse the speed-reporting rate. Section 4 shows and discusses the experimental results of the speed estimation accuracy and speed-reporting rate. Section 5 provides a conclusion.
2. LITERATURE REVIEW
In a cellular network, such as a global system for mobile communications (GSM) or a universal mobile telecommunications system (UMTS), the service area is populated with a large number of base stations (BSs), each providing radio coverage in its vicinity. Without loss of generality, the radio coverage of a BS is called a cell, which is identified by a unique cell global identification (CGI). The BS broadcasts its CGI periodically, and when a mobile station (MS) attaches to the cellular network, it camps on a BS and stores the CGI of the BS. The MS submits or accepts a call through the camped-on BS, and then sends the measure report through a radio network - i.e., a base station subsystem (BSS) and radio network subsystem (RNS) - during a call. If this MS moves from one BS to another during a call, then a handover occurs. Therefore, cell ID, handover signals, and received signal strengths (RSS) from measure reports, which are usually used to determine the location of the MS [3-13], are described in the following subsections.
2.1 Cell ID-based location method
The cell ID-based location method is defined in the location service specification (LCS) by the 3rd generation partnership project (3GPP) [5]. When the MS connects to a cellular network, the network operator can record its cell ID and look up the geographic location of that BS in a database [6]. However, the cell length is generally about two km, and the location error depends on the cell size. So this approach may be unsuitable for speed estimation.
2.2 Handover-based location method
Some studies and projects use a handover-based location method to retrieve double-handover signals from a cellular network and to analyse their time signatures for speed estimation [2,7-10]. This approach has numerous difficulties in estimating position, vehicle speed, and travel time. Gundlegard and Karlsson [7] showed the handover location accuracy for both GSM and UMTS, providing the speed estimation accuracy for the cellular network, but indicating that the handover location accuracy is better in UMTS than in GSM [7]. Birle and Wermuth [8] measured the traffic speed using a double handover, and compared the average speeds from cell phone probe data, floating car data, and loop detector data [8]. For an estimation of travel time and speed, the average absolute relative difference of the travel time is 10.7 percent, as indicated by Bar-Gera [9]. In addition, CFVD may be used to estimate the vehicle speed and travel time in GSM and UMTS [2,7-10]. However, the location errors of some handover pairs are large, and a larger speed estimation error is correlated with a lower handover location accuracy and the distance between two handover events.
2.3 Fingerprint-positioning algorithm
For a higher location accuracy, an FPA is proposed to analyse the RSS by using measure reports and generating the location information of the MS [3,4,11,12]. Two stages are implemented in this approach: calibration and usage. In the calibration stage, the RSS and the geographic location of the MS are collected as training data and stored in a database. The usage stage retrieves the RSS of the MS and uses its algorithm to determine the location of the MS according to the training data in the database. Although the FPA provides a higher accuracy of location determination and speed estimation [3], the speed-reporting rate has not been investigated for the feasibility evaluation of the CFVD. This study uses the FPA to estimate the speed of the MS, and proposes a model to analyse the speed-reporting rate.
3. AN ANALYTICAL MODEL OF SPEED-REPORTING RATES
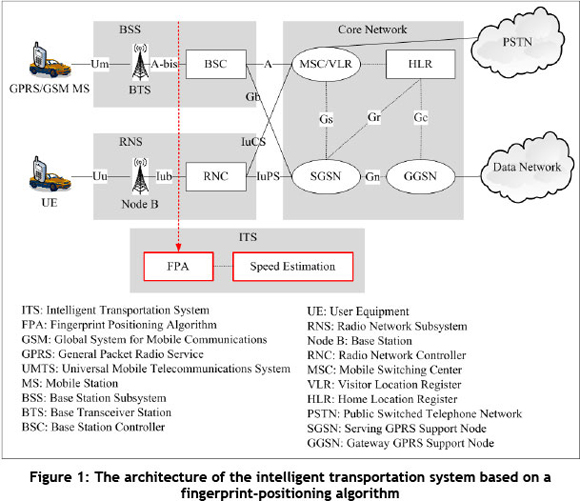
This study designed an ITS to collect and analyse the network signals using A-bis and Iub interfaces from cellular networks, as shown in Figure 1. The FPA [3,4] is used to analyse the RSS of measurement reports from each MS when the MS is in active mode - i.e., call arrival (CA) and call completion (CC). When more than two locations of the same MS on the same road are found, the speed estimation is then computed and reported.
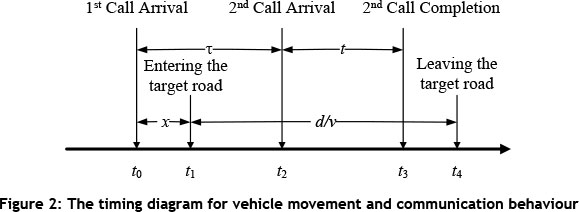
This study proposes an analytical model to study the speed-reporting rate based on communication behaviour, traffic conditions, and the two consecutive fingerprint-positioning locations from the CA and CC signals of the same call. Figure 2 shows the timing diagram for vehicle movement and communication behaviour. A preceding call (shown at time t0 in Figure 2) is performed before entering the target road (shown at time t1 in Figure 2). Then the MS in the car moving along the target road performs a call set-up (shown at time t2 in Figure 2) and a CC (shown at time t3 in Figure 2) before leaving the target road (at time t4 in Figure 2).
The following assumptions are used in the model:
- CAs to/from each MS per car along the road can be evaluated. The CA process is assumed to be a Poisson process with an average rate of λ. The call inter-arrival time ris exponentially distributed with the mean 1/λ [14].
- The call holding time t is exponentially distributed with the mean 1 /µ [14].
- The traffic flow f and average vehicle speed v along the road can be obtained from the fixed vehicle detector (VD) data on the road.
- Time x is the time between the preceding CA and entering the target road.
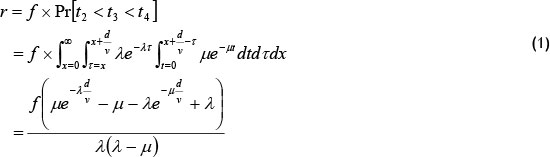
The output measure is the speed-reporting rate r on the target road. Consider the CA and CC of an MS used to generate the speed report by CFVD. The speed-reporting rate can then be expressed as equation (1).
4. EXPERIMENT RESULTS
This study compared the FPA and cell ID-based and handover-based location methods using practical experiments. The numerical analyses and simulation of speed-reporting rates are provided in this section.
4.1 The accuracy of location determination
This study analysed the real traffic information and speed-reporting rates to evaluate the feasibility of CFVD. The experiments were conducted on a 12.2 km long segment on Expressway No. 66 in Taiwan. The drive was repeated 12 times with an MS device (an HTC Desire running Android platform 2.2) using a GPS receiver. Signal data and geographical coordinates were simultaneously collocated from an MS. In the experiments, 96 different BSs were detected on the expressway segment. This study also presents the numerical results from the evaluation of the speed-reporting rate on the expressway segment.
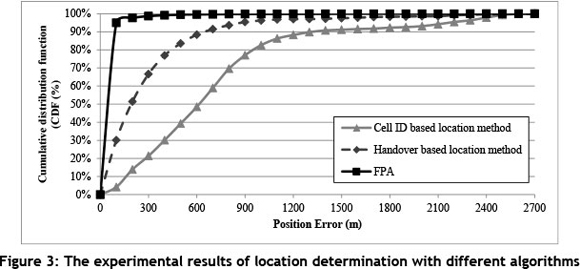
The location determination accuracy, found using FPA, was assessed using data from 12 test runs to evaluate each location. In total, 6,299 records were collected from the MS during test runs. This study measured the performance of this approach with k-fold cross-validation. Figure 3 shows the comparison between using the FPA, cell ID-based, and handover-based location methods [3-13]. The FPA data show that the average error of the location determination is 36.11 meters. Using cell ID-based and handover-based location methods to implement and evaluate the errors of location generates errors of 714.07 meters and 293.54 meters respectively. Therefore, using FPA to determine the location for speed estimation is better than using the handover-based location method.
4.2 Numerical analysis of speed reporting rate
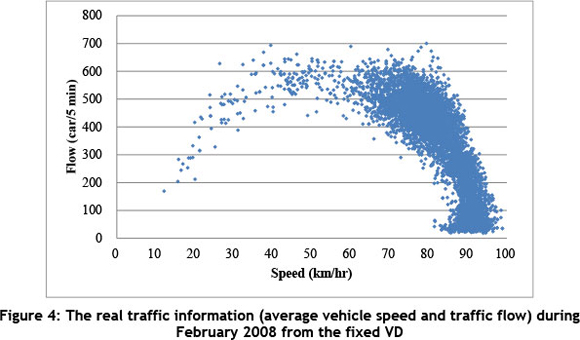
Figure 4 shows the real traffic information, including traffic flow and average vehicle speed, posted every five minutes during February 2008 from the fixed VD at the 41.5 km milepost on Highway No. 1 in Taiwan. This study adopts parameters based on historical data from
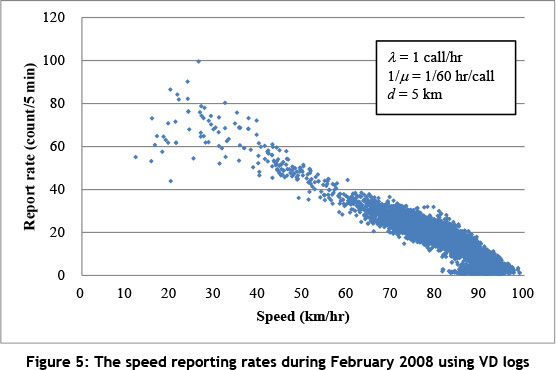
Chunghwa Telecom as follows: λ = 1 call/hr; 1/ µ = 60 sec; and d = 5 km. Figure 5 shows that the speed-reporting rates are measured using the real traffic information from VD logs. The average speed-reporting rate is 16.35 for every five minute segment.
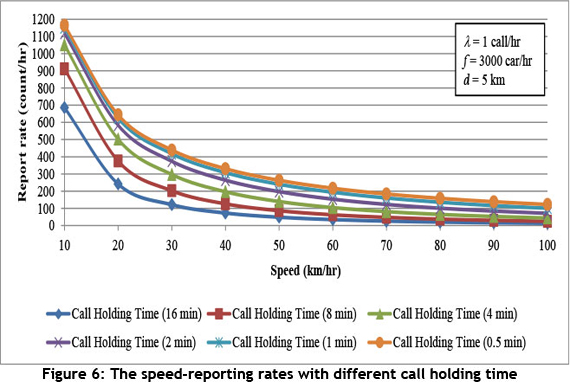
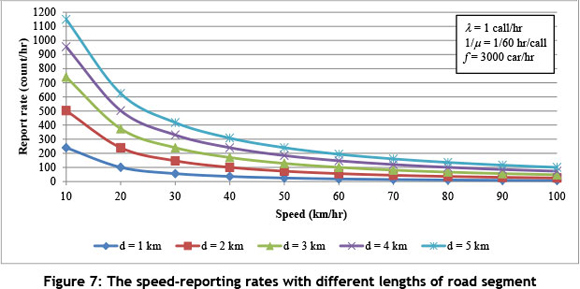
For demonstration purposes, this study adopted numerous parameters to estimate the average speed reporting rate: f = 3,000 cars/hr; λ = 1 call/hr; d = 5 km; and 1/µ = 60 sec. Furthermore, the highway speed limitation in Taiwan is 100 km/hr. Figures 6 and 7 show the speed-reporting rate estimations with different average call-holding times and different lengths of road segments respectively. The results indicate that the average speed-reporting rates by CFVD are higher than 1 count/5 min in varying scenarios. This approach also shows that the speed-reporting rates increased when the average vehicle speed was reduced, providing quicker updates on traffic congestion.
4.3 Simulation of speed reporting rate
In this section, this study designed two cases that included (1) free flow and (2) traffic congestion to simulate vehicle movement and MS communication, and to estimate the speed reporting rate.
4.3.1 Simulation environments
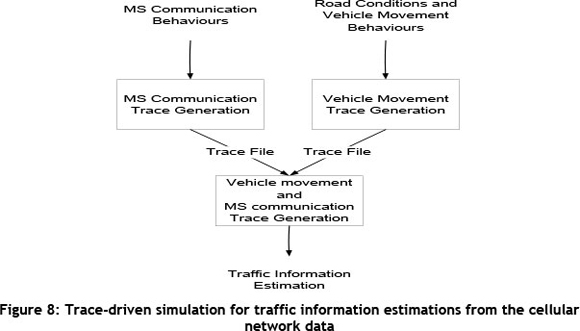
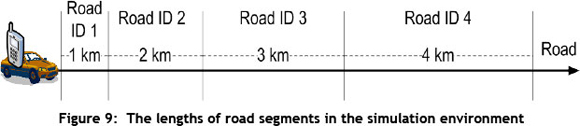
Trace-driven experiments are designed to consist of the vehicle movement trace generation, MS communication trace generation, and the combined trace files for traffic information estimations by using cellular network data (Figure 8). The vehicle movement trace is obtained from VISSIM tools [15], a traffic simulator, and real measurements from a highway. This study considers a highway scenario that is characterised by the Wiedemann 'psychophysical' car-following model and lane-changing model [15], where the average vehicle speeds are 90 km/hr in Case 1 and 20 km/hr in Case 2. Four road segments are used, the lengths of which are 1 km, 2 km, 3 km, and 4 km respectively, in the simulation experiments (Figure 9). The simulation time is 3,600 seconds. This study assumes that each car has one MS, and adopts numerous parameters to generate the random numbers by using the assumption in Section 3 for the speed-reporting rate estimation, as follows: f = 3,000 cars/hr; λ = 1 call/hr; and 1/µ = 60 sec.
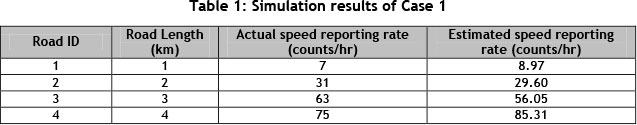
4.3.2 Case 1: Free flow
In Case 1, this study designed a free flow scenario, with the average vehicle speed set to 90 km/hr. Table 1 shows that actual speed-reporting rates for road IDs 1, 2, 3, and 4 are 7, 31, 63, and 75 counts/hr respectively. High speed-reporting rates were recorded on long road segments. Futhermore, the estimated speed-reporting rates, calculated using equation (1), were 8.97, 29.60, 56.05, and 85.31 counts/hr for road IDs 1, 2, 3, and 4 respectively. The chi-squared test was used to test the significance of the actual and estimated speed-reporting rates. The test results showed that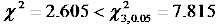 under or a =0.05, and no significant difference was found.
4.3.3 Case 2: Traffic congestion
In Case 2, the traffic congestion scenario, the average vehicle speed was set at 20 km/hr. Table 2 shows that the actual speed-reporting rates for road IDs 1, 2, 3, and 4 are 104, 239, 377, and 511 counts/hr respectively. Moreover, the estimated speed-reporting rates, calculated using equation (1), are 100.48, 239.61, 374.12, and 502.18 counts/hr for road IDs 1, 2, 3, and 4 respectively. The chi-squared test was used to test the significance of the actual and estimated speed-reporting rates. The test results showed that  , and no significant difference was found.
Compared with Case 1, the speed-reporting rate was higher when the vehicles were moving at a slower speed. Therefore the FPA can be used to provide more immediate traffic information when traffic is congested.
5. CONCLUSIONS
This study used a model to analyse the speed-reporting rate, considering communication behaviour, real traffic information, and the two consecutive fingerprint-positioning locations from CA and CC signals of the same call for a feasibility evaluation of CFVD. This approach shows that speed-reporting rates are higher when the average vehicle speed is lower, providing quick updates on traffic congestion. Therefore speed estimation by CFVD is more suitable for ITS.
ACKNOWLEDGMENTS
The research is supported by the National Science Council of Taiwan under grants Nos. NSC 100-2811-H-009-011, NSC 100-2622-H-009-001-CC3, and NSC 101-2420-H-009-004-DR.
REFERENCES
[1] Lubbe, A.J. & Kluge, P. 2008. Development and testing of a wireless controlled car using the internet as communication medium, South African Journal of Industrial Engineering, 19(1), pp. 137-147. [ Links ]
[2] Logghe, S. & Maerivoet, S. 2007. Validation of travel times based on cellular floating vehicle data, Proceedings of the 6th European Congress and Exhibition on Intelligent Transportation Systems, Aalborg, Denmark. [ Links ]
[3] Lin, B.Y., Chen, C.H. & Lo, C.C. 2011. A novel speed estimation method using location service events based on fingerprint positioning, Advanced Science Letters, 4(11-12), pp. 3735-3739. [ Links ]
[4] Chen, C.H., Lin, B.Y., Lin, C.H., Liu, Y.S. & Lo, C.C. 2012. A green positioning algorithm for campus guidance system, International Journal of Mobile Communications, 10(2), pp. 119-131. [ Links ]
[5] 3GPP. 2012. 3GPP Technical Specification Group (TSG) Services and System Aspects, TS 22.071, Location Services (LCS); Service description; Stage 1 (Release 11), version 11.0.0. [ Links ]
[6] Bshara, M., Orguner, U., Gustafsson, F. & van Biesen, L. 2011. Robust tracking in cellular networks using HMM filters and cell-ID measurements, IEEE Transactions on Vehicular Technology, 60( 3), pp. 1016-1024. [ Links ]
[7] Gundlegard, D. & Karlsson, J.M. 2009. Handover location accuracy for travel time estimation in GSM and UMTS, IET Intelligent Transport Systems, 3(1), pp. 87-94. [ Links ]
[8] Caceres, N., Wideberg, J.P. & Benitez, F.G. 2008. Review of traffic data estimations extracted from cellular networks, IET Intelligent Transport Systems, 2(3), pp. 179-192. [ Links ]
[9] Bar-Gera, H. 2007. Evaluation of a cellular phone-based system for measurements of traffic speeds and travel times: A case study from Israel, Transportation Research Part C, 15(6), pp.380-391. [ Links ]
[10] Yang, F., Cheng, Y., Jin, J., Xia, J., Yang, D. & Ran, B. 2012. Wireless communication simulation model for traffic monitoring systems based on dynamic cellular handoffs: Framework and evaluation, Transportation Research Record, (2291), pp. 26-34. [ Links ]
[11] Kuo, S.P. & Tseng, Y.C. 2008. A scrambling method for fingerprint positioning based on temporal diversity and spatial dependency, IEEE Transactions on Knowledge and Data Engineering, 20(5), pp. 678-684. [ Links ]
[12] Bshara, M., Orguner, U., Gustafsson, F. & van Biesen, L. 2010. Fingerprinting localization in wireless networks based on received-signal-strength measurements: A case study on WiMAX networks, IEEE Transactions on Vehicular Technology, 59(1), pp. 283-294. [ Links ]
[13] Chen, C.H., Cheng, D.Y., Lin, B.Y., Lu, Y.J. & Lo, C.C. 2012. A trust mechanism for web services registries data exchanging, International Journal of Innovative Computing, Information and Control, 8(11), pp. 7955-7968. [ Links ]
[14] Lin, Y.B., Tsai, M.H., Dai, H.W. & Chen, Y.K. 2009. Bearer reservation with preemption for voice call continuity, IEEE Transactions on Wireless Communications, 8(5), pp. 2716-2725. [ Links ]
[15] Planung Transport Verkehr AG. 2009. VISSIM user manual - V.5.20. Karlsruhe, Germany. [ Links ]
* Corresponding author
1 The author is working toward the PhD (Information Management) degree at the Institute of Information Management, National Chiao Tung University.
2 The author was enrolled for the PhD (Computer Science and Engineering) degree at the Department of Computer Science and Engineering, Polytechnic Institute of New York University.
3 The author was enrolled for the PhD (Mass Communications) degree at the College of Communications, Pennsylvania State University.

