


Services on Demand
Article
 English (pdf)
 Article in xml format
 Article references
Indicators

Related links
-
 Cited by Google
 -
 Similars in Google
Share

 Permalink
South African Journal of Industrial Engineering
On-line version ISSN 2224-7890
Print version ISSN 1012-277X
S. Afr. J. Ind. Eng. vol.24 n.1 Pretoria Jan. 2013
Assessment of the quality of service provided by a national regulatory institution
O. AdetunjiI; V.S.S. YadavalliII; A. MaladaIII
IDepartment of Industrial and Systems Engineering University of Pretoria, South Africa. olufemi.adetunji@up.ac.za,
IIDepartment of Industrial and Systems Engineering University of Pretoria, South Africa. sarma.yadavalli@up.ac.za
IIINational Home Builders Registration Council South Africa. awelanim@nhrc.org.za
ABSTRACT
Government institutions need to assess how well they meet the needs of their customers, and what their customers think about the quality of the services they provide. This is aligned with the 'Batho Pele' principle of the South African government. The SERVQUAL scale, augmented with a qualitative survey, was used to determine how the National Home Builders Registration Council (NHBRC) is perceived by its clients, which key factors drive such perceptions, and whether the perceptions are consistent across the different client groups of this regulatory institution. The complementary role of qualitative data in illuminating issues driving quantitative results is highlighted. Service quality scores are computed for the NHBRC. The convergence of opinions of different customer groups was studied using correlation analysis. The significance of service quality perception gaps was tested using the multivariate analysis of variance, and the reliability of the SERVQUAL scale was examined using exploratory factor analysis. It was observed that by improving the feedback mechanism of the NHBRC, their clients' customer service quality perceptions could be enhanced.
OPSOMMING
Staatsinstansies moet vasstel hoe goed daar voldoen word aan die verwagtinge van hulle kliënte en wat die opinie van hulle kliënte is aangaande die kwaliteit van die diens wat gelewer word. Dit is belyn met die 'Batho Pele'-beginsel van die Suid-Afrikaanse regering. Die SERVQUAL-skaal , aangevul met 'n kwalitatiewe opname, is gebruik om te bepaal hoe die NHBRC waargeneem word deur sy kliënte, watter faktore hierdie persepsies skep en of die perspesies konsekwent voorkom in die verskillende kliënte-groepe van hierdie regula-toriese instansie. Die komplimentêre rol wat kwalitatiewe data speel om lig te werp op die kwantitatiewe resultate word uitgewys. Verskeie statistiese metodes is aangewend om onder meer die konvergensie van opinie, die betekenisvolheid van diensgapings en die betroubaarheid van die SERVQUAL-skaal te ondersoek. Daar is gevind dat verbeterde terugvoermeganismes binne die NHBRC die persepsie aangaande kwaliteit by hulle kliënte sal verbeter.
1. INTRODUCTION
The management of quality - and its link to performance measurement - is an area in which industrial engineering tools have been well applied; but, because it is intangible, measuring service quality is much fuzzier than measuring the quality of physical products. This study focuses on measuring the quality of service provided by a government regulatory institution through the use of the SERVQUAL instrument.
The National Home Builders Registration Council (NHBRC) was established by an Act of Parliament to register homes and homebuilders, to arbitrate between builders and home owners, and to establish and maintain standards in the building industry. The NHBRC's client segments are diverse, and the organisation is involved in many diverse issues, from registration to arbitration. This makes it imperative for the NHBRC to understand its clients' perceptions of the quality of the services it provides, identify the key factors driving these perceptions, check the consistency of these perceptions across client segments, and identify possible ways to eliminate the causes of service quality gaps.
Service quality has become very relevant in the field of industrial engineering. While measurement of service quality may not traditionally be in the domain of industrial engineering, the continued integration of products and services as a service continuum has made it important for an industrial engineer to understand service quality measurement and its associated techniques. Presently there is a complex integration of goods and services in production activities, where most organisations are either providing services to facilitate sales of goods, or providing goods to facilitate provision of services [33]. This makes it increasingly difficult to separate goods from services as the supply chain becomes more and more integrated. Measuring the quality of the products gradually becomes a matter of measuring the quality of the goods delivered, as well as measuring the supporting services. Langley et al. [32] particularly noted that service is now seen as an augmented product even in the traditional manufacturing environment, such that companies that are traditionally manufacturing-based, such as Ford, now pride themselves in the quality of their after-sale services - since it is now popularly realised that good customer service is a key competitive advantage.
The questions to be addressed in this study are:
- How do the clients perceive the quality of the services offered by the NHBRC?
- In which areas does the NHBRC seem not to be performing well?
- What are the key drivers of these performance gaps?
- Do the service quality perceptions of the organisation's diverse client groups converge?
- Do the responses from the NHBRC clients support SERVQUAL's factor structure?
The SERVQUAL instrument, together with appropriate statistical techniques, seems ideal to address these five key questions. The seminal work on the development and use of SERVQUAL as an instrument for measuring service quality was done by Zeithaml et al. [1]. The objective was to reposition American firms for competitiveness in the services industry. Since the introduction of SERVQUAL in the USA, the instrument has been widely applied across a large range of industries. Several applications and modifications of the scale have been documented.
1.1 Review of SERVQUAL and its link to SERVPERF
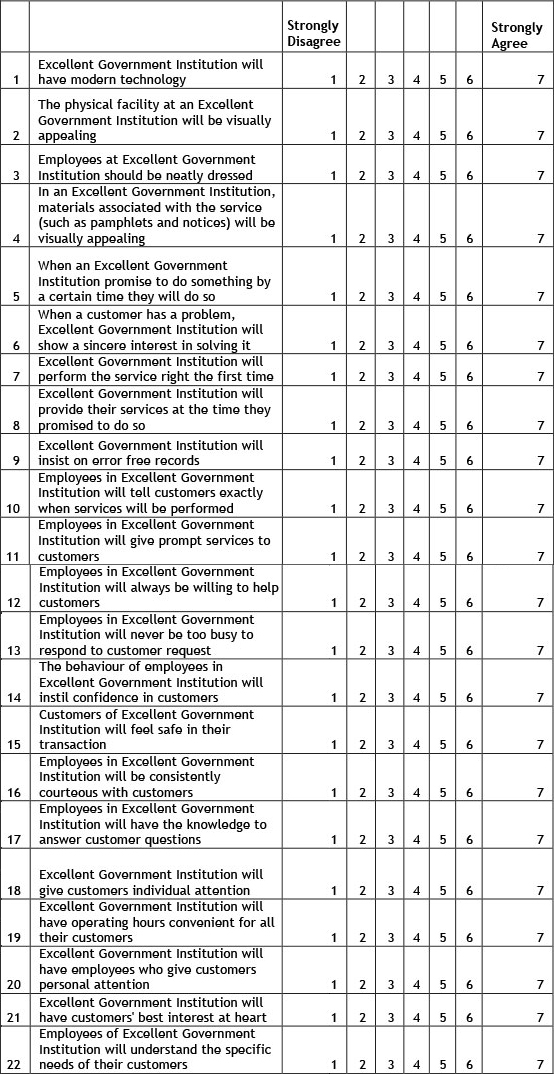
The original SERVQUAL scale consists of 22 items that measure perceived service quality across five dimensions. These five dimensions are tangibles, reliability, responsiveness, assurance and empathy. The tangibles dimension measures the effects of the appearance of the physical facilities, equipment, personnel, and communication materials on the client's perception of service quality. It is measured by the response to the first four items on the SERVQUAL scale (appendix 1). Reliability addresses the ability to perform the promised service dependably and accurately, and is measured by items 5-9. Responsiveness is defined as the willingness to help clients and provide prompt service, and is measured by items 10-13. Assurance measures the knowledge and courtesy of employees and their ability to convey trust and confidence, and is measured by items 14-17. Empathy is the caring and individualised attention provided to clients, and is measured by items 18-22 on the scale.
Measuring service quality with SERVQUAL is done using the 22-item scale to measure what clients expect from their company on a 7-point Likert scale, and then measuring how the clients believe the company performed using the same 22-item scale on another 7-point Likert scale. The difference between the service expectation and the service perception is then used to compute the score for the company along the five dimensions identified.
SERVQUAL is based on the gap model of service quality, proposed by the same authors. As can be seen from Figure 1, five gaps were defined as responsible for non-delivery of quality service. Four of these gaps (gaps 1 to 4) occur as a result of the processes of the service provider, while the last one (gap 5) is due to the difference between what the client expects and what is perceived to have been delivered. Gap 1 is said to be the result of the difference between what the management thinks the client wants, and what the client actually wants; and this forms one of the diagnostic bases of SERVQUAL. Gap 2 results from incorrectly translating what the management believes the client wants into the relevant service specification. Gap 3 results from not being able to deploy an enabling process to deliver on the service specification. Gap 4 relates to communicating the correct value proposition to the customer, which also affects the expectations of the customer.

The SERVPERF model has the same 5-dimensional and 22-item structure as the SERVQUAL, but the expectation components are excluded. This makes data collection for SERVPERF relatively less intensive, needing only about 50 percent of what is required for SERVQUAL. This has been said to be one of the advantages of SERVPERF over SERVQUAL.
SERVQUAL's applicability has been widely criticised; but despite the many alternatives provided, its application is still pervasive, possibly due to the shortcomings of the proposed alternatives. Succinct reviews of the main criticisms against SERVQUAL and its various adaptations are presented in Ladhari [2] and Buttle [30]. The critique includes its 'gap score' definition [3, 4], the improper definition of expectation [5, 6], the validity of its items and dimensions [7], the fact that it focuses only on service process and not on the service outcomes [8], and having a multi-level measurement scale [9]. Measuring the product outcome for services may be quite difficult; so service quality is usually measured through the quality of its delivery processes. There are also questions about using a gap score instead of simply using a perception score, since it may be more difficult to define 'expectation' objectively. The validity of SERVQUAL's scale and the stability of its factor structures have also been called into question. There have been reports of inconsistency in the findings reported by the use of the five factor structure of SERVQUAL. Cronin and Taylor [4] have suggested that SERVPERF, which only measures service quality perception, is more suitable than SERVQUAL; while Lam [10] and Carman [7] have argued about the stability of the number of service quality dimensions identified in the SERVQUAL scale. Other issues include the design of the scale, and the need to incorporate culturally-specific measures.
McDougall and Levesque [18] provided empirical evidence that performance-based measures of service quality perceptions are more efficient than measures of both service quality expectations and performance. Lee-Ross [19] stated that empirical evidence fails to support the five dimensional structure of SERVQUAL, and that little support was found for the concurrent validity of the instrument. He also argued that service quality is context-specific, with fewer dimensions than the five originally proposed by the developers of the SERVQUAL scale. Miller et al. [20] randomised the presentation order of the questions measuring the five SERVQUAL dimensions, compared the results with the traditional order of presentation, and noted that the conclusions changed drastically. The resulting samples from the randomised order were then used to generate factor structures that proved to be non-congruent. These results, they noted, raise the question of whether SERVQUAL's five dimensions truly measure the underlying construct. Asubonteng et al. [21] provide a review of the stability of the SERVQUAL dimensions based on a collation of papers on empirical observations. They note that SERVQUAL performs well in terms of face validity, which is about the appropriateness of its individual items. It also appears to have performed well in terms of convergent validity, which measures the coherence among the items, and has performed fairly well in terms of concurrent validity, which deals with how well the scores are associated as hypothesised with conceptually related matters. But it scored poorly in terms of discriminant validity, which measures how well it identifies the service quality dimensions. They reported significant overlap, especially among the dimensions of responsiveness, assurance, and empathy.
Many of the criticisms of the SERVQUAL scale have been challenged by other authors. Ladhari [2] noted that, of all the alternatives to SERVQUAL scales devised to date, only INDSERV appeared to have outperformed SERVQUAL in its particular context. He also argued that the methodical approach of Parasuraman [11,12,13] in defining SERVQUAL seems more rigorous than those of the alternatives. He even argued that having a higher Cronbach's alpha may not necessarily imply that the alternatives are better models. In fact, Kwok and Sharp [14] describe the use of exploratory factor analysis as nothing more than a 'fishing expedition', since the resulting factor solution could be any one of an infinite number of possible solutions. Also, only a few studies have supported all three types of validity tests (convergent, discriminant, and predictive) advocated by critics and the validity of any of the alternatives to SERVQUAL has not really been well proven.
Another important point is that most other scales either made use of many of the dimensions and items of SERVQUAL, or have been built on them. In fact, Ladhari [2] showed that the five dimensions of SERVQUAL have been retained in many of the other thirty industry-specific service quality measurement scales he reviewed, and most other techniques also focused on functional (process-related) quality rather than on technical (outcome-related) quality. SERVQUAL still appears popular, and has recently been used to measure perceived service quality in diverse industries - for example, by Udo et al. [15] in e-learning, Wilson et al. [16] in food and agribusiness, and Shekarchizardeh [17] in tertiary education.
Applications of SERVQUAL measuring the quality of government services include Wisniewski and Donelly [22], who measured the service quality of public libraries in the UK; and Wisniewski [23], who used SERVQUAL in local government service quality assessment in the UK. Sargeant and Kaehler [24] used it to assess service quality in UK hospitals, exploring the difference in quality perception between fund-holding and non-fund-holding patients. Pansiri and Mmereki [25] used SERVQUAL to evaluate the impact of public service reform on the perceived service quality and satisfaction of patients in Botswana's public hospitals and clinics. Karassavidou et al. [26] applied SERVQUAL in evaluating perceived service quality in Greek public hospitals. Its use in the assessment of service quality in the e-governance environment includes Chiabai et al. [27], Orgeron and Goodman [28], and Conolly and Bannister [29].
2. METHODOLOGY
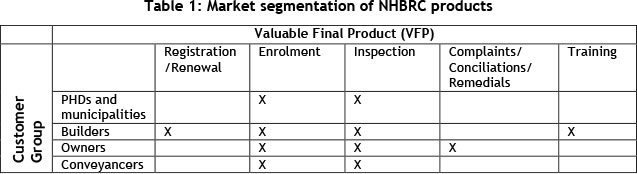
The key clients of NHBRC were first identified. These were derived from the key service products of the NHBRC, and the client groups that receive them. Table 1 summarises the client groups and the main services the NHBRC provides to each client group.
After identifying the client groups, the characteristics and size of each group were used to select the appropriate method of data collection and the target sample size. For the Provincial Housing Departments (PHDs), because the target population is not large and they are more spatially restricted than the other client groups, directly-administered structured questionnaires and interviews were used. This helped to minimise errors of misinterpretation of questions by the respondents. It also helped to collect data from both the provincial offices of the NHBRC and the PHDs simultaneously. For the other geographically dispersed client groups (builders and conveyancers), we used telephone contact to complete a similar set of structured questionnaires. Respondents were selected using stratified random sampling.
The relative sizes of the client segments, based on their provincial distribution, were used to determine the target sample size for each of the client groups and provinces. Based on the experience of a specialised telemarketing institution that partnered with us on the project, power analysis was done, and the minimum target response number for complete telephone interviews was derived at 95 percent confidence level.
2.1 Determination of the sample frame
Spreadsheets containing the details of all the customer groups were collected from the NHBRC, and served as the databases from which samples were randomly drawn. These databases were checked for errors, including incomplete or duplicated customer details, indecipherable customer information, and expired registrations. The cleaned databases constituted the sample frame from which respondents were randomly selected for interviews. The target sample size for each province was then set, assuming a uniform distribution of responses per province based on the numbers per province in the sample frame. The target value for each client category is shown in Table 2. The 'home owners' category was renamed 'complaints', because they are home owners who report dissatisfaction with builders or make complaints for other reasons. For the 'complaints' category, only Gauteng province was able to provide a record of clients, and this was deemed satisfactory by the expert inspectors.
2.2 Development of questionnaires
We had to decide whether to develop a scale that measured only the service quality perception, or one that measured both perception and expectation. Since we wanted to know whether the staff members of NHBRC understand what their clients expect of them, constituting the first gap, we decided to separate expectations from perceptions. But for the categories of clients to be interviewed via the phone, getting them to answer similar questions twice may have reduced the call completion rate. We therefore decided to use separate expectation and perception scales as advocated in SERVQUAL for the PHD client category, and to use only the perception scales as advocated in SERVPERF for the other client categories. The perception responses from all clients were used to measure the NHBRC's performance, and the expectation responses from the NHBRC staff and PHD staff were used to measure gap 1 as defined in the gap model.
The set of questions in the first questionnaire addressed expectations, and was developed by re-phrasing the 22 standard SERVQUAL items in the context of a government regulatory institution. For example, the third question - an item measuring the 'tangibles' dimension -was phrased as: "Employees of an excellent government institution should be neatly and well dressed". A 7-point Likert scale was provided for the rating of these questions, with the instruction that 1 means total disagreement and 7 means total agreement. This was done in the same way for all other items (appendix 1). This first set was administered to both the NHBRC and the PHD staff members to determine the possibility and extent of gap 1.
The second set of questions addressed the perception of actual service received. This was developed by rephrasing the same set of questions in terms of perception. For example, the third item on the SERVQUAL scale was rephrased as "Employees of NHBRC are neatly and well dressed", and a 7-point Likert scale was similarly provided for the respondents to rate this item as in the expectation case. This second set was administered only to the respondents from PHDs.
The questionnaire containing this second set of questions - consisting of SERVQUAL's 22 items written to measure service quality perception, but with a different Likert scale - was then administered to clients via the telephone. Since these client segments were not completing the expectation part separately, we changed the scale to an 11-point Likert scale ranging from -5 to +5, with 0 being the indifference point. The instruction was then changed to "Rate each of the questions between -5 and +5, with -5 meaning completely disagree, +5 meaning completely agree, and 0 meaning indifferent. The other intermediate values should be selected based on your strength of agreement or disagreement".
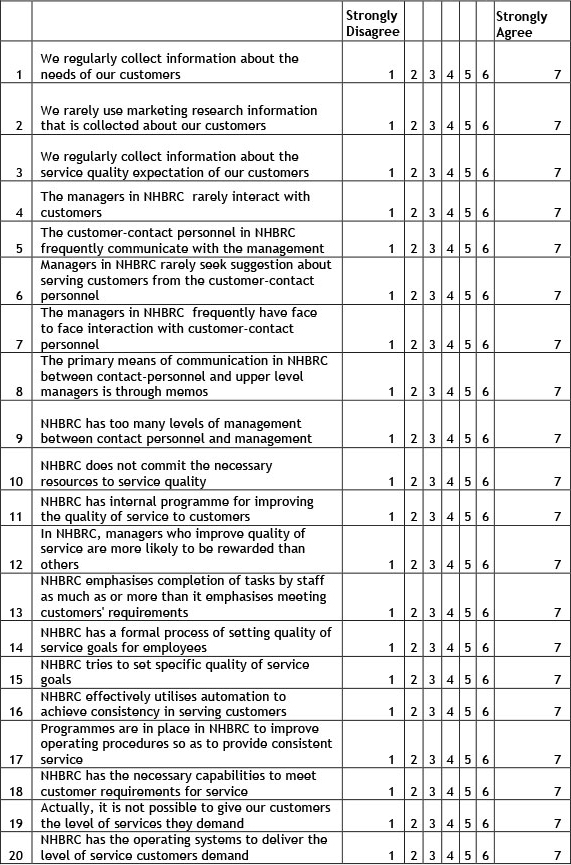
Two other questionnaires, based on Zeithaml et al. [5], were provided to measure the quality standard gap (gap 2) and the service delivery gap (gap 3). These were administered only to the staff of NHBRC, as the focus was strictly on their internal processes (appendices 2 and 3).
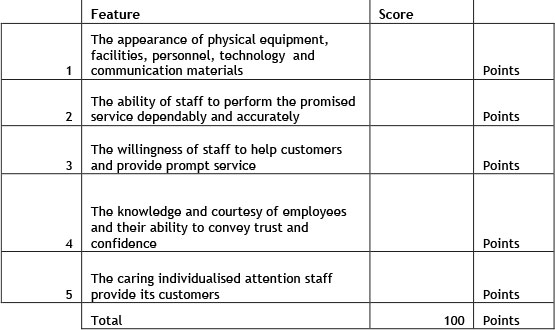
The respondents were asked to rate the relative importance of the five SERVQUAL dimensions by allocating percentages to each dimension, so that the total allocation for five dimensions is 100 (appendix 4).
We reasoned, however, that the quantitative inputs obtained from these questionnaires might not reveal the underlying reasons for discontent, so provision was also made to obtain qualitative inputs from the clients. This was done by including a section for free format comments and opinions in the questionnaire. Two blank pages were provided at the end of the questionnaire with the following instructions: "Write freely what issues constitute the greatest causes of dissatisfaction to you in terms of the services you receive from NHBRC using examples where possible. State why you think the issues have probably not been addressed so far and suggest possible mechanisms to address them". This question was also included in the questionnaire directed at the NHBRC staff to determine whether they have a common knowledge of such problems with their clients. We anticipated that the responses from this section would indicate the root causes of clients' dissatisfaction. The issues raised in this open-ended question were later categorised for comparison with the descriptive summary of the scoring in Likert scales described earlier in this section.
2.3 Training of callers
The last pre-survey activity was the training of the telephone operators. Different scenarios that could occur during a phone interview were listed and used to train the operators on caller response as well as data capturing and representation. Respondents were screened to ensure that they had interacted with NHBRC during the six months prior to the survey. Any item to which the respondent could not answer was captured as 'Don't Know'. Incomplete responses were expunged. Complete responses are those that completed all sections of the questionnaire.
3. ANALYSIS AND RESULTS
Prior to data analysis, the completed questionnaires were screened to check for missing responses. Of the 372 questionnaires completed by the builders' segment, 20 were rejected because of a high incidence of missing responses. The remaining 352 questionnaires in this segment had a very low incidence (less than 2%) of 'Don't Know' responses on the 22 SERVQUAL items. The target and realised sample sizes for each client group are presented in Table 2.
3.1 Analysis of the qualitative feedback
The results of our analysis of the qualitative feedback obtained from the respondents' open-ended comments and complaints are presented first. This is done using responses obtained from the Builders' segment, which constitutes their largest client group. About 38 percent of respondents feel the ratings and weightings have expressed their mind, about 28 percent stated that they are pleased with or commended the NHBRC, while about 34 percent were not pleased with the NHBRC. Seven categories of complaints were created to consolidate similar responses. These are summarised in Table 3. Cluster 7, named 'undefined' (omitted from Table 3), included issues raised by respondents that were outside the scope of the research objectives. Issues classified as 'attitude' are related to not giving the necessary deference to clients; 'communication' relates to lack of responsiveness or inadequate feedback to clients; 'turn around' relates to long cycle times; 'tangibles' relates to office conditions or information system problems; 'reliability' relates to transaction errors; and the last category, named 'others', relates to any other service quality-related issue not in any of the previously defined categories - for example, lack of proper integration between NHBRC and some other government departments to assist clients further, where possible.
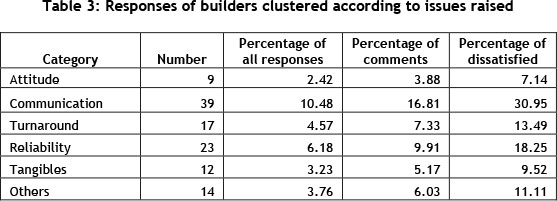
One key observation was that communication is the main issue mentioned in the documented grievances. It was further observed that some of the issues related to reliability, attitude, and turnaround times were also related to communication. Together these three categories constitute about 57 percent of the documented reasons for grievances. The key issue found in communication itself is about providing feedback, and how the feedback was provided. This gives the first important clue about how to please clients: design of an efficient information system to provide timely feedback about the progress made with clients' applications; and to promise only what the organisation can deliver. It is also worth noting that if this qualitative feedback section had not been not included, a significant insight from the research would have been lost, having being lumped together with the other dimensions; the five dimensions of SERVQUAL did not explicitly capture this aspect of provision of regular feedback.
3.2 Analysis of the quantitative feedback
Next, we address the service quality performance of the NHBRC by considering the research problems one by one.
3.2.1 How do the clients perceive the quality of the services offered by the NHBRC?
The four steps for scoring a company, as described in [1], can be summarised as follows:
- compute the average SERVQUAL score for each of the five dimensions;
- multiply the SERVQUAL score for each dimension by the importance weight of the dimension;
- add the weighted SERVQUAL scores across all five dimensions;
- find the average score using the five dimensions' scores.
The average, in percentage points, is shown in Table 4.

The average of the five dimension scores gives the average service quality perception score for each of the NHBRC client groups. This is an unweighted score (i.e. the importance of each dimension was taken as being equal). To obtain the dimension scores, only the service perception scores were used, as advocated in SERVPERF. In order to compare the scores across the different scales used in the administered questionnaires, the average values on the 7-point Likert scale were scaled to one hundred by multiplying them by 10/7 to aggregate all data. The goal should be to have a minimum perception score of 80 percent [1]. The average score for each dimension was calculated as the average across all the client groups. The unweighted score for the NHBRC, calculated as the simple average across all quality dimensions and all client groups (i.e. across all the cells in Table 4), is 63.6 percent.
This unweighted score assumes that all of the service quality dimensions are equally important. But this is not true: the relative importance of each dimension to the clients is given in the weight assigned to each dimension. The average weight out of 100, given to each dimension by each of the client groups based on the SERVQUAL survey, is shown in Table 5. The weight for each dimension was calculated as the arithmetic average across the four client groups.
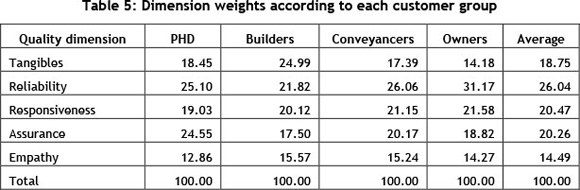
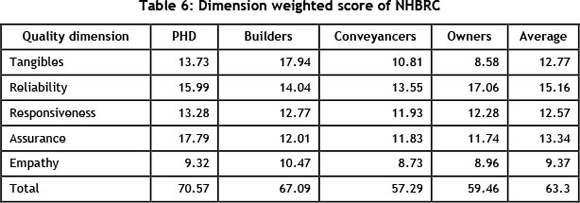
The weighted dimension score was obtained by multiplying the SERVQUAL dimension scores in Table 4 by the average weight attached to that dimension by each customer group in Table 5. For example, to determine the weighted score for PHD, 74.4 was multiplied by 18.45/100 to get 13.73. This was done across every dimension. The weighted score for each dimension was then added together to get a weighted score of 70.57 for PHD.
Based on their experience, Zeithaml et al. [1] stated that for any service provider to make customer service a competitive tool, and for their customers to become their apostles, they need a minimum score of 80. This means that the NHBRC has an aggregate gap of about 17 percent. The benchmark standard may, however, not need to be this high for a government organisation, since customer expectations of a corporate organisation are usually higher than those of a government institution; and this standard was set in the context of corporate organisations.
3.2.2 In what does the NHBRC seem not to be performing well?
To identify the key areas of improvement for the NHBRC, a gap analysis was done on an item-by-item basis for the 22 items on SERVQUAL scale, and then summarised at a dimension level. For the first dimension, tangibles, the gap for the related items ranges from as low as 0.3 percent for dressing, to as high as 10.6 for technology deployment. The same pattern has been observed in the qualitative survey: the most important service issues raised, which were related to the tangibles dimension, were system down time and restricted mode of payment, both being ICT-related issues. The average gap score for the tangibles dimension was 5.9 percent. This dimension had the smallest gap. The reliability group average gap score was the highest at 16.6 points, followed by responsiveness at 16.2 points. Assurance and empathy were at group average gap scores of 13.5 and 11.2 points respectively.
This implies that the NHBRC has to focus its quality improvement efforts on process accuracy and response cycle time. The insights gained from the qualitative responses indicate that if the NHBRC could manage their feedback system more effectively to complement whatever they do to improve reliability and responsiveness, this may greatly improve clients' service quality perceptions.
3.2.3 What are the key factors driving these performance gaps?
To understand the possible causes of gaps in service delivery, we decided to investigate the NHBRC's understanding of client needs, specification of service quality standard, achievement of quality standards through internal processes, or some combination of these as discussed in the gaps model of service quality.
To check the NHBRC's understanding of the needs of their clients, we administered the same SERVQUAL questionnaires to NHBRC staff members to determine their perceptions of the expectations of their clients and their perceptions of the relative importance of the five service quality dimensions. We computed the average scores for the NHBRC staff members' perception of clients' expectations, and also for the weights attached to each of the five dimensions by the NHBRC staff members. We then performed a multivariate analysis of variance (MANOVA) on the average scores computed for the NHBRC staff members' perceived clients' expectation, and the actual average expectations scores computed earlier from the clients' data. MANOVA was also done on the weight attached to each dimension by the NHBRC staff members, and the weight attached to each dimension by the PHD staff members. The null and alternative hypotheses were set up as:
H0: There is no difference between NHBRC staff's perceived customer service expectation and actual customer service expectation.
H1: There is a difference between NHBRC staff's perceived customer service expectation and actual customer service expectation.
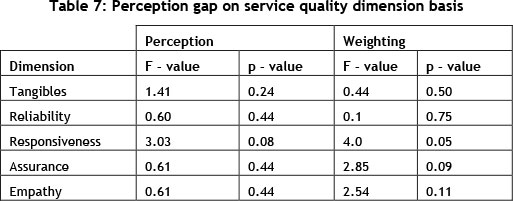
The result is presented in Table 7, where it may be seen that the actual expectations of the clients and the perceived expectation of clients by the NHBRC staff members are not significantly different at a 5 percent level of significance. The perception of the importance of each dimension as expressed in the weight attached to each dimension, however, appears to be significantly different only in terms of how important 'responsiveness' is perceived to be. It should also be noted that only the p-value of responsiveness is close to 5 percent, while those of the other dimensions are at least 24 percent. This suggests that 'responsiveness' seems to be the only dimension whose importance is underestimated by the NHBRC staff members. This also supports the deductions from the issues raised in the earlier comments of the clients.
The effects of service quality specification and the execution gaps were investigated through the other two sets of questionnaires adapted from some templates provided in Zeithaml et al. [1], and customised for this research. They were targeted at the staff of NHBRC, and the goal was to understand some of the factors driving standard specification, process execution, and customer value proposition gaps. These questionnaires are shown in appendices 2 and 3. The need for integrated KPI development and robust organisation-wide communication channels was found during analysis.
3.2.4 Do the service quality perceptions of the NHBRC's diverse client groups converge?
To address the level of concurrence of opinion amongst the different categories of NHBRC clients, we calculated an overall service quality perception score for each client segment by averaging respondents' answers across the 22 SERVQUAL items. The correlation matrix is presented in Table 8. The correlation test is set up as:
H0 : Actual correlation between items = 0
H1 : Actual correlation between items ≠ 0
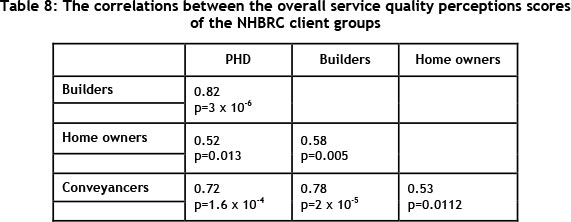
It can be seen that all p values are less than 5 percent, suggesting that all the correlations are statistically significant, and implying some form of agreement about the scoring of the items on the questionnaire.
3.2.5 Do the responses from the NHBRC clients support SERVQUAL's factor structure?
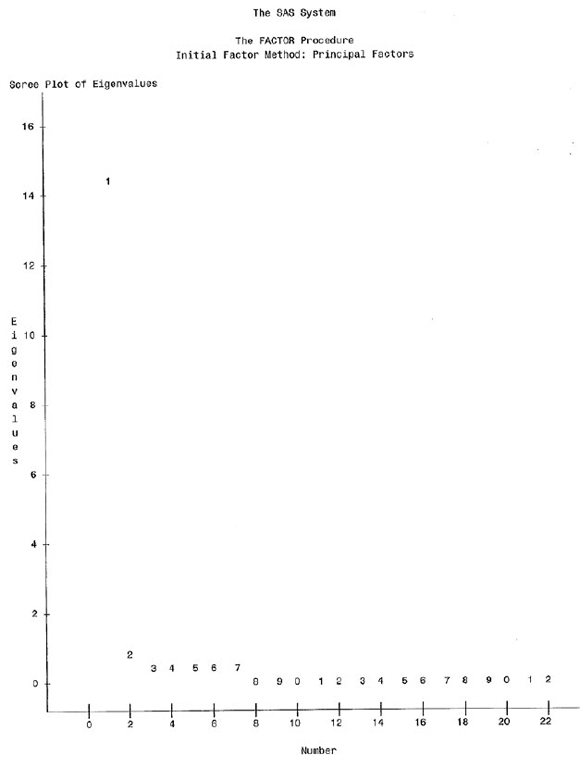
The last issue addressed was the determination of the number of key service quality dimensions that the NHBRC clients' responses suggest. Based on several criticisms, we re-examined the factor structure of the SERVQUAL scale, based on the data collected. The responses to the 22-item questionnaire were subjected to an exploratory factor analysis using SAS. Data from 223 complete data records were included in the analysis. Principal axis factoring was used for factor extraction, with the loading set to 0.4 based on the recommendations of Hatcher [31]. The output was analysed using the eigenvalue larger than one rule, with the scree plot and the proportion of variance accounted for. The eigenvalue of the first extracted factor was 14.44, while those of all other factors were less than one. The scree plot (appendix 5) shows the first factor standing out at the top of the plot, clearly separate from all the other extracted factors, with the rest appearing as almost a straight line at the bottom. The first factor alone accounted for about 85 percent of the total variance, which is more than the recommended 70 percent for factors retained for rotation [31]. Also, all items loaded exclusively on factor 1 - with the exception of item 19, which loaded on items 1 and 2. This suggests a single-factor structure in contrast to the five-factor structure originally proposed for the SERVQUAL scale.
To extract the rotated factor pattern and structure matrices, we needed to retain more than a single factor, since a single factor model cannot be rotated. A five-factor structure was initially assumed based on the SERVQUAL model. A Varimax rotation of five retained factors yielded no useful factor pattern because all the items, except for items 6 and 17, loaded on more than one factor, and they violated all interpretability criteria. This problem could have been caused by the orthogonality of Varimax rotation, since the factors are most likely correlated. A Promax rotation was done next with the five-factor structure. The resulting factor pattern, however, still violated the interpretability criteria, while the factor structure confirmed the high level of inter-factor correlation ranging from 0.39 to 0.65. Smaller numbers of retained factors were then investigated.
Retaining and rotating two factors produced an improved factor pattern that largely met all interpretability criteria, with items 1, 5-8, 10-16, 18, 21, and 22 loading exclusively on factor 1, and items 2-4, 9, 17, and 20 loading exclusively on factor 2. This suggests a two-factor structure with items related to SERVQUAL's reliability, responsiveness, and assurance dimensions loading on factor 1, its items related to the tangibles dimension loading on factor 2, while the items related to the empathy dimension seem to have been subsumed in the two factors. The correlation between the two factors was 0.72. Retaining and rotating three factors also produced a good factor pattern that loads items 1, 4, 14, 15-17, and 2022 on factor 1, items 5-8 and 10-13 are loaded on factor 2, and items 2, 3, 9, and 19 on factor 3. Applying interpretability criteria also suggests a two-factor structure with items related to SERVQUAL's assurance and empathy dimensions loading on factor 1, and its items related to reliability and responsiveness dimensions loading on factor 2. Factor 3 does not have sufficient reasonably related items loaded on it to meet the interpretability criteria, while items related to the tangibles dimension seem to have been subsumed in the other two factors. The correlations between the three factors range from 0.61 to 0.72. One could conclude, therefore, that the loading patterns of rotated factors suggest a two-factor structure, which is in contrast to the five-factor structure proposed by SERVQUAL's developers. The result seems to corroborate the claim of a number of authors that the five-factor structure of SERVQUAL is not stable. But the solace is in the argument that the inter-item reliability is high, thus reasonably enabling us to trust the conclusion from the SERVQUAL scale used.
The fact that we were not able to confirm the five-factor model of SERVQUAL in this study should not, however, detract from the usefulness of the SERVQUAL scale, because the use of its items in developing a different factor structure shows the value of the scale itself. It would, however, be recommended that a further study be conducted using the two-factor structure derived in this study to investigate the stability of the two-factor model. This would imply retaining the SERVQUAL scale items, but restructuring the model's factor structure.
4. CONCLUSION
The study set out to investigate clients' perception of the quality of service offered by the NHBRC, and to identify the possible gaps in the NHBRC service delivery and the underlying factors causing these gaps. The opinions of the client groups seem to converge in their evaluations of the organisation, and the importance of timely and relevant feedback to customers was identified. In addition to the insights provided by the numeric data from the SERVQUAL instrument, qualitative data was used to identify further the causes of the service delivery gaps identified in the study. An examination of the factor pattern of the SERVQUAL responses indicates a two-factor structure, which is a clear departure from the original five-factor structure identified by the developers of the SERVQUAL scale. It was recommended that this study should be repeated with a two-factor structure to confirm the stability of the two-factor structure. Also, the use of a modified SERVQUAL scale - by the removal of items that do not load properly on any of the factors identified in the two-factor structure realised in this research - should be investigated for possible improvement in the reliability of the modified scale.
5. ACKNOWLEDGEMENT
The authors acknowledge the financial support of NRF and RDP, and the very insightful comments made by the anonymous reviewer. We also thank Prof K. Adendorff for language editing of the article.
REFERENCES
[1] Zeithmal, V.A., Parasuraman, A. and Berry, L.L. 1990. Delivering quality service: Balancing customer perceptions and expectations. Free Press, Macmillan Inc. [ Links ]
[2] Ladhari, R. 2008. Alternative measures of service quality: A review. Managing Service Quality, 18(1), 65-86. [ Links ]
[3] Van Dyke, T.P., Prybutok, V.R. and Kappelman, L.A. 1999. Cautions on the use of SERVQUAL measure to assess the quality of information systems services. Decision Sciences, 30(3), 877 891. [ Links ]
[4] Cronin, J.J. and Taylor, S.A. 1992. Measuring service quality: A re-examination and extension. Journal of Marketing, 56, 55-68. [ Links ]
[5] Teas, R.K. 1993. Expectations, performance evaluation and consumer perceptions of quality. Journal of Marketing, 57(4), 18-34. [ Links ]
[6] Teas, R.K. 1994. Expectations as a comparison standard in measuring service quality: An assessment of a reassessment. Journal of Marketing, 58(1), 132-139. [ Links ]
[7] Carman, J.M. 1990. Consumer perceptions of service quality: An assessment of the SERVQUAL dimensions. Journal of Retailing, 66(1), 33-35. [ Links ]
[8] Brady, M. and Cronin, J. 2001. Some new thoughts on conceptualising perceived service quality: A hierarchical approach. Journal of Marketing, 65(3), 34-49. [ Links ]
[9] Wilkins, H., Merrilees, B. and Herington, C. 2007. Towards an understanding of total quality service in hotels. International Journal of Hospitality Management, 26(4), 840-853. [ Links ]
[10] Lam, S.S.K. 1997. SERVQUAL, a tool for measuring patients' opinions of hospital service quality in Hong Kong. Tourism Management, 8(4), 145-152. [ Links ]
[11] Parasuraman, A., Zeithaml, V.A. and Berry, L.L. 1985. A conceptual model of service quality and its implications for future research. Journal of Marketing, 9(4), 41-50. [ Links ]
[12] Parasuraman, A., Zeithaml, V.A. and Berry, L.L. 1988. SERVQUAL: A multiple-item scale for measuring consumer perceptions of service quality. Journal of Retailing, 64(1), 12-40. [ Links ]
[13] Parasuraman, A., Zeithaml, V.A. and Berry, L.L. 1991. Refinement and reassessment of the SERVQUAL scale. Journal of Retailing, 67(4), 420-450. [ Links ]
[14] Kwok, W.C.C. and Sharp, D.J. 1998. A review of construct measurement issues in behavioura accounting research. Journal of Accounting Literature, 17, 137-174. [ Links ]
[15] Udo, G.J., Bagchi, K.K and Kirs, P.J. 2011. Using SERVQUAL to assess the quality of E-learning. Computers and Human Behaviour, 27(3), 1272-1283. [ Links ]
[16] Wilson, N., Hall, T. and Fields, D. 2011. Measuring retail service quality in farm cooperative. International Food and Agric Business Management Review, 14(1), 1-22. [ Links ]
[17] Shekarchizadeh, A., Rasli, A. and Hon-Tat, H. 2011. SERVQUAL in Malaysian universities: Perspectives of international students. Business Process Management, 17(1), 67-81. [ Links ]
[18] McDougalla, G.H.G. and Levesque, T.J. 1995. A revised view of service quality dimensions: An empirical investigation. Journal of Professional Services Marketing, 11(1). [ Links ]
[19] Lee-Ross, D. 2008. An exploratory study of the contextual stability of SERVQUAL amongst three retail clusters in far North Queensland. Journal of Place Management and Development, 1(1), 46-61. [ Links ]
[20] Miller, R.E., Hardgrave, B.C. and Jones, T.W. 2011. SERVQUAL dimensionality: An investigation of presentation order effect. International Journal of Services and Standards, 7(1), 1-17. [ Links ]
[21] Asubonteng, P., Mccleary, K.J. and Swan, J.E. 1996. Servqual revisited: A critical review of service quality. The Journal of Marketing Services, 10(6), 62-81. [ Links ]
[22] Wisniewski, M. and Donnelly, M. 1996. Measuring service quality in the public sector: The potential for SERVQUAL. Total Quality Management, 7(4), 357-365. [ Links ]
[23] Wisniewski, M. 2001. Assessing customer satisfaction with local authority services using SERVQUAL. Total Quality Management, 12(7), 995-1002. [ Links ]
[24] Sargeant, A. and Kaehler, J. 1998. Factors of patient satisfaction with medical services: The case of G.P. practices in the U.K. Health Marketing Quarterly, 16(1), 55-77. [ Links ]
[25] Pansiri, J. and Mmereki, R.N. 2010. Using the SERVQUAL model to evaluate the impact of public service reforms in the provision of primary health care in Botswana. Journal of African Business, 11(2), 219-234. [ Links ]
[26] Karassavidou, E., Glaveli, N. and Papadopoulos, C.T. 2000. Quality in NHS hospitals: No one knows better than patients. Measuring Business Excellence, 13(1), 34-46. [ Links ]
[27] Chiabai, A., Rocca, L. and Chiarullo, L. 2011. A service quality model for web-services evaluation in cultural heritage management. Lecture Notes in Computer Science (including subseries lecture notes in Artificial Intelligence and lecture notes in Bioinformatics) 6783 LNCS (PART 2), 227-242. [ Links ]
[28] Orgeron, C.P. and Goodman, D. 2011. Evaluating citizen adoption and satisfaction of e-government. International Journal of Electronic Government Research, 7(3), 57-78. [ Links ]
[29] Connolly, R. and Bannister, F. 2010. Government eTax systems: Factors influencing citizen adoption. Fourth International Conference on Research Challenges in Information Science - Proceedings (5507366), 79-84. [ Links ]
[30] Buttle F. 1996. SERVQUAL: Review, critique, research agenda. European Journal of Marketing, 30(1), 8-32. [ Links ]
[31] Hatcher, F. 1994. A step by step approach to using the SAS system for factor analysis and structural equation modelling. SAS Institute, Cary, NC. [ Links ]
[32] Langley, C.J. , Coyle, J.J., Gibson, B.J., Novack, R.A. and Bardi, E.J. 2009. Managing supply chains: A logistics approach, 8th edition. South-Western, Cengage Learning. [ Links ]
[33] Shostack, G.L. 1984. Service design in the operating environment, in George, W.R. and Marshall, C. (eds), Developing New Services, American Marketing Association, Chicago, IL, 27-43. [ Links ]
APPENDIX 1: SERVQUAL EXPECTATION QUESTIONS FOR NHBRC
This questionnaire is designed to help us to understand what factors make you to perceive a service offering as excellent in a good government establishment in general and at NHBRC in particular. This has nothing to do with how you are actually served, but only about your expectations.
While answering this questionnaire, we would want you to think about the various government service products that you have purchased, be it at the national, provincial or municipality level. With this in mind, we want you to think of what different service characteristics would make you to consider a government institution as an excellent service provider.
Based on your experience as a consumer of various government services, please think about the kind of government institution that would deliver an excellent quality of service. Think about the kind of government institution which you would be pleased to do business at. Please show the extent to which you think such a government institution would possess the features described by each statement. If you feel a feature is not at all essential for an excellent government institution to deliver an excellent service to its clients, circle the number 1. If you feel a feature is absolutely essential for an excellent government institution to deliver an excellent service to its clients, circle 7. If your feeling is less strong, circle one of the numbers in the middle. There are no right or wrong answers. All we are interested in is the number that truly reflects your feelings regarding what you feel is government institution that would deliver excellent quality of service to you.
APPENDIX 2: QUESTIONNAIRE TO ASSESS QUALITY STANDARD GAP
As a staff of NHBRC, listed below are a number of statements to measure your perception of NHBRC and its operations. Please indicate the extent to which you disagree or agree with each statement by circling one of the seven numbers next to each statement. If you strongly disagree, circle 1, if you strongly agree, circle 7. If your feelings are not strong, circle one of the numbers in the middle. There are no right or wrong answers. Please indicate honestly how you feel.
APPENDIX 3: QUESTIONNAIRE TO ASSESS PERFORMANCE (EXECUTION) GAP
As a staff of NHBRC, listed below are a number of statements to measure your perception about NHBRC and its operations. Please indicate the extent to which you disagree or agree with each statement by circling one of the seven numbers next to each statement. If you strongly disagree, circle 1, if you strongly agree, circle 7. If your feelings are not strong, circle one of the numbers in the middle. There are no right or wrong answers. Please indicate honestly how you feel.

APPENDIX 4: DIMENSION WEIGHTS OF SERVQUAL
Listed below are five features pertaining to how we believe the services of an excellent government institution can be perceived and evaluated. We would like to know how important you feel each of these features is to your customers when they evaluate NHBRC's quality of service. Please allocate a total of 100 points among the five features according to how important you believe each feature is to them. The more important a feature is to you, the more point you should allocate to it. Please ensure that the points you allocate to the five features add up to 100.
APPENDIX 5: EXTRACTED FACTORS' SCREE PLOT

