Services on Demand
Article
 English (pdf)
 Article in xml format
 Article references
Indicators

Related links
-
 Cited by Google
 -
 Similars in Google
Share

 Permalink
South African Journal of Industrial Engineering
On-line version ISSN 2224-7890
Print version ISSN 1012-277X
S. Afr. J. Ind. Eng. vol.23 n.2 Pretoria Jan. 2012
CASE STUDIES
Physical modelling of terrain directly from surfer grid and ARC/INFO ASCII data formats#
Y.K. ModiI, *; D.J. de BeerII; S. AgrawalIII
IDeparment of Mechanical Engineering Jaypee University of Engineering and Technology, M.P., India. yashwant.modi@juet.ac.in
IITechnology Transfer and Innovation Directorate Vaal University of Technology, South Africa ddebeer@iclix.co.za
IIIDeparment of Mechanical Engineering Jaypee University of Engineering and Technology, M.P., India. sanat.agrawal@juet.ac.in
ABSTRACT
Additive manufacturing technology is used to make physical models of terrain using GIS surface data. Attempts have been made to understand several other GIS file formats, such as the Surfer grid and the ARC/INFO ASCII grid. The surface of the terrain in these file formats has been converted into an STL file format that is suitable for additive manufacturing. The STL surface is converted into a 3D model by making the walls and the base. In this paper, the terrain modelling work has been extended to several other widely-used GIS file formats. Terrain models can be created in less time and at less cost, and intricate geometries of terrain can be created with ease and great accuracy.
OPSOMMING
Laagvervaardigingstegnologie word gebruik om fisiese modelle van terreine vanaf GIS oppervlakdata te maak. Daar is gepoog om verskeie ander GIS lêerformate, soos die Surfer rooster en die ARC/INFO ASCII rooster, te verstaan. Die oppervlak van die terrein in hierdie lêerformate is omgeskakel in 'n STL lêerformaat wat geskik is vir laagvervaardiging. Verder is die STL oppervlak omgeskakel in 'n 3D model deur die kante en die basis te modelleer. In hierdie artikel is die terreinmodelleringswerk uitgebrei na verskeie ander algemeen gebruikte GIS lêerformate. Terreinmodelle kan so geskep word in korter tyd en teen laer koste, terwyl komplekse geometrieë van terreine met gemak en groot akkuraatheid geskep kan word.
1. INTRODUCTION
The data of a terrain represents a surface. There are several GIS data formats in which the data of a terrain is available. However, it contains just points on the terrain surface, and does not include 3D information.
Many applications require a physical model of a terrain. Some of these applications are catchment modelling, town planning, landscape architecture, conservation management, and military strategy planning. A terrain model helps with visualisation, presentation, and community education, and serves as a very effective tool for watershed and geological education.
Additive manufacturing (AM) makes models and prototypes in less time and at less cost than conventional prototyping techniques. The AM process can even make complicated parts in a matter of hours. It takes the solid model of a part as its input, and fabricates the part layer by layer without using tools or fixtures. A model can be made out of ABS (acrylonitrile butadiene styrene, a tough plastic), polycarbonates, nylon, sand, metal, etc. Intricate geometries of terrain can be reproduced easily and more accurately using the AM process.
The file format available for additive manufacturing is STL. The GIS data of a terrain needs to be translated into STL for additive manufacturing, so that the STL file can be downloaded to an AM machine for pre-processing and fabrication.
Researchers have used different methods to make a physical model of a terrain with AM using GIS data. Most of them have used commercial software and several translation steps to convert the surface data into 3D STL parts. Rase [18] converted GIS data into VRML format using his program; but he did not discuss the GIS file format used. Jacobs [15] converted the GIS data into DXF file format using Land Desktop; the DXF file is then converted into an STL part using Magics RP software. Mueller [16] made terrain models with AM technology using SDTS data. He used a meshing algorithm, such as Greeds insertion, to get a mesh from an elevation grid. The mesh data was then translated into STL and PLY format. Bailey [3] created physical models of the October 2003 fires in Southern California, using US maps based on satellite data. However, the author did not specify the data format he used as input. Agrawal et al. [1] converted DEM ASCII XYZ data into the STL file format using Global Mapper. This STL surface was then imported into Magics RP to obtain a 3D part.
Colour 3D Printer from Z Corporation is the first AM process to incorporate the ability to print a full-colour part [11, 21]. AM technology has also been used to fabricate architectural models [12, 7]. Campbell et al. [4] have reviewed the use of AM technology for terrain modelling, architectural modelling, and other applications in South Africa.
Franic et al. [8] have provided a way to make a physical model of a city using a digital terrain model (DTM), photogrammetric mapping, and true orthophoto as input data. They made a model of the city of Zagreb in Croatia. Rase [19] has reported building coloured physical models of a city and a landscape with relief. He also made physical models to represent demographic and socio-economic data. A continuous surface for representing the demographic data was obtained by interpolating points or polygon data using the pycnophylactic interpolation method. He used ESRI ArcGIS software to prepare the basic data, and his own computer program for interpolation.
The methods used by the above researchers for terrain modelling involved several software tools. They obtained a 3D STL part in several steps: the methods were not direct, and data loss took place when translating to intermediate file formats. Several commercial software programs exist to translate GIS data into STL format [9, 14]. However, none of them translates directly to a 3D STL file: they produce an STL surface. Agrawal et al. [2] developed a way to convert DEM ASCII XYZ data directly to a 3D STL part, and made a software tool for the conversion.
In the present research, the work of Agrawal et al. [2] has been extended to other widely-used data formats. The software issue in converting DEM ASCII XYZ data of a size larger than 90x100 has been taken care of. The ARC/INFO ASCII data format is the same as the DEM ASCII XYZ data format. Functions have been written into the program to convert the Surfer grid file format. The method developed by Agrawal et al. has been used to make the triangles in the top surface, walls, and base of the 3D STL part. In Surfer grid format, the missing elevation values in the grid are not explicitly specified; so a way has been developed to identify the missing elevation values in the grid. 3D STL parts have been obtained for sample Surfer grid files, and loaded successfully in Pro/E for display.
2. ARC/ INFO ASCII AND DEM ASCII XYZ DATA FORMATS
The ARC/INFO ASCII data format is used by ARC/INFO, a GIS program by ESRI Corporation; the file uses the extensions ASC, FIG, AGR, or GRD. The ARC/INFO ASCII data format is the same as the DEM ASCII XYZ data format, translated into 3D STL parts by Agrawal et al. [2]. This format has a header consisting of six records: these specify the geographic domain and resolution, then the elevation values of grid cells. The elevation values are given in a grid of size nrows x ncols in both data formats.
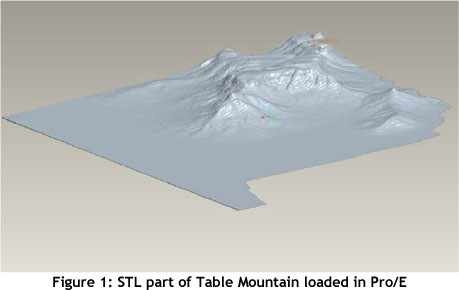
Work on the DEM ASCII XYZ data was extended to incorporate a large amount of data. Turbo C++ software, with the set of parameters used, was not able to handle DEM data larger than 90x100. The same C program was compiled and executed in Visual C++, and it could run successfully in Visual C++ with a larger file size. The program was used to translate the DEM data of Table Mountain, the Swartberg Mountain range, the Welbedacht region, and Naval Hill in Bloemfontein, South Africa into 3D STL parts. The data size ranged from 400x400 to 1200x1200. The size of the STL files ranged from 60 MB to 740 MB. A solid modeller like Pro/E successfully opened moderate-sized files, such as that of Table Mountain. However, it had memory issues when opening STL files of 700 MB with the current set of environment variables. Parameters such as proe_memory_buffer_size needed to be altered to avoid 'memory error'. This is being explored.
Figure 1 shows the STL file of Table Mountain in Cape Town, South Africa loaded in Pro/E. The DEM ASCII XYZ data of Table Mountain has only the data of the terrain surface. This terrain data was converted into an STL surface; the walls and base were added to it, and the 3D STL part of Table Mountain shown here was obtained.
3. SURFER GRID FILE FORMAT
Surfer grid is a widely-used GIS file format, and is extensively used by surface gridding and contouring programs in the earth sciences. The Surfer grid data format is as follows:
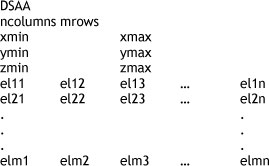
The file format consists of a header followed by a grid of elevation values [20, 17]. There is a data format identifier in the first line of the header. (DSAA stands for Data in Surfer grid ASCII format, and DSBB stands for Data in Surfer grid binary format). It is followed by the number of columns and rows of points in the grid. The third line contains the minimum and maximum values of x-coordinates in the grid. The next line contains the minimum and maximum values of the y-coordinates. The cells are regularly spaced in the x-direction and the y-direction. The cell size in x- and y-directions is calculated from their minimum and maximum values. This is different from the DEM ASCII XYZ format, where the cell size is explicitly given.
The fifth and last line of the header contains the minimum and maximum values of elevation in the grid. The DEM ASCII XYZ format gives the NODATA_value in the header. It corresponds to data that is missing in the grid. In Surfer grid format, the NODATA_value is not explicitly specified in the header.
The Surfer grid format is interpreted for missing data as follows. Any value beyond the range of minimum and maximum elevation values is considered to be missing data. For example, a very high elevation value of 1.6025E+038 meters in the data for a terrain on earth is considered to be missing data. Geospatial Designs and Global Mapper also discuss the Surfer grid data format [10, 13].
There are missing data in the elevation grid due to inherent inaccuracies in remote sensing or surveying methods that are used to obtain the data. They also depend on the ground planimetric reference system used, such as UTM, geographic, or the state plane coordinate system. A quadrangle of neat lines, or a block, has profiles with an unequal number of elevation values.
In order to find missing data values in the elevation grid, the C program scans all the cells in the grid. A constant NODATA_value with a large negative integer value is declared. Those cells in the grid that have elevation values beyond the range of minimum and maximum values are assigned a NODATA_value. This is similar to the NODATA_value already present in the DEM ASCII XYZ data.
The minimum elevation value is directly available in Surfer grid format, as discussed earlier. This value therefore need not be computed to calculate the base of the STL part, as is done for DEM ASCII XYZ data. The base of the STL part is computed by subtracting the required wall height from the minimum elevation value. The intervals in x- and y-directions are different, and are computed from the values in the header.
The first row of elevation values that follows the header of the file represents the southern edge of the grid, in contrast to the DEM ASCII XYZ data where it is the northern edge [20]. This is another major deviation from the DEM ASCII XYZ format.
The input Surfer grid data file is read by the C program. The elevation values are read in a matrix, and the differences above are taken care of. The data is translated in a manner similar to that for DEM ASCII data [2]. A 3D STL part of a terrain is made by making triangles for two consecutive rows or columns at a time, as discussed by Agrawal et al. [2]. If the STL part is built by proceeding along the x-direction, the triangles are built for two consecutive rows, as shown in Figure 2. For two consecutive rows, the triangles on the top represent the surface of the terrain. The left wall, the right wall, and the base are made. The front and rear walls are made only for the portion needed.
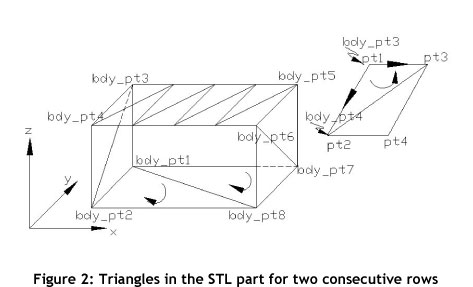
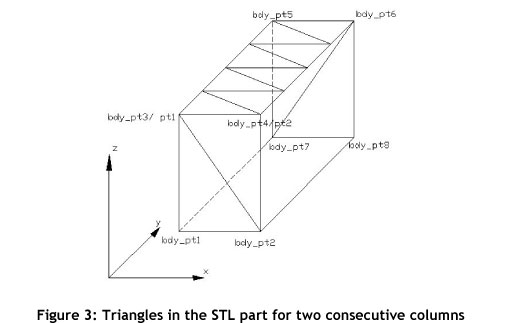
Figure 3 shows the triangles made for two consecutive columns when the STL part is built by proceeding in the y-direction.
If the Surfer grid represents 2D solids separated by rows, the part is built by proceeding in the x-direction after removing singularities. However, if it represents 2D solids separated by columns, the part is built by proceeding in the y-direction. If the data has a gap inside it, and the user input is affirmative for interpolation, the data is interpolated and the part is built in the x-direction. If the user does not want to interpolate, then an STL part cannot be built in the event of a gap; so an STL surface is made in this case. This can have visual value, and the user may like to run the program again with interpolation.
The C program was run for sample Surfer grid data. The program successfully converted the surface data into 3D STL parts. Consider the Surfer grid file SS1.GRD with four elevation values, each equal to 30.0.
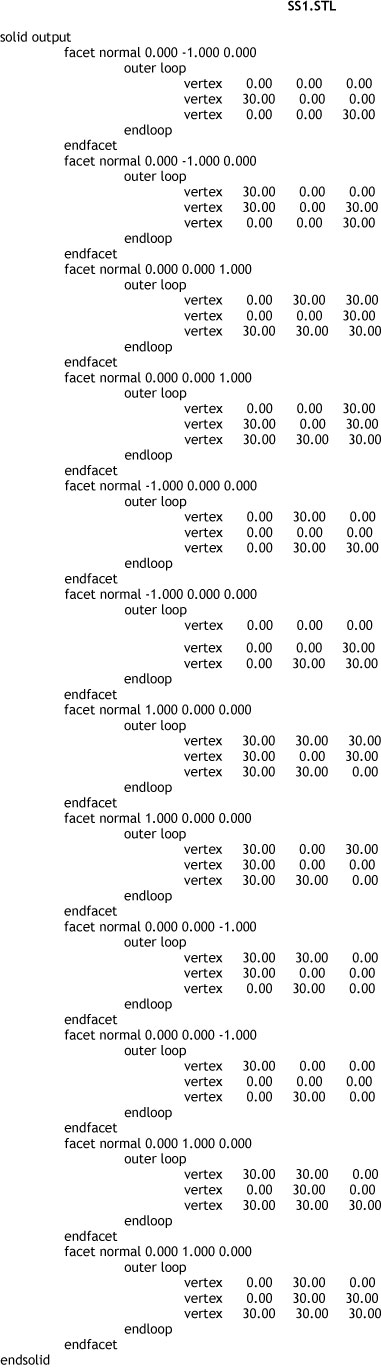
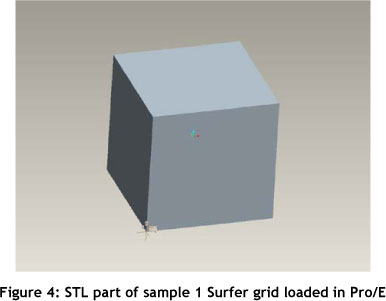
The data has two columns and two rows. The cell size is 30. The minimum and maximum elevation values are 30. The STL part is made with a wall height of 30. This gives a cube with sides of 30, and having a central diagonal with opposite ends at (0, 0, 0) and (30, 30, 30). Figure 4 shows the STL part of the sample data in Surfer grid format. This Surfer grid file is converted to an STL file called 'SS1 .STL'. The cube has six faces, each made with two triangular facets in the STL file. Therefore, there should be 12 facets in the STL file. The STL file SS1 .STL is as follows:
As can be seen, the STL file has 12 facets. It is also apparent that the vertices of the triangles are one of the vertices of the cube with the central diagonal having opposite ends at (0, 0, 0) and (30, 30, 30). Therefore, the data is being converted accurately without any loss in translation. The x-coordinate, y-coordinate, and the elevation values from the Surfer grid file are used directly to make the vertices of the triangle. There is therefore no data loss in conversion. The STL file obtained for a terrain model in cube form also shows this.
Figure 5 shows the STL part obtained after the conversion of sample 2 of the Surfer grid data. This also has four elevation values. However, the four elevation values are not equal.
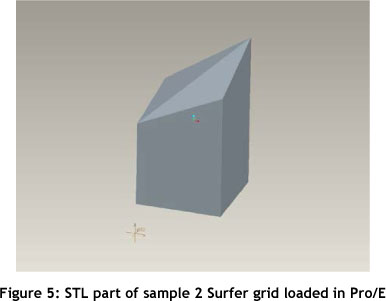
Figure 6 shows the STL part for sample 3 of the Surfer grid data called 'SS3.GRD'. A typical example is created here with several no-data values. The shape of the valid data values is correctly produced The STL file verifies that the elevation values go directly into the vertices of the triangles. It should be noted while viewing the STL part in Figure 6 that the first row of elevation values in SS3.GRD goes to the front of the STL part.
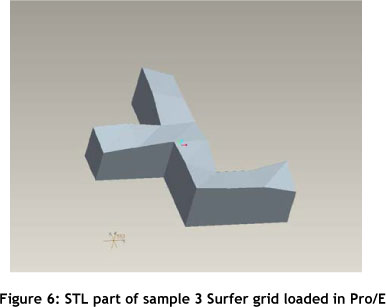
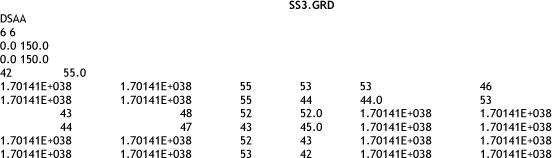
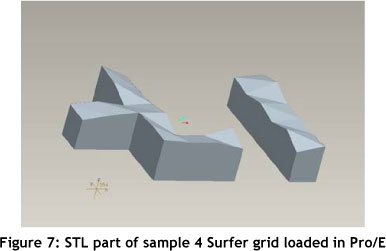
Figure 7 shows the STL part of sample 4 of the Surfer grid data. Here there were gaps between valid elevation values in the x-direction. The C program correctly made the STL part by proceeding in a y-direction.
When viewed, the STL part verifies that the conversion is accurate. Thedimensions were verified in the Pro/E software. However, scales or dimensions could not be shown in the Figures. The accuracy of the conversion is verified by observing the coordinates of vertices of triangles in the STL file (e.g., SS1.STL, given earlier).
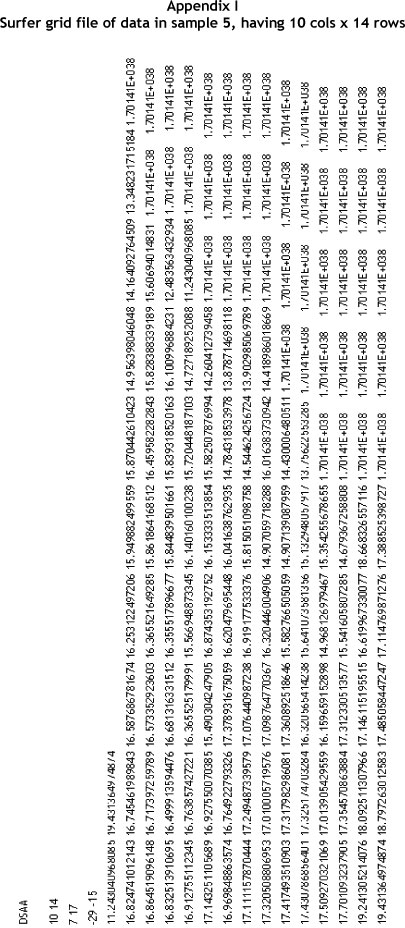
Figure 8 shows the STL part of sample 5 in Surfer grid format. The data has 10 columns and 14 rows. The grid values lie in the range (min = 11.2, max = 19.4). The Surfer grid data is shown in Appendix I. There are many no-data values in the data. The data value that lies beyond the range (11.2, 19.4) is a no-data value. Therefore 1.70141E+038 in the data is a no-data value. The front face in Figure 8 represents the first row with nine valid data values, while the rear face of the STL part in Figure 8 shows the 14th row having five valid data values. Due to the presence of no-data values, the base of the 10 cols x 14 rows data is not a rectangle.
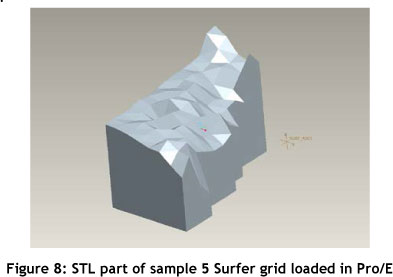
Figure 9 shows the STL part of sample 6 Surfer grid data. The data has 11 columns and 18 rows, and elevation values are in the range min = -1.00, max = 0.98. The terrain has several peaks and steep slopes.
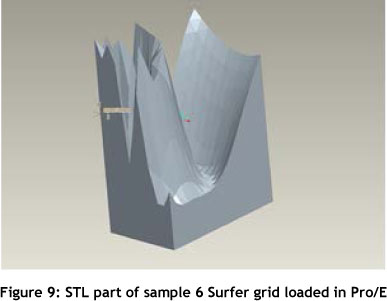
The data contained in Figures 8 and 9 are just sample data. The program is able to take care of the Surfer grid of any terrain with a large grid, as was done with the DEM ASCII XYZ data.
4. FUTURE SCOPE
Sometimes the size of the STL file becomes very large. For example, for an elevation grid of 1200x1400, the number of triangles is around 3.2 million. The user may want to have the option to decrease the number of triangles and have a smaller STL file - for example, when accuracy is not important and the AM part is needed mainly for visualisation purposes. A smaller STL file will decrease the pre-processing and part-building time in AM. One way to decrease the number of triangles could be to fit a curve on each row of the grid, and to find elevation values on this curve at a larger interval.
The authors also plan to investigate the memory error in Pro/E by altering the parameters such as proe_memory_buffer_size, and then loading large STL files. The authors plan to extend this work to include other widely-used GIS data formats such as USGS DEM data.
5. CONCLUSIONS
A method has been developed to convert the data of a terrain in Surfer grid format to a 3D STL part. Functions have been added and modified in the C program. Sample Surfer grids have been taken, and the conversion has been verified. The 3D STL parts were loaded in Pro/E for visualisation. A software issue in converting large DEM ASCII XYZ data was dealt with.
The data of a terrain surface in Surfer grid format has been directly converted into a 3D STL part. There was no translation to an intermediate file format, and therefore no data loss was associated with an intermediate file format. The STL file can be downloaded to an AM machine to grow a terrain model. Intricate geometries of terrain can be created with ease and accuracy.
REFERENCES
[1] Agrawal, S., Antunes, J.P., Theron, E., Truscott, M. & de Beer, D.J. 2006. Physical modeling of catchment area by rapid prototyping using GIS data, Rapid Prototyping Journal, 12(2), 7885. [ Links ]
[2] Agrawal, S., de Beer, D.J. & Modi, Y.K. 2010. Direct conversion of a GIS surface data to a 3D STL part for terrain modelling by additive manufacturing technologies, 11th Annual International RAPDASA conference, VUT, Vanderbijlpark, South Africa. [ Links ]
[3] Bailey, M. 2005. Layered manufacturing for scientific visualization, Communications of the ACM, 48(6), 42-48. [ Links ]
[4] Campbell, R.I., de Beer, D.J. & Pei, E. 2011. Additive manufacturing in South Africa: Building on the foundations, Rapid Prototyping Journal, 17(2), 156-162. [ Links ]
[5] Climate Source. 2011. Arc/Info ASCII grid files. http://www.climatesource.com/format/arc_asciigrid.html. Accessed August 2011. [ Links ]
[6] Codehaus. 2011. ArcInfo ASCII grid format. http://docs.codehaus.org/display/GEOTOOLS/ArcInfo+ASCII+Grid+format. Accessed August 2011. [ Links ]
[7] De Beer, D.J., Barnard, L.J. & Booysen, G.J. 2004. Three dimensional plotting as a visualization aid for architectural use, Rapid Prototyping Journal, 10 (2), 146-151. [ Links ]
[8] Franic, S., Bacic-Deprato, I. & Novakovic, I. 2006. 3D model and a scale model of the city of Zagreb, Quality scale and analysis aspects of city models, in Proc. ISPRS Technical Commission IV Symposium 2006. http://www.isprs.org/proceedings/XXXVIII/2-W11/Franic_Novakovic_Bacic-Deprato.pdf. Accessed August 2011. [ Links ]
[9] Geo Community. 2011. http://software.geocomm.com/translators. Accessed August 2011. [ Links ]
[10] Geospatial Designs. 2011. Surfer 6 grid file format. http://www.geospatialdesigns.com/surfer6_format.htm. Accessed August 2011. [ Links ]
[11] Gibson, I. & Ming, L.W. 2001. Colour RP, Rapid Prototyping Journal, 7(4), 212-216. [ Links ]
[12] Gibson, I., Kvan, T. & Ming, L.W. 2002. Rapid prototyping for architectural models, Rapid Prototyping Journal, 8(2). 91-95. [ Links ]
[13] Global Mapper. 2011. Surfer Grid (ASCII and binary format files). http://www.globalmapper.com/product/formats_elevation.htm#Surfer_Grid_ASCII_and_Binary_Format_Files. Accessed August 2011. [ Links ]
[14] Grime. 2011. http://www.grime.net/gistools. Accessed August 2011. [ Links ]
[15] Jacobs, L.D. 2003. Terrain modeling using rapid prototyping. http://www.msoe.edu/academics/research_centers/reu/pdf/2003/Terrain%20Modeling%20Using%20 Rapid%20Prot otyping.pdf. Accessed August 2011. [ Links ]
[16] Mueller, J. 2004. Terrain modeling using solid freeform surfaces. http://www.msoe.edu/academics/research_centers/reu/pdf/2004/Terrain%20Modeling%20Using%20 Solid%20Freef orm%20Fabrication.pdf. Accessed August 2011. [ Links ]
[17] OceanTeacher Digital Library. 2011. http://classroom.oceanteacher.org/OTMediawiki/index.php/Raster_and_Grid_Formats#Surfer_Grids. Accessed August 2011. [ Links ]
[18] Rase, W.-D. 2002. Physical models of GIS objects by rapid prototyping, Geospatial theory, processing and applications, In Proc. ISPRS Technical Commission IV Symposium 2002, The International Archives of the Photogrammetry, Remote Sensing and Spatial Information Sciences, GITC, The Netherlands, 2002. http://www.isprs.org/proceedings/XXXIV/part4/pdfpapers/237.pdf. Accessed August 2011. [ Links ]
[19] Rase, W.-D. 2009. Visualization of three-dimensional GIS objects using rapid prototyping technology, in Proc. GeoViz, Hamburg, Germany. http://wdrase.de/VisualizationGISObjects.pdf. Accessed August 2011. [ Links ]
[20] Sheriff, S.D. 2011. Surfer Grids, http://www.umt.edu/geosciences/faculty/sheriff/Equipment_Techniques_and_Cheats/surfergrids.pdf. Accessed August 2011. [ Links ]
[21] Z Corporation. 2011. http://www.zcorp.com/en/home.aspx. Accessed August 2011. [ Links ]
* Corresponding author.
# This article is an extended version of a paper presented at the 2011 RAPDASA conference.