


Services on Demand
Article
 English (pdf)
 Article in xml format
 Article references
Indicators

Related links
-
 Cited by Google
 -
 Similars in Google
Share

 Permalink
South African Journal of Industrial Engineering
On-line version ISSN 2224-7890
Print version ISSN 1012-277X
S. Afr. J. Ind. Eng. vol.23 n.1 Pretoria Jan. 2012
CASE STUDIES
A dynamic approach to improving the execution of development strategies for date-related industries in Iran, based on hybrid GRA and ISM methods
S. GhaneI, *; E. GhazaryanII
IDepartment of Management Armenian State Agrarian University. ghane_saeed@yahoo.com
IIDepartment of Management Armenian State Agrarian University. Eduard_ghazaryan@yahoo.com
ABSTRACT
This paper presents a hybrid Grey Relational Analysis (GRA) and Interpretive Structural Modelling (ISM) methodology for appropriate dynamic analysis, in order to improve the execution of development strategies for date-related industries in Iran. The proposed framework consists of four main phases: (1) establishment of strategies; (2) GRA analysis; (3) binary comparison to determine hierarchy levels using the ISM method; and (4) dynamic analysis. The analysis reveals that the strategic priorities to improve Iran's date industries can be arranged on three levels. The first level consists of the by-products of date packing and processing. On the second level, three tactics are determined: developing ready-for-use date products, deriving date fruit products, and fermentation of products. The third level is to blend dates with other foods and palm products (excluding dates).
OPSOMMING
Hierdie artikel hou 'n hibirede GRA en ISM metodologie voor vir dinamiese analise om ont-wikkelingstrategieë vir die dadelindustrie in Iran te verbeter. Die voorgestelde raamwerk bestaan uit vier fases: (1) vasstelling van die strategieë; (2) GRA analise; (3) binêre vergelyking om die hierargievlakke te bepaal deur die ISM metode te gebruik; en (4) dinamiese analise. Die analise toon dat die strategiese prioriteite om die dadelindustrie in Iran te verbeter in drie vlakke gerangskik kan word. Die eerste vlak behels die neweprodukte van dadelverpakking en -prosessering. Op die tweede vlak word drie taktieke ontwikkel: die ontwikkeling van gereed-vir-gebruik dadelprodukte, dadelvrugteprodukte en die fermentasie van produkte. Die derde vlak behels die versny van dadels met ander voedsel- en palmprodukte (uitgesonderd dadels).
1. INTRODUCTION
Iran is one of the world's main date-producing countries, consistently being among the top five, and often being ranked first in production. In 2008, Iran had 22 million date palms in over 240,000 hectares, producing around 15% of the world's dates. This made Iran the second-largest date producer in the world after Egypt (FAO 2008).
Due to a lack of suitable strategies, Iran has not exported dates that meet Western standards. Therefore, much of the low-quality fruit is exported to other countries such as India, where it is converted to animal feed or used as raw material for fermentation. Figure 1 illustrates the volume of Iran's date production and export in recent years [19].
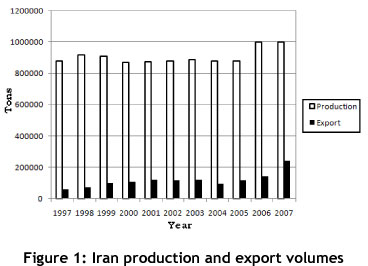
As Figure 1 shows, there is a major imbalance between the production and the export of dates. Assuming that the annual date consumption in Iran is 300,000 to 400,000 tons, a large proportion of the exportable date crop is inappropriately used inside the country. This wide gap between production and export requires further attention from the responsible authorities.
In this paper, date by-products are briefly reviewed, and ISM strategic modelling is used to suggest ways to improve the date industry in Iran.
2. DATES AND RELATED BY-PRODUCTS
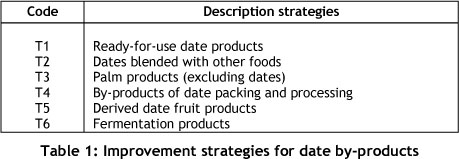
In this paper, six strategies to improve the date industry have been selected from the literature and from discussions with experts in the industry. These strategies are explained below [20].
2.1 Ready-for-use date products
Ready-for-use date products incorporating dates are mostly found as sweets, snacks, and jams. There are other examples where dates are used as product ingredients or mixed with other fruits, making up an assortment of products of the preserve industries. Dates filled with nuts and coated with chocolate or stuffed with brightly-coloured fondant, are some of the many date-based sweets. Date pastry, such as halva or date cookies, and date wafers can be found in many countries.
2.2 By-products of date packing and processing
In date packing and processing operations, a number of by-products become available that should be considered in order to make best use of the product, to decrease disposal problems and related expenses, and to make the whole operation commercially profitable.
The main by-products of processing and packing operations are cull dates and press cakes2, and date pits [5].
2.3 Palm products (excluding date fruit)
Practically all parts of the date palm, except for the roots, can be put to good use. For instance, the date palm sap stores the bulk of its reserve of photosynthetically-produced carbohydrates in the form of sucrose, found in solution in the vascular bundles of its trunk. Also, the sap of the palm leaves is known as a remedy for nervousness, kidney trouble, and putrid wounds, and to calm the effervescence of the blood. Burnt seeds are made into an ointment for ulcers, or a collyrium that produces long eyelashes.
2.4 Dates blended with other food
Some products are made of dates blended with other foods. Depending on the type of date used, these products are classified as sweets, preserves, condiments, breakfast meals, or desserts. For instance, dehydrated date is used in prepared cake, cookie, and muffin mixes.
2.5 Date-derived products
The production of date-derived products is dependent on the existence of quantities of second grade fruit - resulting from inadequate or marginal production systems - or as graded-out fruit from large-scale date packing operations. Some of the most important date-derived products are date juice, date spread, and liquid sugar [12].
2.6 Fermentation products
Production of fermentation products is restricted by the availability of suitable (low-cost) dates, and when market demand creates a favourable climate for producing them. Some of these are wine, alcohol, organic acids, and lipids [3].
In the light of the discussion above, the strategies for date by-products can be categorised into six major groups, shown in Table 1.
3. METHODOLOGIES
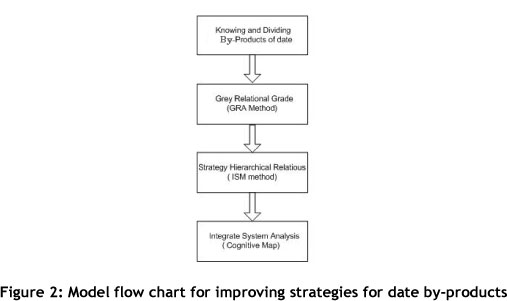
This study focuses on how, from the viewpoint of different specialists, strategies are generated and extracted. The strategies should therefore be investigated from different perspectives, and the potential, and uncertain, relationships between them should be formulated and prioritised according to different viewpoints. In this study, a combination of Grey Relational Analysis (GRA) and Interpretive Structural Modelling (ISM) is used for the binary comparison and prioritising of the strategies, and to analyse the integrated system. The summarised model flow chart is shown in Figure 2.
3.1 Grey Relational Analysis (GRA)
Grey relational analysis (GRA) was initially introduced by Professor Deng in 1982. The development of Grey theory during the 1990s resulted in its application in various fields, and it is still being developed. The key advantage of Grey theory is that it can precisely handle both incomplete information and unclear problems.
GRA is an important branch of Grey system theory. The word 'grey' describes the degree of information accessibility that is used to analyse the system structure. The term 'black' indicates that the essential information for analysing the system is completely inaccessible. Conversely, 'white' indicates that the required internal information is completely accessible. And so 'grey' comes between black and white, and is used for information that is incomplete and relatively unknown.
Grey system theory has several aspects and elements [6, 8]:
- Grey generation: This is a method for data processing that generates supplementary information that is required to analyse the system. It aims to process complicated and tedious data to produce a clear rule - the whitening of a sequence of numbers.
- Grey modelling: Following the first step, Grey modelling establishes a set of Grey variation equations and Grey differential equations - these are the whitening of the model.
- Grey prediction: Using the Grey model, qualitative prediction becomes possible - this is called the whitening of development.
- Grey decision: In this stage, a decision is made under imperfect countermeasure and in an unclear situation - called the whitening of status.
- Grey relational analysis: This quantifies all the influences of various factors and their relations - called the whitening of factor relations.
- Grey control: This works on the data of system behaviour, and looks for any rules of behaviour development to predict the future behaviour of the system. The prediction value can be fed back into the system to control the system [21].
Let P(X) be the set of factors related to the system under study, and Q the set of influential relationships. Therefore {P(X); Q} becomes the influence space, which must have the following properties:
- Dimension: The numeric value for all factors must be dimensionless.
- Scale: The factor value of different series must be at the same scale.
- Polarisation: The values of factors under investigation are comparable only if their value in different series is defined in the same direction.
The measurement space is expressed as {P(X); xi*(k)}, and the Grey relational space formed by the satisfaction of both factor space and comparability is denoted by {P(X); Q}.
Hence, P(X) series is formed as:
xi =(xi (1), xi (2), xi (k))∈I
where I= 0, 1, m, and k= 1, 2, n∈N
Considering xi (k) as the reference series for comparable factors, the Grey relational coefficient can be defined as:

where I=1, 2, 3, m, k=1, 2, 3, n j∈ I;
xi is of the reference series, xj is a specific comparison series;
∆ij =Ixi (k)-xj (k)Iis the norm between x0 and xj for k; and

ζЄ [0, 1] is the (adjustable) differentiating coefficient.
The Grey relation coefficient is the function differentiation of coefficient (ζ), which essentially estimates the variance between the background value and the objective to be estimated, and adjusts the size of the value according to the actual need. Generally, the value of the differential coefficient is always considered to be0.5; however, its value can be adjusted, based on the variance between the factors and the objectives. Based on mathematical principles, any change in the differentiating coefficient will only affect the size of the relative value, and not the ranking order of the Grey relational grade [17], [18].
Obtaining the Grey relational coefficient, the average resolution of the Grey relational grades can be calculated from:

Comparing series that have the same parameters as the reference series x0 of the Grey relation, the obtained values are ranked by size; and accordingly the ranking is done from the largest value.
3.2 Interpretive Structural Modeling (ISM)
First proposed by Warfield, Interpretive Structural Modelling (ISM) is a computer-assisted process for understanding and constructing the necessary relations of the elements in complex systems. ISM can be used to develop the skills of inquiring, understanding, and looking at a problem from an integrated systems perspective, which perceives a real and complex world with many types of interactions - for example, between social, economic, and biophysics subsystems. ISM can be used as a platform to facilitate discussions among system experts, and between system experts and stakeholders. These discussions enable them to reach goals and find common ways to solve problems. The key idea is to use experts' experience and knowledge to break down a complex system into several subsystems (elements) and build a multilevel structural model. [15, 10, 14]
Suppose the system under investigation has n elements denoted by T:

The relationship of each of the elements in T can be defined as a binary relation, where the set arranged by the ordered pair (ti, tj) that meets the binary relation in the Cartesian product Tx T, can be defined as R. Thus, the binary relation R is the subset of the Cartesian product, which is:

(ti, tj) є R, indicates that there is a relationship between elements ti and tj, which can be written as:

Correspondingly, every factor in set T can be considered as a node, and can be resolved by graph theory. Any relationship between two nodes in the graph is indicated by connecting them with a direct line. Thus tiRtj means that a directional line can be drawn from node ti to node tj.
Expanding the binary relation R to all members of set T, the comparison of all ordered pairs becomes feasible; which ultimately results in an n xn binary matrix, A, defined as follows:
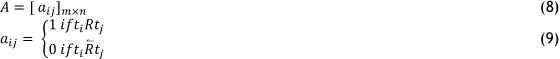
In matrix A, since every node can only reach itself, the path length of 0 or 1 can be used to indicate this possibility. This is accomplished by adding the adjacency matrix to the identity matrix, shown as follows:

where the matrix N is the element connection matrix.
Using Boolean logical operators, the rth power of matrix N is found as Ν2;Ν3;N4;....N4r-1; Nr subject to the following equation:

M is known as the reachability matrix, and a transferring relationship exists between this matrix and the connections of the matrix elements. M (ti, tj)=1, indicates that there is a path between node ti and node tj; and M(ti, tj)=0, shows that it is impossible to reach node ti from node tj. From all of the directed figures obtained from the reachability matrix M, all of the nodes can be classified into two categories:

R is of the set of factors ti in the reachability matrix that can reach factor tj, and is termed the adjacency reachability set. A is a set of all factors tj that can reach factor ti, and is termed the adjacency antecedent set.
If the elements of set A satisfy the following conditions:

Factor ti can be drawn out and listed in the same hierarchy, and the drawn factor can be removed from the reachability matrix M. The method is repeated continuously to determine for adjacency that can reach set Rand adjacency antecedent set A, after which the previous equation is followed again to determine the factor that will be drawn out from the next hierarchy. The process is applied again until all of the factors have been drawn out [17], [2], [4].
3.3 Model application
This study has used GRA and ISM relational analysis to determine the relationship of a binary assessment of priority strategies. Once the relationship among strategies has been clarified, interpretive structural modelling is used to deal with the analysis problem of strategy hierarchy. In this study, the following procedures are used: (1) criteria are defined to analyse the ranking order of strategy implementation for comprehensive judgment; (2) binary comparison is used to analyse the ranking order of strategy implementation; (3) an integrated approach is used to analyse sub-systems of decision-making levels.
There are two evaluation criteria in this study:
M1. Ability of implementation strategy: The better the strategies that can be obtained, the higher the priority.
M2. Marketing of implementation strategy: The higher the sell of the market to carry out the strategy, the higher the priority.
A detailed explanation of the model's operational procedures follows:
Step 1 For each criterion, all strategies are compared to numbers 1, 3, 5, 7, and 9. In parity comparison strategies, the higher score shows that the strategy under evaluation is more favourable than the other evaluated strategy.
Step 2 Based on the results obtained from the questionnaires in the previous step, a priority score can be calculated for each strategy against the rest of the strategies.
Step 3 After obtaining the score matrix, Grey relational calculations are conducted as follows:
(1) If the Grey relational grade obtained in step 2 is larger than 0.5, it is inferred that its strategy priority relationship is 1.
(2) If the Grey relational grade is equivalent to or smaller than 0.5, it is inferred that its strategy priority relationship is 0.
(3) Special cases are: (i) when coefficients are all smaller than or equivalent to 5, and Grey relational grades are all larger than 0.5, then the strategy relationship should be scored as 0; (ii) when coefficients are all larger than or equivalent to 5, and Grey relational grades are all greater than 0.5, then the strategy relationship should be considered as 1[9], [13].
Step 4 Based on the obtained system levels and the cognitive map, causal influences are investigated and an integrated system analysis is performed.
Table 2 shows the calculated results of steps 1 to 3, as well as the determined hierarchy strategies from the ISM method. These results are the outcome of the exchange of the ideas of scholars and experts in the field. Based on their judgment, while focusing on the mentioned strategies - indicated by T1, T2, T3, T4, T5, and T6 - the experts define the relative degree of importance of each strategy in the questionnaire.
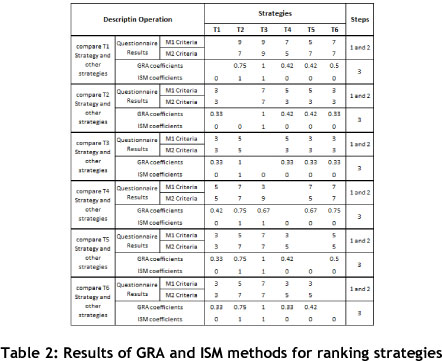
Further calculation gives the elements of the reachability matrix as:
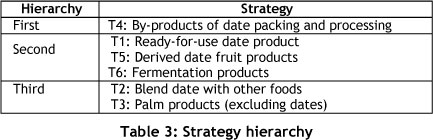
Thus, based on the results of following these steps, the relationships and the ranking order of the six strategies for the development of date by-products are shown in Figure 3 and Table 3 respectively.
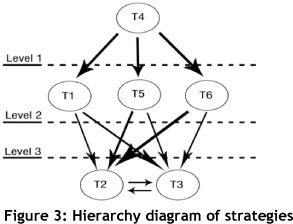
The structure of a system, in the aspect of systems modelling, is made up of the following: a spatial arrangement of elements; ordered levels (hierarchy) of subsystems and/or elements; and concentration and types of algebraic relationships between subsystems and/or elements. These three factors, together with a variety of elements (related to ordered levels), determine the complexity of a system. An extremely complex system model can be characterised by a rich variety of elements, a heterogeneous and irregular distribution of elements in space, many hierarchic levels, and nonlinear algebraic relationships between the elements.
In the following section, the relation of the subsystem is analysed using a dynamic approach [11].
3.4 Dynamic approach
The systems approach and integrated approach have been promoted for decades. Consequently, an increasing number of studies have adopted the systems approach. One of the best tools to analyse complex systems is cognitive mapping, which usually consists of analysing the variables and causal relations among them. In the cognitive map, the arrows interconnect variables. The direction of the arrows means the direction of causal influence, and the signs attached to the head of the arrows indicate the polarity of the causal relations. If two variables are connected by an arrow with a '+' sign, it means that the increase/decrease in the variable at the origin of the arrow causes an increase/decrease in the variable at the head of the arrow. On the other hand, if two variables are connected by an arrow with a '-' sign, it means the increase/decrease in the variable at the origin of the arrow causes an increase/decrease in the variable at the head of the arrow. With the variables and causal relations embedded in the cognitive map, the emergent perceptual structure can be observed. The perceptual structure can then be analysed to identify the perceptual bases of policy measures adopted by policy makers.
Cognitive maps do not precisely represent the algorithm, but they offer an abstract view of dynamic systems. The causal map helps the designer and the requirement strategies in the following ways [1], [7]:
- It provides a snapshot of the entire process under consideration, and aids the understanding of the process.
- It depicts the interrelationship between process elements.
- It helps formulate high level business rules.
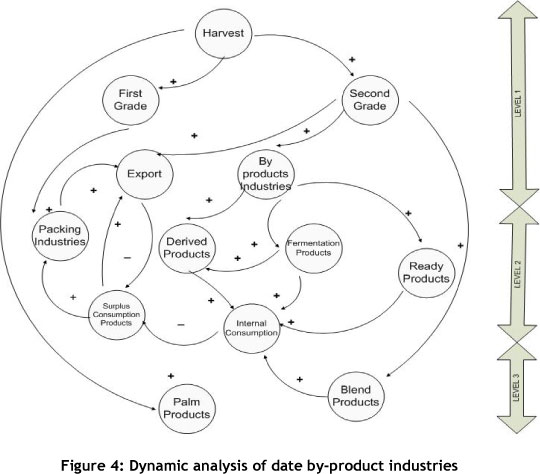
Figure 4 shows an acyclic directed graph, with the hierarchical layering of variables and parameters involved in the decision-making process to improve date strategies in Iran, based on the levels of strategy hierarchy obtained in the last stages.
4. CONCLUSIONS AND RECOMMENDATIONS
To define effectively the rankings of the development strategies of date by-products, this study has used the ISM method to evaluate the hierarchies for strategy implementation. Based on the processes of the study, important conclusions and recommendations follow:
- The study begins by identifying six categories of date by-products.
- The study focuses on the fact that the strategies can be formed from varied views. It is to be noted that the analysis of strategy prioritisation should be accomplished from diverse perspectives. Furthermore, since the comparison of strategy priority consists of binary comparison, this study chose ISM analysis.
- The proposed model is helpful for the strategy management obtained from the situation analysis, and the establishment of the ISM adjacency matrix. Thus the method can be widely applied to discrete-space decision-making problems.
- The results of this research show that the first strategy for improving date by-products in Iran is to improve the by-products of date packing and processing. At the second level, three strategies are determined: ready-for-use products, derived date fruit products, and fermentation products. At the third level, blending dates with other foods and palm products (excluding dates) should be considered.
- The proposed model provides a dynamic approach for analysing the relations among subsystems strategies, and can help other researchers to determine the dynamic equations and simulation results.
REFERENCES
[1] Nadkarni, S. & Shenoy, P.P. 2001. Bayesian network approach to making inferences in causal maps, European Journal of Operational Research, 128 (3), 1 February 2001, 479-498. [ Links ]
[2] Mandal, A. & Deshmukh, S.G. 1994. Vendor selection using interpretive structural modeling, International Journal of Operations and Production Management, 14 (6), 52-59. [ Links ]
[3] Ali, M.Z. & Dirar, H.A.A. 1984. A microbiological study of Sudanese date wines. Journal of Food Science, Faculty of Agriculture, University of Khartoum, Sudan, 49 (2), 4567-4580. [ Links ]
[4] Anderson, P. 1999. Complexity theory and organization science. Organization Science, 10 (3) 216-232. [ Links ]
[5] Al-Asgah, N.A. 1988. Date palm seeds as food for carp. Journal of the College of Science, King Saud University, 19 (1), 142-152. [ Links ]
[6] Kung, Chaang-Yung & Wen, Kun-Li. 2007. Applying Grey Relational Analysis and Grey Decision-Making to evaluate the relationship between company attributes and its financial performance - A case study of venture capital enterprises in Taiwan, Decision Support Systems, 43 (3), 842-852. [ Links ]
[7] Koulouriotis, D.E., Diakoulakis, I.E., Emiris, D.M. & Zopounidis, C.D. 2005. Development of dynamic cognitive networks as complex systems approximators: Validation in financial time series, Applied Soft Computing, 5 (2), 157-179. [ Links ]
[8] Chen, F.L. & Ou, T.Y. 2009. Grey relation analysis and multilayer functional link network sales forecasting model for perishable food in convenience store, Expert Systems with Applications, 36, 7054-7063 [ Links ]
[9] Ülengin, F., Kabak, Ö.,Önsel, Ș., Ülengin, B. & Aktaș, E. 2010. A problem-structuring model for analyzing transportation-environment relationships, European Journal of Operational Research, 200 (3), 844-859. [ Links ]
[10] Yang, J.L., Chiu, H.N., Tzeng, G. & Yeh, R.H. 2008. Vendor selection by integrated fuzzy MCDM techniques with independent and interdependent relationships, Information Sciences, 178, 41664183. [ Links ]
[11] Kwahk, K.Y. & Kim, Y.G. 1999. Supporting business process redesign using cognitive map, Decision Support Systems, 25, 155-178. [ Links ]
[12] Al-Ogaidi, H.K.H., Al-Janabi, S.M. & Al-Shakhli, I.M. 1987. Production of carbonated beverage using date juice. Effect of gelatin, tannin and PH on clarification of date juice (Arabic), Date Palm Journal, 5 (2), 2123-2130. [ Links ]
[13] Rai, V.K. & Kim, D.H. 2000. Cognitive map approach to understand and control software agents, Proceedings of the International Conference on Knowledge Based Computer Systems, Mumbai, India, 94-106. [ Links ]
[14] Ghoudsypour, S.H. & O'Brien, C.O. 1998. A decision support system for supplier selection using an integrated analytic hierarchy process and linear programming, International Journal of Production Economics, 56-57 (1-3), 199-212. [ Links ]
[15] Sage, A.P. 1977.Interpretive structural modeling: Methodology for large-scale systems, McGraw-Hill, New York, NY, 91-164. [ Links ]
[16] AnShiau, T. & Yi Hsu, C. 2003. Application of GRA and ISM integration model for the evaluation of international model for the strategies, Proceedings of the Eastern Asia Society for Transportation Studies, 4, 1297-1312. [ Links ]
[17] Thakkar, J., Deshmukh, S.G., Gupta, A.D. & Shankar, R. 2007. Development of a balanced scorecard - an integrated approach of interpretive structural modeling (ISM) and analytic network process (ANP), International Journal of Productivity and Performance Management, 56, pp25-59. [ Links ]
[18] Wu, W.Y., Hsiao, S.W. & Tsai, C.H. 2008. Forecasting and evaluating the tourist hotel industry performance in Taiwan based on Grey theory, Tourism and Hospitality Research, 8 (2), 137-152. [ Links ]
[19] http://www.faostat.fao.org/site/339/default.aspx [ Links ]
[20] http://www.fao.org/docrep/t0681e/t0681e08.htm [ Links ]
[21] Chang, Y.C. et al. 1999. Grey Relational Analysis: The introduction of Grey System theory, GauLih Book Co. Ltd, R.O.C. Taiwan. [ Links ]
* Corresponding author.
1 The author was enrolled for a PhD (Business Management) degree in the Department of Management, Armenian State Agrarian University.
2 The term 'press cake' refers to the solid remains after something has been pressed to separate the solids and liquids it contains.

