


Servicios Personalizados
Articulo
 Inglés (pdf)
 Articulo en XML
 Referencias del artículo
Indicadores

Links relacionados
-
 Citado por Google
 -
 Similares en Google
Compartir

 Permalink
South African Journal of Industrial Engineering
versión On-line ISSN 2224-7890
versión impresa ISSN 1012-277X
S. Afr. J. Ind. Eng. vol.23 no.1 Pretoria ene. 2012
GENERAL ARTICLES
Variable sampling rate hotelling's T2 control chart with runs rules
Ming Ha Lee
School of Engineering, Computing and Science Swinburne University of Technology (Sarawak Campus), Malaysia. mhlee@swinburne.edu.my
ABSTRACT
This study investigates the properties of the variable sampling rate Hotelling's T2 chart with runs rules. The average time to signal checking of the control chart is derived using a Markov chain approach. Numerical comparisons show that the variable sampling rate Hotelling's T2 chart with runs rules performs better than the variable sampling rate Hotelling's T2 chart without runs rules for small and moderate process mean shifts.
OPSOMMING
Dié studie ondersoek die eienskappe van Hotelling se T2-grafiek met veranderlike proefnemingstempo en lopiereëls. Die gemiddelde tyd wat aandui wanneer om die kontrolekaart te ondersoek, word afgelei deur van 'n Markovkettingbenadering gebruik te maak. Numeriese vergelykings wys dat Hotelling se T2-grafiek met veranderlike proefnemingstempo en lopiereëls beter presteer as Hotelling se T2-grafiek met veranderlike proefnemingstempo sonder lopiereëls vir klein en matige prosesveranderings.
1. INTRODUCTION
Runs rules are used to increase the performance of control charts in detecting small shifts.
The Western Electrical Company [6] suggested a set of runs rules to be used with the X control chart. Aparisi et al. [1] investigated the performance of Hotelling's chi-square control chart with supplementary runs rules. They concluded that the average run length of the chart with supplementary runs rules decreases considerably when there is a shift in the process. Koutras et al. [4] introduced a simple modification of the chi-square control chart, which makes use of the notion of runs to improve the sensitivity of the chart in the case of small and moderate process mean vector shifts.
A standard control chart uses a fixed sampling rate (FSR) in which the sample size and the sampling interval are fixed. In the literature, several approaches - such as variable sampling rate (VSR) - have been suggested to improve the performance of the control chart, in which the sample size and the sampling interval are allowed to vary according to the sample statistic. The VSR procedure is to use a small sample size and a long sampling interval if there is no indication of changes in the process mean. However, it uses a large sample size and a short sampling interval if there is an indication that the process mean may have shifted from the target value. The VSR Hotelling's T2 chart was developed by Aparisi & Haro [2]. They showed that there is a significant improvement in the average time to signal value for the Hotelling's T2 chart with the VSR feature.
Cui & Reynolds [3] considered the  chart with runs rules, in which the sampling interval is allowed to vary depending on what is observed from the current sample and past samples. Comparisons with the usual fixed sampling interval chart with runs rules show that the variable sampling interval chart with runs rules is more efficient. This study considers the Hotelling's T2 chart with runs rules in which the sample size and sampling interval are allowed to vary according to current and past sample statistics. This chart is called variable sampling rate (VSR) Hotelling's T2 chart with runs rules.
2. VARIABLE SAMPLING RATE HOTELLING'S T2 CHART WITH RUNS RULES
The performance of the control chart can be determined by the average number of samples to signal (ANSS), defined as the expected number of samples from the start of the process until the control chart signals. Another performance measure of the control chart is the average number of observations to signal (ANOS), defined as the expected number of items from the start of the process until the control chart signals. When the sampling interval can be varied, the performance of the control chart can be determined by the average time to signal (ATS). The ATS is defined as the expected length of time from the start of the process until the control chart signals. This zero-state ATS is an appropriate measure if it is assumed that the process starts to shift at the start of the process. In practice, however, in many cases the process may start in control, and shift at some random time in the future where the time of shift may fall between two samples. In this situation, it is more realistic to consider the steady state ATS (SATS), which allows for the shift to occur between two samples (Reynolds et al. [5]). Therefore in this study the performance of the out-of-control condition for the VSR Hotelling's T2 chart with runs rules is evaluated based on the SATS instead of the zero-state ATS.
The VSR Hotelling's T2 chart with runs rules consists of three regions: the safety region (below the warning limit WL), the warning region (between the warning limit WL and the control limit CL), and the out-of-control region (above the control limit CL). Let (n1, h1) be a pair of large sample size and short sampling interval, and let (n2, h2) be a pair of small sample size and long sampling interval, such that n2<  < n1 and , h1<
  < h2, where denotes the in-control average sample size and denotes the in-control average sampling interval. Let YS and YW denote the number of consecutive sampling points falling in the safety region and the warning region respectively. Then the pair of sample size and sampling interval for the next sampling point will be
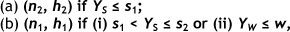
where s1, s2 and w are positive integers with s1 < s2.
Consider p correlated quality characteristics as being measured simultaneously, and the p quality characteristics follow a multivariate normal distribution with mean vector µ and covariance matrix Σ. Let  represent the tth sample average vector for the p quality characteristics with sample of size ni where i = 1, 2. For monitoring a process mean, the chart statistic Tt2 = ni (-µ0)Σ-1 (-µ0) is plotted on the Hotelling's T2 chart with control limit CL =
  where µ0 and Σ0 are the in-control process mean vector and the in-control covariance matrix respectively, and is the upper α percentage point of the chi-square distribution with p degrees of freedom.
Let p1 = Pr(w < χ2(ρ) < CL) / Pr(χ2(ρ) < CL) be the proportion of a sampling point falling in the warning region, given that this sampling point does not fall in the out-of-control region, and let p2 = Prx2(p) < w)/ Pr(χ2(p) < CL) be the proportion of a sampling point falling in the safety region, given that this sampling point does not fall in the out-of-control region, where χ2(ρ) denotes the central chi-squared random variable with ρ degrees of freedom. Then

and

It is noted that p1n1 + p2n2 = 1. The warning limit WL can be determined from Equation (1):

where F-1 is the cumulative distribution function of the standard normal distribution. From Equation (2) we can obtain h2 = ( - p1h1)/p2 by fixing p1, p2, and h1.
The performance of the Hotelling's T2 chart depends solely on the distance of the out-of-control mean vector µ1 from the in-control mean vector µ0. The magnitude of shift is expressed by

When the process is out-of-control, the sample statistic Tt2 is distributed as a non-central chi-square distribution with p degrees of freedom and non-centrality parameter c = niδ2. The VSR Hotelling's T2 chart with runs rules is considered to be out-of-control if: (i) s2 + 1 consecutive sampling points fall in the safety region (Tt2 < w); or (ii) w + 1 consecutive sampling points fall in the warning region (w < Tt2 < CL); or (iii) one sampling point falls in the out-of-control region (Tt2 > CL).
A Markov chain approach is used to evaluate the properties of the VSR Hotelling's T2 chart with runs rules. Consider the Markov chain with the following states:
State 1: one sampling point falls in the warning region
State 2: two consecutive sampling points fall in the warning region
State 3: three consecutive sampling points fall in the warning region
State w: w consecutive sampling points fall in the warning region
State w + 1: one sampling point falls in the safety region
State w + 2: two consecutive sampling points fall in the safety region
State w + 3: three consecutive sampling points fall in the safety region
State w + s2: s2 consecutive sampling points fall in the safety region
State w + s2 + 1: absorbing state (out-of-control)
Let ps and pw denote the probability for a sampling point falling in the safety region and the warning region respectively.
Then

and

where x2(p,c) denotes the non-central chi-squared random variable with p degrees of freedom and non-centrality parameter c = niδ2 (ni for ps is given as n2, whereas ni for pw is given as n1).
Suppose we consider the runs rules with w = 3, s1 = 4 and s2 = 7. Then the states for the Markov chain are defined as follows:
State 1: one sampling point falls in the warning region
State 2: two consecutive sampling points fall in the warning region
State 3: three consecutive sampling points fall in the warning region
State 4: one sampling point falls in the safety region
State 5: two consecutive sampling points fall in the safety region
State 6: three consecutive sampling points fall in the safety region
State 7: four consecutive sampling points fall in the safety region
State 8: five consecutive sampling points fall in the safety region
State 9: six consecutive sampling points fall in the safety region
State 10: seven consecutive sampling points fall in the safety region
State 11: absorbing state (out-of-control) and the transitional matrix of the transient states for the Markov chain is given as
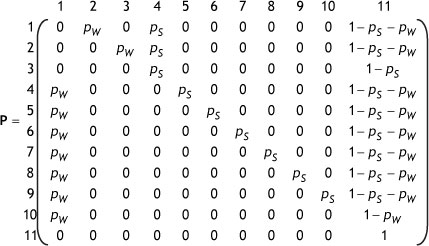
where the last row and column represent the absorbing state.
Let s denote the initial probability vector where all components equal zero, except where the (w + 1)th component equals one. Let h denote the vector of sampling interval with the (w + 1)th, (w + 2)th, (w + 3)th,... and (w + s2 - s1 + 1)th elements equal h2 and h1 otherwise. Let n denote the vector of sample size with the (w + 1)th, (w + 2)th, (w + 3)th,... and (w + s2 - s1 + 1)th elements equal n2 and n1 otherwise. When the process is in-control, the zero-state ANOS, the zero-state ANSS, and the zero-state ATS respectively are calculated as: (7)

and

where Q0 is the (w + s2) χ (w + s2) sub-matrix of the transient states for the in-control process (δ = 0), obtained by deleting the last row and column of matrix P; I is the identity matrix; and 1 is a column vector of ones. The in-control average sample size and the incontrol average sampling interval can be expressed as:
![]()
Let b denote the vector of modified steady-state probability with elements bi = π ihi/ π 'h where i = 1, 2,..., (w + s2), and π is the in-control steady-state probability vector, which can be obtained by solving the following equations:
![]()
where Q'01 is obtained by dividing each element of Q0 by the sum of its row. Therefore the out-of-control SATS can be obtained by:
![]()
where Qδ is the (w + s2) χ (w + s2) sub-matrix of the transient states for the out-of-control process (δ ≠ 0), obtained by deleting the last row and column of matrix P.
3. PERFORMANCE OF VARIABLE SAMPLING RATE HOTELLING'S T2 CHART WITH RUNS RULES
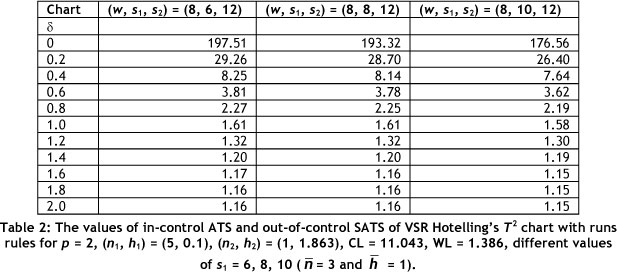
Tables 1, 2, and 3 give the values of the in-control ATS and the out-of-control SATS of the VSR Hotelling's T2 chart with runs rules for different values of w, s1, s2, respectively. From Tables 1 and 3, the false alarm rate decreases and the out-of-control SATS increases when the values of w and s2 increase; whereas from Table 2, the false alarm rate increases and the out-of-control SATS decreases when the value of s1 increases.
Tables 4 to 7 give the values of the in-control ATS and the out-of-control SATS of the VSR Hotelling's T2 chart with and without runs rules for p = 2, four quality characteristics, in-control average sample size of n = 3 and 5, and in-control average sampling interval of = 1.0. The tables also give the in-control ATS and the out-of-control SATS of the FSR Hotelling's T2 chart with and without runs rules. The control limit is CL =  for the VSR and FSR Hotelling T2 charts with runs rules, where
  is the upper α percentage point of the chi-square distribution with p degrees of freedom. The warning limit is WL =
  for the VSR Hotelling's T2 chart with runs rules. The in-control average sample size and in-control average sampling interval of the VSR control chart are matched with the fixed sample size n0 and the fixed sampling interval h0 of the FSR control chart respectively. This means that the values of (n1, h1) and (n2, h2) for the VSR control chart are selected such that the VSR control chart has the same in-control performance as the FSR control chart in the sense that the false alarm rate or the in-control ATS of the VSR control chart is the same as the FSR control chart. Comparisons of the VSR Hotelling's T2 chart with and without runs rules in Tables 4 to 7 show that the runs rules improve the performance of the VSR Hotelling's T2 chart for small and moderate process mean shifts. The tables also show that the VSR Hotelling's T2 chart with runs rules performs better than the FSR Hotelling's T2 chart with and without runs rules for a wide range of process mean shifts, except for large shifts.
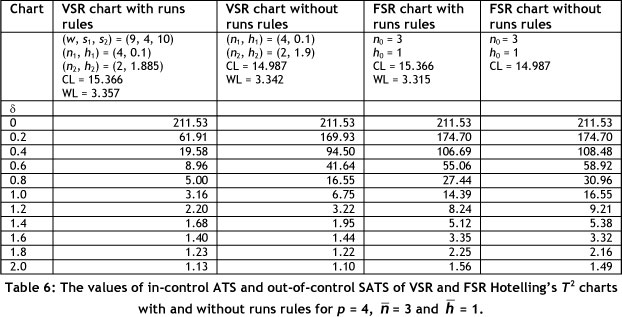
Suppose that it is desirable to improve the performance of the VSR Hotelling's T2 chart by adding runs rules with (w, s1, s2) = (9, 4, 10); (n1, h1) = (4, 0.1); (n2, h2) = (2, 1.885); CL = 15.366; and WL = 3.357 to monitor a process with p = 4 quality characteristics (in-control ATS = 211.53). Then the pair of sample size and sampling interval for the next sampling point will be (n2, h2) = (2, 1.885) if the number of consecutive points falling in the safety region (Tt2 < 3.357) is less than or equal to s1 = 4; whereas the pair of sample size and sampling interval for the next sampling point will be (n1, h1) = (4, 0.1) if the number of consecutive points in the safety region ( Tt2 < 3.357) is more than s1 = 4 and less than or equal to s2 = 10; and if the number of consecutive points in the warning region (3.357 < Tt2 < 15.366) is less than or equal to w = 9. The process is considered to be out-of-control if (s2 + 1) = 11 consecutive sampling points fall in the safety region (Tt2 < 3.357), or (w + 1) = 10 consecutive sampling points fall in the warning region (3.357 < T2 < 15.366). The results in Table 6 show that this VSR Hotelling's T2 chart with runs rules performs better than the corresponding VSR Hotelling's T2 chart without runs rules for small and moderate process mean shifts, and this control chart also performs better than the corresponding FSR Hotelling's T2 chart with and without runs rules.
4. CONCLUSIONS
The application of runs rules to the VSR Hotelling's T2 chart shows that the out-of-control SATS achieved improvements for small and moderate process mean shifts. Thus adding runs rules improves the performance of the VSR Hotelling's T2 chart. The Markov chain approach is used to calculate the in-control ATS and the out-of-control SATS of the control charts. From the numerical results, the VSR Hotelling's T2 chart with runs rules is also superior to the FSR Hotelling's T2 chart with and without runs rules in detecting process mean shifts.
REFERENCES
[1] Aparisi, F., Champ, C.W. & Garcia-Diaz, J.C. 2004. A performance analysis of Hotelling's χ2 control chart with supplementary runs rules, Quality Engineering, 16, pp 359-368. [ Links ]
[2] Aparisi, F. & Haro, C.L. 2003. A comparison of T2 control chart with variable sampling schemes as opposed to MEWMA chart, International Journal of Production Research, 41, pp 2169-2182. [ Links ]
[3] Cui, R.Q. & Reynolds, M.R., Jr. 1988. X -charts with runs rules and variable sampling intervals, Communications in Statistics - Simulation and Computation, 17, pp 1073-1093. [ Links ]
[4] Koutras, M.V., Bersimis, S. & Antzoulakos D.L. 2006. Improving the performance of the chi-square control chart via runs rules, Methodology and Computing in Applied Probability, 8, pp 409-426. [ Links ]
[5] Reynolds, M.R., Jr, Amin, R.W., Arnold, J.C. & Nachlas, J.A. 1988. X charts with variable sampling intervals, Technometrics, 30, pp 181-192. [ Links ]
[6] Western Electrical Company. 1956. Statistical quality control handbook, American Telephone and Telegraph Company. [ Links ]

