


Servicios Personalizados
Articulo
 Inglés (pdf)
 Articulo en XML
 Referencias del artículo
Indicadores

Links relacionados
-
 Citado por Google
 -
 Similares en Google
Compartir

 Permalink
South African Journal of Industrial Engineering
versión On-line ISSN 2224-7890
versión impresa ISSN 1012-277X
S. Afr. J. Ind. Eng. vol.23 no.1 Pretoria ene. 2012
GENERAL ARTICLES
Enhancing customer experience through business process improvement: an application of the Enhanced Customer Experience Framework (ECEF)
G.J. BothaI; P.S. KrugerII; M. de VriesIII
IDepartment of Industrial and Systems Engineering University of Pretoria, South Africa, jozine.botha@up.ac.za
IIDepartment of Industrial and Systems Engineering University of Pretoria, South Africa. paul.kruger@up.ac.za
IIIDepartment of Industrial and Systems Engineering University of Pretoria, South Africa. marne.devries@up.ac.za
ABSTRACT
In 2010 Botha, Kruger & De Vries [5] introduced a framework for enhancing customer experience through improved business processes. They developed the Enhanced Customer Experience Framework (ECEF) by integrating various well-known techniques into one comprehensive framework.
The ECEF incorporates three well-known tools: quality function deployment (QFD), business process re-engineering, and simulation. QFD is used to determine the relationship beween business processes and customer requirements, and to prioritise business processes from a customer perspective. Business Process Re-engineering (BPR), together with the steps associated with benchmarking, provides a useful process that may be followed when re- engineering business processes to fit customer needs; while simulation modelling is used to test the impact of process improvements on customer experience.
This paper aims partially to validate the ECEF against empirical data obtained from the telecommunications industry.
OPSOMMING
'n Raamwerk om kliente-ervaring te verbeter deur die herontwerp van besigheidsprosesse is in 2010 deur Botha, Kruger & De Vries [5] bekendgestel. Die verbeterde-kliente-ervaring- raamwerk is ontwikkel deur welbekende tegnieke te integreer tot een omvattende raamwerk.
Die verbeterde-kliente-ervaring-raamwerk inkorporeer bekende tegnieke soos gehalte- funksie-ontplooiing, besigheidsprosesherontwerp en simulasiemodelering. Gehaltefunksie- ontplooiing word gebruik om die verhouding tussen besigheidsprosesse en klientebehoeftes te bepaal, asook om die prosesse te prioritiseer vanaf 'n klientperspektief. Besigheids- prosesherontwerp tesame met die stappe geassosieer met die gebruik van 'n verwysings- norm, bied 'n bruikbare proses wat gevolg kan word om besigheids prosesse te herontwerp om aan klientebehoeftes te voldoen. Simulasiemodelering kan vervolgens gebruik word om die impak van die prosesverbeteringe op kliente-ervaring te meet.
Hierdie artikel beoog om die verbeterde-kliente-ervaring-raamwerk gedeeltelik te valideer deur die toepassing daarvan op empiriese data, verkry uit die telekommunikasie industrie.
1. INTRODUCTION
In the current business environment, customers need to be the central concern of management [12]. James et al. [12] state that when companies make customers paramount in their business strategies, a radical shift occurs in the way they manage and measure success. New economics of service demand innovative measurement techniques that can help managers to build customer satisfaction and loyalty, and at the same time measure the corresponding impact on profitability and growth [12]. James et al. [12] maintain that the lifetime value of a loyal customer can be enormous. This value can be enhanced when referrals are added to the economics of customer retention and repeat purchases of related products. From this it is clear that customer retention is extremely important. It is dependent on customer satisfaction and on how customers experience the products and services of the company. If a company can succeed in satisfying customer needs, they will be able to retain their customers.
Customers in the telecommunications industry can choose from an array of products and services from more than one telecommunications company. South Africa has three major cellular networks: Vodacom, MTN, and Cell C. Apart from the three cellular giants, there is one fixed line network. All four companies compete for voice traffic. Quality of service is imperative in the industry, as it serves as a differentiator [1]. The shift of power from company to customer forces companies to focus on customer retention and loyalty through improved customer experience. The Enhanced Customer Experience Framework (ECEF), introduced by Botha et al. [5], may assist companies to enhance their customer experience by delivering quality service through customer-centred business processes. The ECEF can be seen in Figure 1. The framework has seven stages, which can be seen as the ECEF process steps followed to build the framework. They are discussed in detail by Botha et al. [5]. In this paper the conceptual framework developed by Botha et al. [5] is partially validated using data obtained from the telecommunications industry. The limitations of this partial validation are discussed in Section 4 of this paper.

2. THEORETICAL BACKGROUND OF THE ECEF
The ECEF is based on various theoretical concepts that provide a process for building the framework. Various principles and methods can be derived from these concepts.
- The Business Process Re-engineering (BPR) methodology developed by Davenport & Short [9] provides a process and the principles for the framework.
- Business Process Benchmarking, defined by Camp [7], provides various process steps for the framework.
- The service design and management model defined by Ramaswamy [13] provides insight into how benchmarking can be used to determine both the current and the desired performance level for each business process. Ramaswamy [13] also provides a rationale for using QFD over other techniques such as the tree diagram.
- The customer measurement and management system defined by Gustafsson & Johnson [10] provides the method for gathering customer data for the QFD diagram.
- A framework for analysing the quality of the customer interface defined by Bitran [3] provides further principles associated with determining customer requirements that can be used for the QFD diagram.
- The value chain analysis defined by Chase et al. [8] provides a method for identifying key business processes that deliver value to the customer.
Botha et al. [5] motivated their choice of tools and the design trade-offs for the ECEF by referring to the literature listed above and referenced by Botha & Van Rensburg [6].
3. THE TELECOMMUNICATIONS INDUSTRY IN SOUTH AFRICA
The strategic position of the telecommunications industry in South Africa may be analysed using Porter's five forces model. The model emphasises five potential competitive forces [11]:
- The threat of new entrants.
- The threat of substitute goods or services.
- The bargaining power of customers.
- The bargaining power of suppliers.
- The degree of rivalry amongst existing competitors.
In South Africa the telecommunications industry is faced with the threat of new entrants as one of the largest competitive forces. In 2001 a third telecommunications company was introduced in South Africa, and the market share that had belonged to only two companies was redistributed between three. For all of them to be competitive, they had to invest in delivering quality service to customers. Unfortunately, as mentioned by Botha & Van Rensburg [6], the telecommunications industry has not yet succeeded in giving customers what they feel they need. Telecommunication companies are in dire need of service delivery processes that not only meet customer requirements but exceed them, and so deliver an exceptional customer experience.
4. PARTIAL VALIDATION STRATEGY OF THE ECEF
The ECEF is partially validated in this paper by applying the framework stages to data obtained from one of the three major cellular networks in South Africa. To maintain confidentiality, it will be referred to as Company A. This paper attempts to enhance the customer experience of Company A by applying the ECEF to improve one of their business processes. The other two major cellular networks are referred to as Company B and Company C, and are the two main competitors of Company A.
There are certain limitations to the validation of the ECEF:
- Due to the unavailability of data, not all the data used in this paper could be obtained from Company A. Certain data points are estimated by the author for illustration purposes, and the output can thus not be applied directly to Company A.
- For the purpose of the partial validation, only one 'what-if' scenario is determined for each process, and is tested through simulation.
- The main goal of the framework is to improve business processes and to measure the impact on customer satisfaction and consequently on customer experience. The cost involved in implementing the improvements does not form part of the ECEF, and so the costing analysis of improvement initiatives does not form part of the partial validation.
- For the purpose of the partial validation, only one KPI is specified for each process that may be associated with one of the customer requirements of that process.
- The feedback loop from stage seven back to stage one is not addressed in this partial validation; it will be part of future research.
5. VALIDATION OF FRAMEWORK STAGES
5.1 Stage One: Develop framework objectives
The first step in the validation of the framework is to understand the strategic planning of the company about measuring customer experience. The company's strategy must be taken into account when developing objectives for the company-specific framework. The objective of the ECEF remains the same: the focus is on improving customer experience through improved business processes [5]. The first step in achieving this objective is to identify where the company went wrong from a customer perspective. When identifying problem areas, the company should decide, on a strategic level, which market segment to target first. Gustafsson & Johnson [10] suggest that customers can be grouped into segments based on customer needs, benefits sought, or personal values served. For the purpose of validating the ECEF, the post-paid consumer segment is chosen - mainly due to the number of complaints received from post-paid customers, but also due to the quantity of information and data available for this segment.
5.2 Stage Two: Identify key business processes and define KPIs for each process
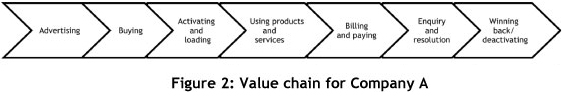
According to Botha et al. [5], it is important to identify and document all the business processes in the organisation that have an impact, direct or indirect, on customer experience in a selected market segment. A value chain analysis may be done to identify a list of high level business processes for Company A. Chase et al. [8] suggest the value chain as a structure to capture the linkage of organisational activities that create value for the customer and profit for the firm. Value chain analysis was chosen as the preferred technique for Stage Two of the ECEF, as the value chain may be useful to identify all the key business processes from Company A that may deliver value to the customer. Figure 2 shows a typical value chain for a company like Company A. Data for value chain analysis are obtained from existing sources within Company A.
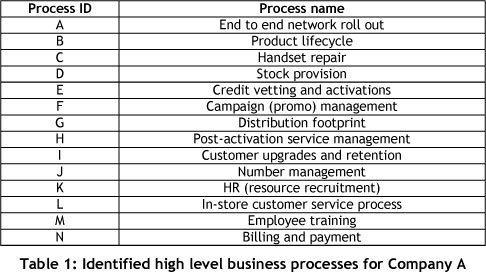
After the value chain is defined for Company A, business processes may be determined that deliver each of the value-adding activities to the customer. Table 1 provides a list of identified high level business processes for Company A.
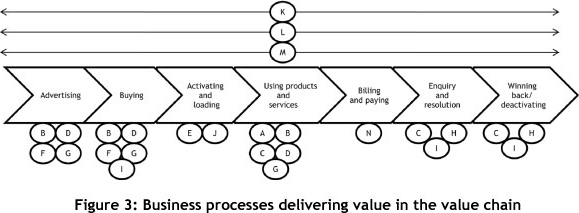
The processes are related to the activities depicted in the value chain. Figure 3 illustrates where each of the above-listed processes will take place in the value creation process.
The business objective of the ECEF is to enhance customer experience. It is vital to identify all the business processes that are currently in conflict with this objective. Analysing data on customer complaints may help to identify the areas and consequently the processes with which customers are not satisfied. Customer complaint data within Company A can then be used to choose a sample of processes that should be re-engineered first. According to relevant stakeholders, the following four processes are in dire need of improvement from a customer perspective:
- The repair process.
- The new deal process.
- The upgrade process.
- The in-store customer service process.
These processes may be mapped and problems surrounding the processes documented. For the purpose of this paper only one of the above-mentioned processes will be analysed and improved. The process chosen for this paper is the In-store customer service process, due to the large number of complaints received in this area. While mapping the process, the performance of the process should also be taken into account. Understanding process performance from a customer perspective is vital for the development of the company- specific framework. Process performance from the technical perspective is also important, and can sometimes differ substantially from the perspective of the customer. The current business processes of Company A are designed from the technical perspective. The goal of the framework is to link the two perspectives to do the technical redesign of business processes while considering the perspective of the customer. The technical performance of the repair process may be measured by defining Key Performance Indicators (KPIs) for the process that may be associated with one of the customer requirements. The KPIs should be specified by the design team. KPIs are specified for the repair process, based on the business objectives of enhancing customer satisfaction with regard to a specific customer requirement. Measuring the KPI will give an indication whether or not the process satisfies the specific customer requirement. The KPIs serve as a technical evaluation for the repair process. For the purpose of framework validation, the assumption is made that improving the specified KPI will lead to the desired outcome of increased customer satisfaction. The assumption is tested in Stage Seven with the aid of simulation modelling. The in-store customer service process map, existing problems and identified process KPIs are discussed in the next sections.
The in-store customer service process
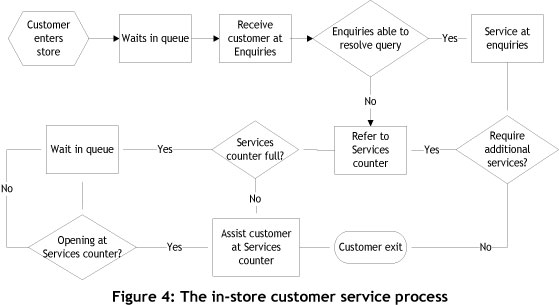
The in-store customer service process has a significant impact on customer experience. The process encompasses the entire time the customer spends in the system. Unfortunately the current queue length in many stores leads to frustrated and unhappy customers. The main problem to be addressed is the long waiting times experienced by customers. Figure 4 shows the in-store customer service process. Information for the process map was collected from relevant stakeholders. The KPI identified for the process is the total time the customer spends in the queue waiting for assistance. The time is influenced by various factors, such as:
- Queue length.
- Number of sales consultants.
- Time a customer spends in service.
- Number of customers entering the store.
5.3 Stage Three: Gather customer data
In this stage, customer data should be gathered to obtain all the customer requirements, together with importance ratings of the requirements for each business process identified.
The customer data required for the ECEF may be obtained through the process of CIT research as defined by Gustafsson & Johnson [10]. Botha et al. [5] concluded that face-to- face interviews were the best approach to obtain customer needs, while mail/telephone surveys could be used to obtain importance and satisfaction ratings from the customer. It is important, however, to identify existing sources of information within the company.
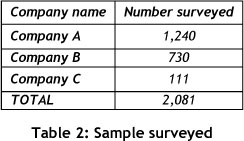
Relevant secondary information should be compiled and assessed to determine whether the information may be used as input for Stages Four and Five of the ECEF. If relevant data exists, it should be used instead of conducting new surveys, since it will save a significant amount of time and money. Company A has large quantities of customer information from previously conducted surveys. In 2008 Company A gathered valuable information from their customers through surveys and questionnaires. Information was gathered from 2,081 randomly selected customers distributed over Company A, Β and C. The following table shows the sample selected for each of the three companies.
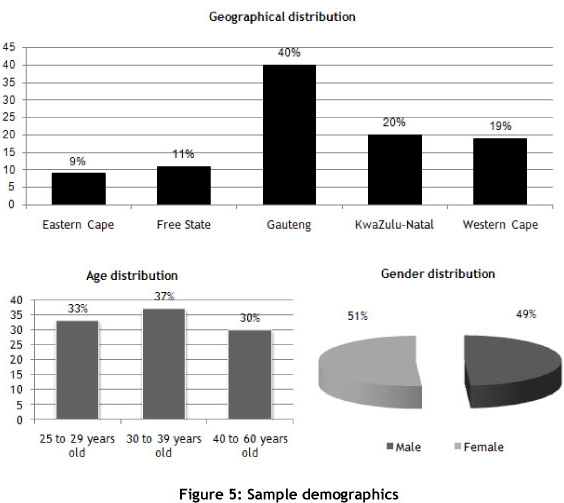
The sample demographics for the survey shown in Figure 5 give a good indication of the random nature of the sampling. The main goal of the survey conducted by Company A was to establish the key influences on customer satisfaction and loyalty. The survey was conducted through random sampling and made use of individual face-to-face interviews. The survey consists of factors and attributes that drive customer loyalty in South Africa, and includes a rating on how well the company and its competitors satisfy each specific factor. The research objectives of the survey are as follow:
- Understanding customers' expectations and uncovering the relationship between Company A's products and services, factors and attributes that drive customer loyalty in South Africa.
- Measuring the importance of the factors and attributes for strategic improvement across customer segments.
- Measuring Company A's performance in each factor, and attribute and clearly understand the extent to which customers' expectations in the post-paid segment are met.
From these objectives it is clear that the data gathered in 2008 through the satisfaction and loyalty survey can easily be interpreted to obtain the data needed for Stages Four and Five of the ECEF. The factors and attributes surveyed may be interpreted as customer requirements. The importance and performance determined for each factor can therefore be used as importance and satisfaction ratings for each requirement. Although the information was gathered in 2008, and may be of little value to Company A because it is outdated, it may be used to validate the framework introduced by Botha et al. [5]. By using the secondary data, the use of the framework can be illustrated within a real life organisation. Since Company A has reliable and complete secondary data, the existing data sets are used in this paper to validate the ECEF.
5.4 Stage Four: Link business processes to customer requirements
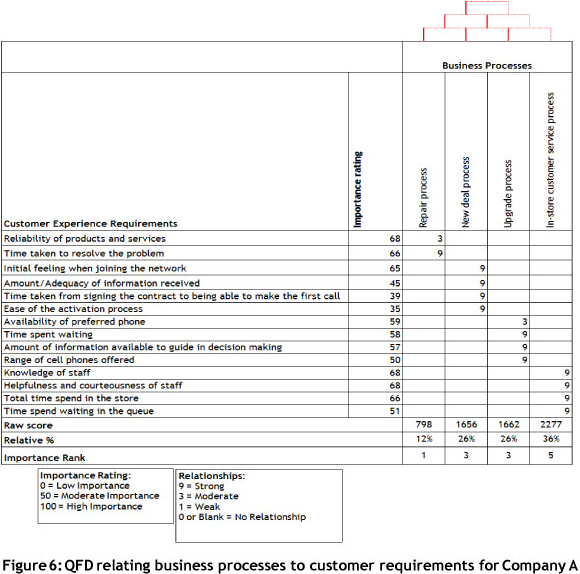
In this stage, the business processes identified in Stage Two are linked to their associated customer requirements identified in Stage Three. Botha & Van Rensburg [6] suggest the Quality Function Deployment (QFD) diagram as a suitable tool to link processes to requirements, because it can relate any identified set of business processes to any number of requirements. The information obtained from QFD is detailed enough to establish whether the relationship between a given process and a set of requirements is weak or strong. This stage consists of the QFD diagram for Company A with relationship mapping between identified business processes and customer requirements. According to Botha et al. [5], the relationship mapping is determined by analysing the extent to which a specific business process could technically influence the customer requirement. They suggest that the relationships are defined using a 1-, 3- or 9-point scale, where one represents a weak relationship, three represents a moderate relationship, and nine represents a strong relationship. A group of people from Company A who had the necessary knowledge of the defined set of business processes was interviewed during a workshop to obtain the relationship mapping. The importance of each requirement was determined through the survey on a scale from 0 to 100 percent, where 0 percent represents zero importance and 100 percent represents absolute importance. Figure 6 shows a portion of the QFD diagram for Company A that illustrates the relationship between the business processes and the requirements.
5.5 Stage Five: Prioritise business processes based on their impact and performance
During this stage, the business processes should be categorised and displayed according to their importance and performance by making use of the strategic satisfaction matrix defined by Gustafsson & Johnson [10]. The matrix is particularly useful in prioritising business processes by dividing them into four strategic categories, depending on their impact on customer satisfaction and their performance. Measuring the impact of a process on customer satisfaction is a fairly simple process. Once Stage Four is complete and all the business processes of Company A are related to their associated requirements, prioritisation of business processes based on their impact on customer experience is automatically completed. In Figure 6, the row labelled 'Raw Score' gives the total score each process has obtained, and directly represents the impact the process has on customer requirements.
The calculation of the 'Raw Score' is given by equation (1):

where:
yi  Importance rating of requirement i, Vi ∈ [1...n}
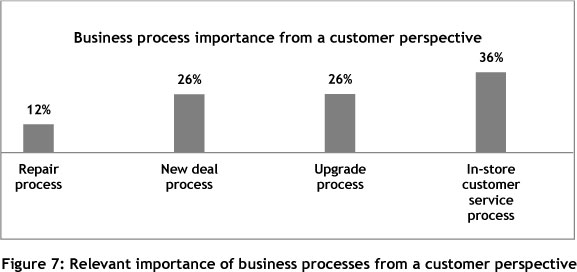
xp Relationship value between requirement i and process j, Vi ∈ [1..n}, j>∈ {1...n} In Figure 7 the business processes of Figure 6 are prioritised according to impact.
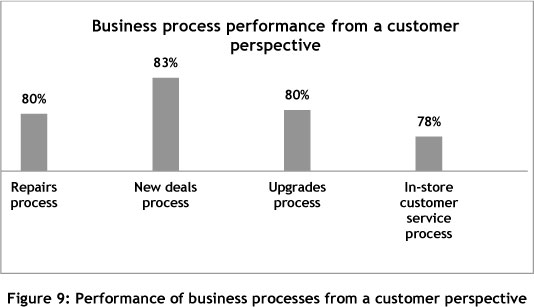
The performance of the processes from a customer perspective can be measured by using the satisfaction ratings obtained by the survey. The survey rating obtained on how well the competitors satisfy each need is not relevant for this stage, and is used in Stage Six. Based on the satisfaction rating specified by the customer (0-100 percent), it becomes possible t o identify the process performance for Company A from a customer perspective. Botha et al. [5] explain how this can be done by expanding on the traditional concept of QFD and using the tool to obtain a quantitative performance score for each process. Figure 8 shows the QFD diagram for Company A, where the process performance of each business process is determined using a 'Target score' and a 'Current score' calculated with equations (2) and (3). The 'Process performance' is then calculated using equations (4) as specified by Botha et al. [5].
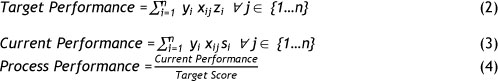
where:
zi Target satisfaction rating of requirement i ,  {1...n}
si Satisfaction rating for the producing company of requirement {1...n}
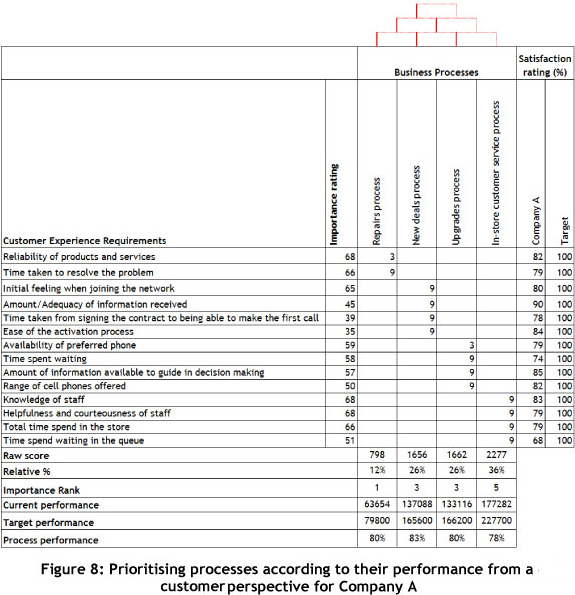
The calculations are based on formulas that should form part of the QFD diagram. The formula for calculating the 'Target score' contains the values specified by Company A as the target satisfaction ratings. The unavailability of data meant that the target satisfaction ratings could not be obtained. For demonstration purposes, the target ratings are set at 100 percent. This example is thus only used for demonstration purposes, and the output does not apply in practice.
The four chosen business processes identified for Company A can now be prioritised, based on the process performance calculated in this stage.
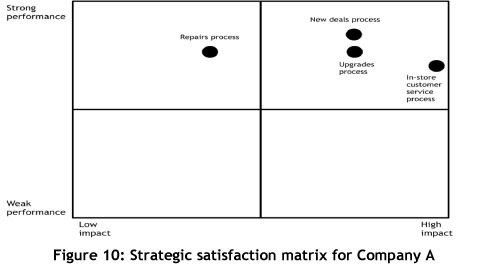
The processes can be plotted in the strategic satisfaction matrix to prioritise the four processes fully, based on their impact and performance. The matrix indicates which process should be focused on first. According to Gustafsson & Johnson [10], resources should be focused where impact is high and performance is weak. Improvements within this category will have the greatest impact on customer satisfaction and thus on loyalty and profitability. In this case, no processes fall within this category. The four selected processes for Company A fall within the upper two quadrants. The in-store customer service process is highest on the priority list, as it has the highest impact and the weakest performance. From the matrix it may be assumed that customer satisfaction will be enhanced when improving the in-store customer service process. Improvement efforts should thus be focused on this process first, and then on each of the other processes according to their matrix position.
5.6 Stage Six: Estimate the desired performance level for the business processes
In this stage, the desired performance level from a customer perspective should be estimated prior to attempting process improvements. Botha et al. [5] concluded from the literature that QFD is a suitable method to estimate the desired performance level. In this stage the desired performance level is estimated by examining the extent to which the performance of similar services in the market satisfies customer needs. The desired performance level is thus determined through benchmarking.
The first step associated with Stage Six is to identify the competitors of Company A that deliver similar products and services to the market. As discussed in section 2 of this paper, two other telecommunication companies deliver similar products and services to customers; they will be referred to as Company B and Company C. In the satisfaction loyalty survey done for Company A in 2008, customers were asked to rate the service delivered by the competitors on a scale from 0 to 100 percent. Once the satisfaction ratings have been obtained, a technical benchmark should be specified for each process. The technical benchmarks may be obtained by measuring the KPI specified for each process for Company A as well as the competitors. The estimated measurements are based on data obtained from relevant stakeholders. The KPIs can be linked to one of the customer requirements associated with each process. The desired performance level can thus be estimated by looking at the customer benchmark and the actual performance or technical benchmarks of the competitors.
The QFD in Figure 11 shows competitor satisfaction ratings as well as the technical benchmarks for each process. From Figure 11, the total time spent waiting in the queue is estimated to be an hour at most for Company A, while the satisfaction rating for the associated requirement is 68 percent. The highest satisfaction rating is obtained for Company B, where customers rated the time spent waiting in the queue at 69 percent; the corresponding technical benchmark for the rating is 30 minutes. The performance level of 30 minutes is thus closer to the performance level desired by customers, and the desired performance level can be estimated at less than 30 minutes. For the purposes of this paper, only the in-store customer service process will be discussed, as this process requires the most attention.
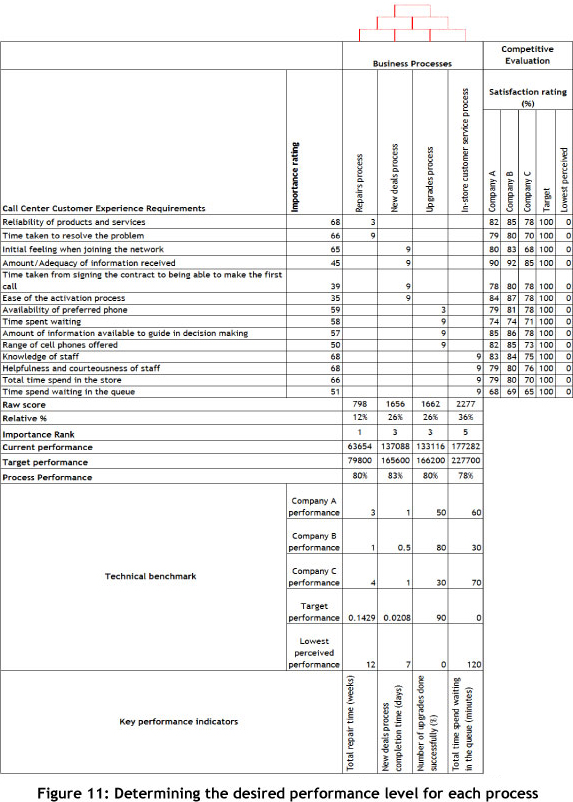
A target performance level and a lowest perceived performance level must also be specified in order to determine the best and worst technical benchmarks for each process. These performance levels may be obtained by interviewing customers of Company A. For the purposes of this paper, the target and the lowest perceived performance levels are estimated by the author to show how the performance/satisfaction rating may be obtained. The survey done by Company A in 2008 does not contain sufficient information on the two measures, and so an estimated value for both the target performance level and the lowest perceived performance level is used. The target performance level is the level of performance that corresponds to a 100 percent satisfaction rating. The lowest perceived performance level is the level of performance that corresponds to a zero percent satisfaction rating; it is thus the worst performance or the lowest perceived performance where customer satisfaction reaches zero percent. The difference between the desired performance level and the target performance level is that the desired performance level specifies the minimum performance level at which Company A must perform to remain competitive. The target performance level specifies the best possible performance that will guarantee 100 percent satisfaction from the customer. The design performance level will also depend on the amount of money the company is willing to spend.
In the next stage simulation models are used to test possible improvement initiatives for the in-store customer service process. 'What-if' analysis can be done with improvement initiatives to determine how the process may be improved to reach the desired performance level.
5.7 Stage Seven: Specify improvement initiatives and test their impact on customer experience
5.7.1 Specify improvement initiatives
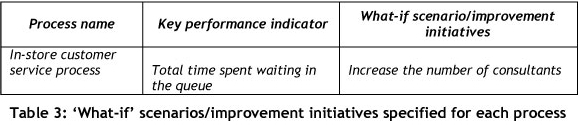
In this stage, improvement initiatives in the form of 'what-if' scenarios are defined for the in-store customer service process. The 'what-if' scenario is specified with the aim of improving the performance of the process against the KPI chosen for the process, and is shown in Table 3. The improvement in performance also then has an impact on the satisfaction rating of each associated requirement. The 'what-if' scenario must be tested with simulation models to determine the extent to which the process may be improved. Various 'what-if' scenarios can be identified and tested to determine the best possible improvement initiative for the process. The different improvement initiatives may also be analysed to determine the cost associated with each alternative to help choose the best initiative. For the purpose of the partial validation, only one 'what-if' scenario for the process is determined and tested through simulation. The costing analysis of the improvement initiatives does not form part of the partial validation. The following improvement initiative may contribute to higher customer satisfaction.
The above scenario may be simulated to identify its impact on customer experience. To capture all the necessary detail to analyse the specified improvement initiative, a simulation model is built using ARENA software. The data for the model was gathered through a one-on-one interview with a store manager from Company A. Data were also obtained by questioning selected customers from Company A. According to Banks et al. [2], the Poisson arrival process has been employed successfully as a model of the arrival of people at service facilities such as restaurants and banks. In these facilities, arrival takes place randomly from a large calling population, from which customers make independent decisions about when to arrive. Banks et al. [2] state that the Poisson arrival process is the most important model for random arrivals. From this the assumption is made that customers arrive at the service facility of Company A according to a random distribution. A triangular distribution for process times is used as an input parameter for the model, because this distribution is typically used as a subjective description of a population where only limited sample data is available [4]. The triangular distribution is based on the minimum, maximum, and most likely guess as to what the process time might be, and is very useful for modelling processes where the relationship between variables is known but data is scarce [4].
Simulated scenario: Increase the number of consultants
An average of three sales consultants are presently used to serve customers in dealerships. The number is increased to observe the impact on the queue length, waiting time, total time in system, and process completion time. Table 4 depicts the results obtained from the simulation model.
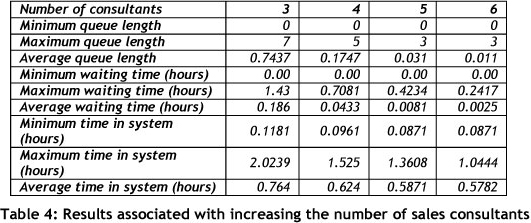
The number of sales consultants is increased from three to six consultants. The improvement affects the queue length and therefore also the time spent in the queue. Accordingly, the current maximum waiting time is about one hour and 24 minutes, and customers encounter queues with a maximum length of 7 persons. If four sales consultants are employed, the improvement is remarkable: a maximum waiting time of about 40 minutes and a queue length of five persons. When six sales consultants are employed, the maximum waiting time is 14 minutes and the queue length decreases to a maximum of three persons. The improvement initiative is worth serious consideration when viewed from a customer perspective.
5.7.2 Testing the impact of improvement initiatives on customer satisfaction ratings
Once the scenario has been simulated, the impact of the proposed improvement on customer satisfaction should be determined. The satisfaction ratings of the associated customer requirements may be improved due to the relationship between the technical benchmarks and customer requirements. The relationship may be described by using a performance/satisfaction function defined by Ramaswamy [13]. The increase in satisfaction for each requirement depends on the functional form associated with the specific KPI and customer requirement. A performance/satisfaction function may be determined for the in- store customer service process, based on the technical benchmark of the process with the associated satisfaction rating. The performance level of the KPI is measured for all three companies, and the target and the lowest perceived performance are determined in section 4.6 for the in-store customer service process. The performance level is shown in Figure 11 as the technical benchmark. The satisfaction rating for the associated customer requirement is also shown in Figure 11. The five performance ratings, together with the five satisfaction ratings for the KPI specified for the in-store customer service process, may be plotted graphically to determine the performance/satisfaction function with the least squares regression method. The impact that an improvement initiative may have on customer satisfaction is demonstrated in the function obtained for the in-store customer service process.
Testing the impact of employing more sales consultants at Company A stores
The performance of the in-store customer service process can be measured by measuring the performance of the KPI defined for this process. In the previous section the performance levels of the total time spent waiting in the queue was measured. The performance level of this KPI for Company A was improved from 60 minutes to 14 minutes. The figure below shows the functional form associated with this KPI.
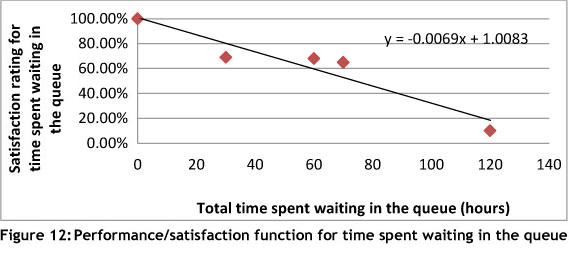
From the least squares method, the functional form is represented by the following equation:

Using equation (9), the satisfaction rating (y) associated with waiting 14 minutes in the queue is 91.1 percent. The improvement from 68 percent to 91 percent is significant, and Company A can consider implementing this initiative; but they must consider the cost involved in appointing three more sales consultants before they make their decision.
6. RECOMMENDATIONS AND FUTURE RESEARCH
Due to the unavailability of reliable data, the ECEF is only partially validated in this paper. The lack of additional data points leads to the use of only five data points to obtain the performance/satisfaction function of the in-store customer service process. The use of only five data points may cause the performance/satisfaction function to be unreliable, and due to limited data the measures of goodness of fit or the correlation factor could not be determined. To make the function more reliable, customers may be surveyed to obtain forecast satisfaction ratings for alternative performance levels. The additional data points obtained from the survey may then be plotted together with the five available data points to obtain a more reliable function. Least squares regression is used in this paper to capture the relationship between process KPIs and customer satisfaction. It is assumed that the least square method will provide the function that best fits the data obtained. It is important, however, that this assumption be tested. It is recommended that further empirical research be performed to analyse the impact of improvement initiatives on customer experience. The reliability of the ECEF may be tested through the application of the framework in a different service-oriented environment. It is recommended that the ECEF is applied in an environment such as the insurance or banking industry to test the reliability of the framework.
7. CONCLUSION
7.1 A critical analysis of the advantages and disadvantages of the ECEF
From the application of the framework, it is concluded that there are many advantages associated with the ECEF, making it an appropriate framework for enhancing the customer experience. The use of QFD in the framework can assist managers with the following [14]:
- To define product specifications which meet the customers' requirements, while paying attention to the competitors.
- To ensure consistency between the customers' requirements and the measurable characteristics of the product or service.
- To inform and convince all those responsible for various stages of the process of the relationship between the quality of the output of each phase and the quality of the finished product or service.
- To ensure consistency between the planning and operational processes of the company.
- To help minimise mistaken interpretations of priorities and objectives because planning takes place at an earlier stage.
- To translate customer requirements into meaningful (technical) requirements at each stage of the development and production processes.
- To bring people together from various disciplines and facilitate the formation of teams capable of meeting customer requirements.
By integrating the methodology of BPR into the framework, companies will be able to redesign their business processes by excising non-value adding work. BPR helps to maximise customer value while minimising the consumption of resources required to deliver their product or service [6]. The redesign of business processes is tested through simulation models, which leads to more advantages, such as these:
- Managers are able to study the dynamic behaviour of business processes.
- The results obtained are accurate compared with analytical models.
- Simulation is able to provide quantitative estimates of the impact that process redesign is likely to have on key performance measures.
- Simulation makes it easy to perform 'what-if' analysis to determine the best improvement initiative.
Although the integration of these three tools allows the ECEF to enjoy the combined advantages associated with these tools, it also leads to certain disadvantages that may be associated with the ECEF. Disadvantages associated with using QFD include these [14]:
- QFD is dependent on accurate customer data; if relevant secondary information does not exist, surveys must be conducted. These surveys may be very expensive to conduct in time and effort.
- QFD is dependent on the commitment of key people and senior management to contribute to the input. If their commitment cannot be obtained and maintained, the technique may have seriously negative strategic implications.
- QFD is very dependent on resources such as people, time, and finances.
- QFD and BPR must be integrated gradually, and resistance to change must be taken into account. Employees' concerns must be managed carefully.
Other disadvantages must be considered, such as these:
- Implementing the ECEF may lead to higher demands on employees; so employees must be motivated to do whatever it takes to satisfy the needs of the customers.
- It may be expensive to build simulation models to test the impact of process improvements.
- It may sometimes be difficult to interpret the results yielded by the simulation models.
- It may not always be possible to obtain reliable data as input for simulation models, and this can lead to inaccurate results that may have a significant negative impact on customer experience.
7.2 The value of the ECEF in the telecommunications industry
Due to the strict competition faced by the telecommunications industry in South Africa, and the low differentiation between the products they offer, they have had to invest in delivering quality service to their customers. Exceptional customer service may serve as a differentiator between the existing telecommunications companies. In this paper, the ECEF is applied to identify and prioritise key business processes and to align the highest priority process to the needs of the customer. The ECEF is effectively utilised to identify a feasible improvement initiative and to test the impact of the initiative on customer experience. The seven stages outlined in the ECEF are validated through the results obtained in this paper. The results prove that the customer satisfaction of Company A customers may be increased significantly through the application of the framework. This paper validates the usefulness of the ECEF in helping managers to satisfy customer needs. The ECEF may be used as a valuable framework for redesigning business processes to deliver products and services according to the needs of the customer.
REFERENCES
[I] Band, C., Pampallis, A., Van der Wal, R.W.E. 2002. Service quality in a cellular telecommunications company: a South African experience, Managing Service Quality, vol. 12, no. 5, pp. 323-335. [ Links ]
[2] Banks, J., Nelson, B.L. & Nicol, D.M. 2010. Discrete-event system simulation. 5th ed., Pearson Education, Prentice Hall. [ Links ]
[3] Bitran, G. 1993, Framework for analysing the quality of the customer interface, European Management Journal, Vol. 11, No. 4, pp. 385-396. [ Links ]
[4] Brighton Webs Ltd. Data & analysis services for industry & education. http://www.brighton-webs.co.uk/distributions/triangular.asp. Visited on 12 April 2012. [ Links ]
[5] Botha, G.J., Kruger, P.S. & De Vries, M. 2010. Enhancing customer experience through business process improvement: An introduction to the Enhanced Customer Experience Framework (ECEF). CIE40 Conference proceedings, Japan 2010. [ Links ]
[6] Botha, G.J. & Van Rensburg, A. 2010. Proposed business process improvement model with integrated customer experience management. South African Journal of Industrial Engineering, Vol. 21(1), pp. 45-57. [ Links ]
[7] Camp, R. 1995. Business Process Benchmarking: Finding and Implementing Best Practices. Productivity Inc. ASQC Quality Press. [ Links ]
[8] Chase, R.B. et al. 2006. Operations management for competitive advantage with global cases. New York, McGraw-Hill/Irwin. [ Links ]
[9] Davenport, T.H. & Short, J.E. 1990. The new industrial engineering information technology and business process redesign, Sloan Management Review, pp. 11-27. [ Links ]
[10] Gustafsson, A. & Johnson, M.D. 2000. Improving customer satisfaction, loyalty, and profit: An integrated measurement and management system, San Francisco, Jossey-Bass Inc. [ Links ]
[11] Jain, S.C. 1997. Marketing planning and strategy, 5th ed., South-Western College Publications, Cincinnati, OH. [ Links ]
[12] James, L.H. et al. 1994. Putting the Service-Profit-Chain to work, Harvard Business Review March-April 1994. [ Links ]
[13] Ramaswamy, R. 1996. Design and management of service processes: Keeping customers for life. New York: Addison Wesley. [ Links ]
[14] Youssef, M.A. & Zairi, M. 1995. A main pillar for successful total quality management and product development, International Journal of Quality & Reliability Management, vol 12, no. 6, pp. 9-23. [ Links ]

