


Servicios Personalizados
Articulo
 Inglés (pdf)
 Articulo en XML
 Referencias del artículo
Indicadores

Links relacionados
-
 Citado por Google
 -
 Similares en Google
Compartir

 Permalink
South African Journal of Industrial Engineering
versión On-line ISSN 2224-7890
versión impresa ISSN 1012-277X
S. Afr. J. Ind. Eng. vol.23 no.1 Pretoria ene. 2012
GENERAL ARTICLES
Consensus measurement in setting manufacturing strategy
B. EmwanuI, *; D.R. SnaddonII, **
ISchool of Mechanical, Industrial and Aeronautical Engineering University of the Witwatersrand, South Africa. bruno.emwanu@wits.ac.za
IIDepartment of Mechanical Engineering, Polytechnic of Namibia, Windhoek, Namibia. drsnaddon@polytechnic.edu.na
ABSTRACT
Interest in consensus in strategic operations needs to be matched by the ability to measure it accurately. This paper identifies a weakness in current measures of consensus, and designs a new instrument, measuring both before and after, that formulates a strategic plan. Convergence of participants' opinions as an indicator of consensus is proposed and applied, then determined and analysed. The instrument is applied in twelve companies, represented by 27 participating individuals, using a standard manufacturing strategy-setting methodology. Results indicate that convergence (consensus) rather than divergence predominates. Divergence, the opposite of convergence, also becomes important, further expanding the perspective of consensus.
OPSOMMING
Belangstelling in konsensus aangaande strategiese bedryfsaktiwiteite moet gepaard gaan met die vermoe om dit akkuraat te kan meet. Hierdie artikel identifiseer tekortkominge in bestaande maatstawwe van konsensus en ontwerp 'n nuwe instrument wat beide voor- en na-metings kan doen sodat 'n strategiese plan geformuleer kan word. Konvergensie van die deelnemers se opinies as 'n indikator van konsensus word voorgehou, toegepas en daarna geanaliseer. Die instrument is toegepas in twaalf maatskappye wat verteenwoordig is deur 27 deelnemende individue waar 'n standaardmetodologie vir die opstel van 'n vervaar- digingstrategie gevolg is. Die resultate toon dat konvergensie (konsensus) eerder as divergensie oorheers. Divergensie, die teenoorgestelde van konvergensie, word ook belangrik aangesien dit die perspektief van konsensus uitbrei.
1. INTRODUCTION
Both practitioners and researchers are interested in consensus. For example, strategic managers have long recognised the need to gain consensus to form and drive plans [1], and practitioners advocate its use in planning [2] and implementation [3]. Whyte [4] states that "the task after all of a decision making group is to produce consensus from the initial preferences of its members". Researchers in the strategy area also show considerable interest in consensus, where its relationship with various aspects of strategy has been investigated. Examples include business performance [5, 6], company strengths and weaknesses [7], management styles [8], alignment of strategic priorities [9], and quality of strategy decisions [10, 11, 12]. Nevertheless the definition of consensus is not consistent in the strategy literature. It varies [13] and seems to depend on how the concept of consensus is measured. Consensus is sometimes defined and measured by the proportion of those in agreement [14, 15, 16] and at other times by shared perspectives with or without commitment [17, 18, 19]. Dess & Origer [14] see the differences in definition and operationalisation in the literature as problematic. We take the view of Shanley & Correa [13] in understanding consensus to involve agreement by most, if not all, participants; and we consider only shared perspectives without considering commitment. We define consensus differently, and specifically consider the setting where participants take part in strategy formulation. Consensus is defined as the convergence of opinions of all, or the overwhelming majority of, the participants in a strategy formulation process towards a common focal point. The term 'convergence' suggests that some movement or shift in opinion takes place, while 'focal point' indicates the need to locate that direction and the meeting point of the movements. This has implications for operationalising the measure.
Researchers measure consensus in different ways, using standard deviation [5], percentage distribution [7], factor analysis [20], mean of absolute differences [21], and interrater reliability scores [10], among others. The popular approach seems to be the standard deviation approach first used by Bourgeois [5). This became the preferred choice for several other researchers [6, 18, 23, 24]. Iaquinto & Fredrickson [25] compared four different measurements of consensus - standard deviation, coefficient of variance, Euclidean distances, and interrater reliability score - and found the same trend of results. This suggests that there seems to be no advantage in using any of these traditional measuring techniques. (They nevertheless chose to apply the standard deviation technique because they found it to be the most used in the earlier literature.) One common feature in the traditional techniques, however, is that the decision about whether consensus has occurred or not is strongly judgemental, represented by statements such as the following: Dess & Origer conclude that "individual perspectives...have moved closer together" [14]; Whitney & Smith say that "[results]3 were supportive [of consensus]...as indicated by higher mean ratings" [26]; Hrebiniak & Snow say "larger deviations represent less agreement" [27]; Homburg et al say "higher values indicate greater consensus" [21]; laquinto & Fredrickson say "lower standard deviations represent more agreement" [25]; and Bourgeois says that "the variances...were dichotomised into 'low' and 'high' categories, which were termed 'agreement' and 'disagreement' respectively" [5]. In summary, these statements generally imply that there has been a move towards consensus. But the statements are unsatisfactory, as they leave the reader wondering about the extent to which consensus has been achieved. There is a need to explore further the implied movement, and to demonstrate more clearly that consensus takes place. Senge has alluded to "real consensus" [28], implying that an illusory or 'false' consensus can occur. Shanley & Correa [13] raise the notion of 'false' consensus. There is the danger that consensus may be mistaken as having occurred when it has not occurred, and so is misrepresented. Wooldridge & Floyd [17] raise the possibility of the misinterpretation of consensus, suggesting that consensus might consist of other facets. Taking this a step further, Dess & Priem suspect a weakness in the traditional methods of measuring consensus which, they say, "may...mask some important...process issues" [29], and Hrebiniak & Snow recognize the same weakness in the traditional methods, saying that a "statistical indicator of agreement" may be limiting as "processes of interaction" are masked [27]. Floyd & Wooldridge express the belief that sometimes what appears to be consensus at the surface may actually have important differences "hidden underneath" [19], and give the practical advice that consensus should be probed at a deep and specific level to determine whether managerial thinking is truly "in sync" [19]. These arguments support Dess & Origer's observation that "the nature of consensus...is not well understood" [14]. Further investigations are needed to understand consensus better and in particular to gain greater certainty about its occurrence. This paper considers a way of resolving this gap in consensus research, noting that uncertainty about whether consensus has actually occurred or not can lead to conflicting results.
Consensus literature, much of which has focused on linking consensus with performance [18], indicates conflicting findings [5, 6, 30, 16]. Various reasons for the ambivalence have been suggested [15, 29, 21, 17]. Weakness in methodology has been suggested by Dess & Origer: "conflicts are due more to differences in definition, operationalisation and research type" [14]. However, like other investigators [27, 21], their focus was only on performance in the consensus-performance relationship [14]. Priem [15] counters the argument of Dess & Origer [14], noting that the problem is unlikely to be with performance; attention should rather be focused elsewhere. Keeping to methodological issues, Priem [15] turns instead to consensus, and questions the instruments being used to measure it and whether they really tap into the required information. Other researchers also turn to consensus: they question the basic assumptions used and whether they adequately represent the consensus concept; and if they do, whether the measuring instruments used accurately present the correct picture of consensus. Wooldridge & Floyd [17] do not think that the assumptions are adequate, arguing that there is a problem with conceptualising consensus, which they see as restricted. They propose an expanded view of consensus, and suggest that it be looked at in different dimensions. Shanley & Correa agree [13], and propose the notion of consensus as a multidimensional construct, which should have an 'actual' component and an 'apparent' component, so that the question of 'accuracy' also becomes important. Priem suspects that consensus is an amalgam of components. He wonders whether what is being captured by traditional measuring approaches "such as standard deviation method" [15] is an amalgam of two components: one an 'outcome', and the other a 'process' component. He says that "this measure may indeed also reflect the level of conflict/disagreement which is occurring during the ongoing process of strategy decision making. Hence the...consensus measure may have both outcome and process components" [15]. This suggests that consensus may have a dynamic element. Wooldridge & Floyd [17] also raise the issue of the dynamic nature of consensus, but with no further discussion. This paper explores dynamism in consensus, and adopts a multidimensional view with an interest in the accuracy of representation.
Perhaps the greatest indictment of the traditional approaches to consensus measurement is made by West & Schwenk [24], who were unable to replicate significant prior findings, using the same popular measures and an even larger sample size. We quote from their observations that summarise most of the main arguments we make about the weaknesses of traditional consensus-measuring instruments. West & Schwenk call for special attention to be given to "measures of consensus". "Why seek inherently 'noisy' global measures of consensus? If firm goals and strategies are indeed idiosyncratic, it is inconsistent to assess the degree of.agreement from lists of universal variables" [24]. This paper uses an approach that can be adapted to suit individual firms. West & Schwenk are also concerned about the assumptions used in the traditional instruments: "we may have... assumed that the consensus construct is unidimensional" [24]. This paper takes a multidimensional view, and introduces an element of dynamism into the measuring instrument, helping to expand the perspective of consensus from an apparently unidimensional one. These authors also raise the issue of the absence of a time dimension in the measuring instruments: "measures before and after4...consensus would have the potential to make a much greater contribution" [24]. We construct 'before' and 'after' measures into our measuring instrument - something that has not been observed before in the literature. We address West & Schwenk's [24] recommendations together with other issues we have raised.
A few researchers [31, 16] have addressed some aspects of West & Schwenk's recommendations [24], as well as issues raised by us. However, their work contrasts with ours in several important respects. Markoczy takes before and after measurements, taking a cross-sectional measurement of consensus when a crisis (event) starts in an organisation, and another cross-sectional measurement when the crisis is over [31]. Our instrument, on the other hand, has longitudinal properties or "longitudinal design" [10], which differentiate it from cross-sectional instruments as such. Markoczy's study looks at the macro-level view of an organisation, where a crisis affects everybody in the organisation and causes a re-alignment of interests that are studied across the whole organisation. This macro-level view overtly ignores the narrower process of strategy formulation, which the author terms "negotiating situations" [31], with no further discussion. We focus on the strategy formulation process to obtain insight into the nature of consensus itself, rather than simply monitoring its location. Markoczy's measuring instrument [31], developed by Langfield-Smith & Wirth [32] and modified by Marcoczy & Goldberg [33], impr oves the traditional techniques; but it does not resolve the weaknesses mentioned earlier. Grinyer & Norburn, on the other hand, attempt to address the issue of determining when consensus takes place. They develop a measuring instrument that attempts for the first time to address the question, "how many [participants] must give the same answer before it can be safely assumed to be correct?" [16]. Here their approach is similar to ours, where we address the same question using 'decision criteria' (see section 2.2 Determination of consensus). Their instrument differs from ours: they consider a limited choice among alternatives - "either...or" [16]. Our instrument assumes an underlying movement, or shifts in opinion, therefore allowing a continuum of choices. Consensus measurements to date seem to be faulty in their accuracy of location because of multi-dimensionality and dynamism.
Several authors note that shifts occur following group discussions [34, 35]. Although their studies consider attitude (risk), while ours considers opinion, authors associate opinion with attitude. For example, Thurstone [36], who first measures attitude using opinion, and Likert [37], who simplifies his measures, both associate opinion with attitude. Thurstone says of opinion: "it expresses an attitude. an opinion symbolises an attitude" [36]. We adopt Evans' definition of opinion as "what or how one thinks about something" [38]. From the work of the above authors, it seems reasonable to expect shifts in people's minds when they participate in a strategy formulation process. This leads to the first hypothesis:
Hypothesis (a): In general, participants shift their opinions in a strategy process.
In addition, for consensus to take place in a strategy session, shifts in participant opinion tend towards convergence rather than divergence. This leads to a related hypothesis:
Hypothesis (b): The shifts will tend to converge rather than to diverge.
So the design of an instrument has the following requirements:
i. It should adjust consensus measurements for their accuracy of location because of multi-dimensionality.
ii. It should be capable, in part or whole, of accommodating shifts in each participant's opinions, over time, with longitudinal properties.
iii. It should be able to be used for different firms.
iv. It should incorporate a priori decision criteria to measure group consensus.
2. DESIGN OF THE INSTRUMENT
The elements of the instrument are in two sections. First, we design the questionnaire and associated issues of validity and reliability. Second, we tackle consensus determination from the questionnaire.
2.1 Design of the questionnaire
This considers the design of a questionnaire and associated issues of validity and reliability.
2.1.1 Questionnaire design
The questionnaires were designed to detect movement in opinion in each participant. In the approach used, consensus is measured by opinions only, and is differentiated from beliefs, which Ginsberg [39] describes as a difficult concept with several interpretations. 'Opinion' has been previously defined, and 'belief' is defined as the holding of a particular view, without necessarily having conclusive evidence that the view is correct [38]. From a wider perspective, belief is considered to be a component of attitude [40], which incorporates a large amount of cognitive structuring [41], which may not be easily reversed, and which concentrates on a smaller aspect of an individual's life space [38]. By contrast, opinions are more easily reversed, and represent cognitive summaries of the thought process along the way [41]. 'Opinion' in this sense is more suitable for the study than 'belief', where we seek to measure cognitive changes due to participation in a strategy process.
Questions were developed by studying strategy [72, 42, 43, 44, 45, 46, 47, 48, 49, 50] and cognitive psychology, including cognitive dissonance theory [51]; as well as studying attention to planning and selection for action [52], active participation theory [53], mental frames, insight, and the solution to ill-structured problems [54].
Statements and questions that are analysed appear in the Appendix. They come from pre- and post-setting strategy tools, consisting of a total of 43 and 42 questions respectively.
2.2.2 Issues of validity and reliability of questionnaire design
In the case of validity, face, criterion, and construct validity are addressed. Bailey [55] sees the three components as hierarchical, with face validity being the first requirement, leading to criterion validity, which in turn leads to construct validity. Face validity is defined as "the extent to which differences found with a measuring tool reflect true differences among respondents being tested" [56]. Bailey explains further: "face validity is ultimately a matter of judgement. [it] is simply assessed by the [researcher] studying the concept to be measured and determining, in his or her best judgement, whether the instrument arrives at the concept adequately. if the measure clearly measures another concept, then obviously it does not have face validity. However if the item does not seem to be measuring any recognisable concept other than the one it is supposed to be measuring, the instrument can be said to have face validity" [55]. Face validity was mainly relied upon, as the measuring instrument had no precedent of similar measures for comparison with both criterion validity and construct validity.
Reliability may be defined as follows: "a measure is reliable to the degree that it supplies consistent results" [56]. Reliability is recognised as a contributor to validity, and is a necessary but not sufficient condition for validity. The reliability measurement that was applied considered the internal consistency of the measuring instrument, using coefficient alpha [58]. Both single response (single-item) and multi-item questions are used in the measuring instrument. Fredrickson [59] also uses single response and multi-item questions in his measuring instrument. Single items are generally regarded as weak in demonstrating reliability [60]. Nevertheless, their use is implicitly recognised where the instrument is at an early stage of development and has no precedents - assuming that adequate precautions are taken to minimise errors [61, 62]. In addition, difficulties in developing an initial pool of items for a new instrument using a multi-item scale [63] favour the inclusion of single- items in scales. Although pre-testing of the instrument was limited, precautions were taken to minimise errors, thus ensuring that findings were reliable. As Peter [64] says, "reliability can be defined broadly as the degree to which measures are free from error and therefore yield consistent results". An important expected source of error is a misunderstanding of the questions, or a mistaken scoring of positions on the scale [65]. Although Nunnally [60] is of the view that Cronbach's coefficient alpha is sufficient for determining reliability in most situations, he nevertheless recognises that "potentially there are...sources of measurement error that are not considered by coefficient alpha", and indicates that the use of alternative approaches in addition to alpha may be "informative". Guilford [65] argues that certain misinterpretations may be missed even by high reliability scores - "the fact that we obtain high reliability of score is no assurance...for...personal deviations in interpretation" - and suggests that "any method that will serve to stabilise individual interpretation of words will go a long way to improve...measurement". To minimise errors, ways of triangulating results should be considered.
An attempt was made to keep the questions simple and clear to avoid ambiguity. In addition, some multi-item questions were asked. Altogether 20 single-response questions and 17 multi-item questions were asked (see Appendix). The multi-item questions were made up of three items on clarity of strategy, two items on operations, three items on consultants, two items on implementation, two items on agreement on priorities, three items on beliefs in participation, and two items on beliefs in representation5. Priem et al [23] also use two-item multi-scales to determine reliability after applying their process. The recommended minimum value is 0.70 for preliminary stage measuring instruments [60]. In the same way, Fredrickson [59] applies Cronbach's coefficient alpha on the multi-items he used to demonstrate the internal consistency of his instrument.
2.2 Determination of consensus
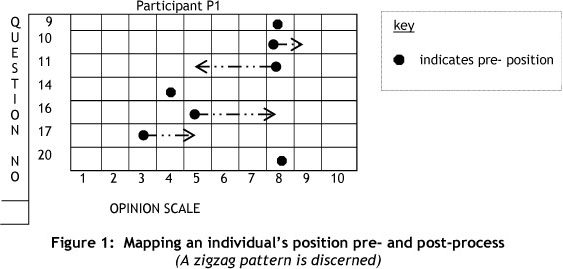
Figure 1 displays a participant's pre- and post-opinions. It shows that the participant scored 8 for question 9, and has not shifted pre- to post-process. For question 11, this participant scored 8 pre- and 5 post-process, and has shifted as indicated by the arrow. Figure 2 diagrammatically represents the data to display movement. Arrows indicate a shift from the pre-process position to the post-process position, which can then be analysed.
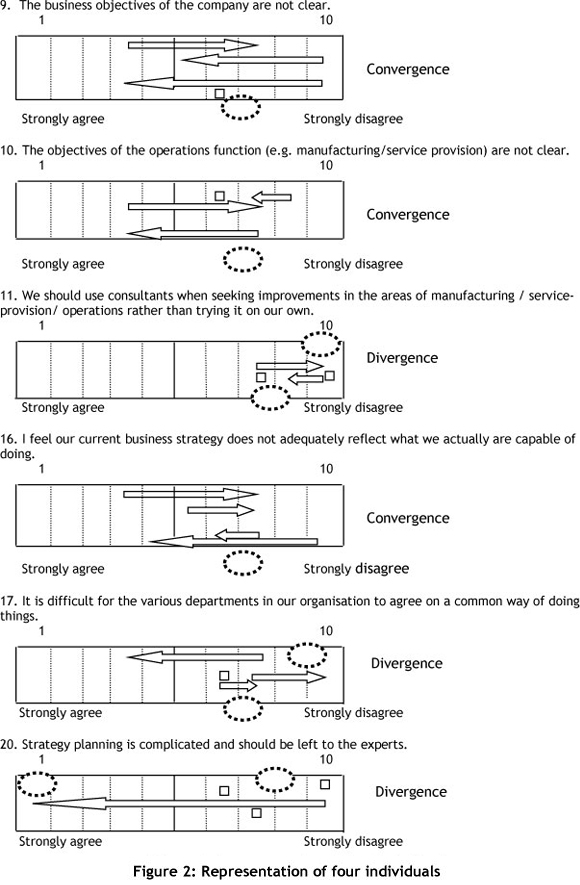
When two or more individuals are considered together, however, a direct and useful comparison of movements is achieved, as illustrated below (Figure 2) for four individuals who participated in an actual strategy session. The configuration produces an effect that seems to reflect interactions among the individuals. The arrows represent shifts in the opinions of individuals; the small square represents 'no-shift' in opinion, and the cycle (ellipse) indicates an apparent focal point.
Convergence and divergence are found by virtue of movements in opinion. If all participants arrive at the same opinion - shown by all participants scoring the same position on a measuring scale - then perfect convergence occurs. If participants score diametrically opposite positions on the scale, then perfect divergence occurs. On the other hand, if there is no movement in opinion from any of the participants, a no-change situation is said to have occurred. However, since either perfect convergence or divergence is rare, other criteria are needed to determine convergence and divergence. The approach used here introduces the concept of 'apparent focal point' to assist in decision making. The decision whether there is convergence or divergence, however, presents some difficulty when the decision depends primarily on the proximity of opinions. When the question, 'How close is close enough to decide convergence?' is raised, it elicits a highly subjective response. Additional criteria are needed for decision-making, and the approach used tries to improve decisions by locating an apparent focal point where opinions seem to meet, taking into account other factors such as the shifts made, their directions, and the number of people involved.
To deal with whether or not there is focus in a group, the term 'apparent focal point' is introduced to deal with the practical difficulty of locating focal points. When the opinions of two people are considered, it is relatively easy to recognise convergence by observation; but when more people are considered, the pattern of movement becomes confusing and guidelines are required. The guidelines given here aim to provide a holistic perspective of the patterns. The objective is to ensure that convergence is reliably differentiated from divergence, and that consistency is maintained throughout any analysis.
The key decision factor used is 'proximity of end-position' (post-process position on the scale) following the occurrence of movement. In some cases this criterion may be sufficient to make a decision, and other factors are then taken into account - in particular the 'direction of movement', 'magnitude of movement', and 'origin of shifts' on the scale. So to decide whether there is convergence, divergence, or no change in a group decision, criteria need to be set. The guidelines are as follows:
1. Only cases where movement has taken place are considered for convergence or divergence. A case where there is no shift at all is categorised as 'no-change'.
2. Proximity of the end positions of all participants is the most important decision factor, and is sufficient to establish convergence if the existence of the focal point or apparent focal point is established.
3. An apparent focal point is often the average of the end points, but need not necessarily be so. The technique of observing 'where arrows seem to be pointing' (arrows indicate shifts) can be useful in locating the apparent focal point, but it needs to take other requirements into consideration, especially that of proximity. Two cases follow to illustrate:
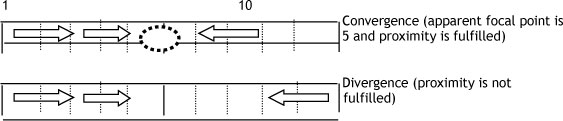
In both cases, two individuals on the same side of the scale decrease their opinions towards uncertainty regarding the issue. Being on the same side, their shift in the same direction is a tendency towards convergence. But the third individual, who is on the opposite side of the opinion scale, has a different position in each case. In the first case he indicates a strong concurrence with the other two participants. In the second case, however, he retains a strong opposite opinion, resulting in two apparent focal points (5 and 8) instead of one.
4. Since unanimous converging (all participants converging) is uncommon, convergence of the overwhelming majority is accepted as representing overall convergence, but with some restrictions, as follows:
- If five participants are considered where four converge and one diverges, overwhelming-majority convergence will have occurred. But if three converge while two diverge, then divergence occurs.
- If four participants are considered where three converge and one diverges, overwhelming-majority convergence will have occurred. But if two converge and two diverge, divergence occurs.
- If three participants are considered where two converge and one diverges, convergence is considered to have occurred. This is to allow for the inclusion of overwhelming-majority cases.
In other words, at least a two-thirds majority is sought.
5. Although slight movements of one step are generally considered insignificant, where the other movements are also slight - such as two steps - they may be considered to assist in analysis. However, a shift that crosses from one side of the opinion scale to the other is considered radical, and will weigh considerably in favour of convergence if the majority of participants are positioned on that side.
6. Although stationary participants are not considered in the analysis if shifts are absent, their positions play a central role where shifts take place in determining convergence. For example, if a shift is towards the position of several stationary participants, then convergence is indicated. The stationary participants in this case become the apparent focal point.
Once the instrument has been designed, it needs to be tested. The methodology used is considered next.
3. METHODOLOGY
After describing the experimental setting in Section 1, and setting out the design of the questionnaire, its associated validity and reliability issues, and the determination of consensus in Section 2, this section on methodology considers the logistics associated with the experiment. Comments are confined to the sampling method used, the research design, issues of validity, the reliability of the research process, and the logistics of the experiment.
Companies were co-opted into the study through a 'captive' audience [55]. Full-time employees from various engineering companies who were attending postgraduate evening classes were required to facilitate a given strategy formulation process in their companies as part of their work. They were introduced to a specific strategy formulation process developed by Mills et al [72] (abbreviated to CWBF6) and trained to facilitate it. They reported back on their experiences through group discussion, a written report, and a presentation. To increase the number of companies participating, the study was repeated the following year with another group of employees and a different set of facilitators, thus collecting data over two years.
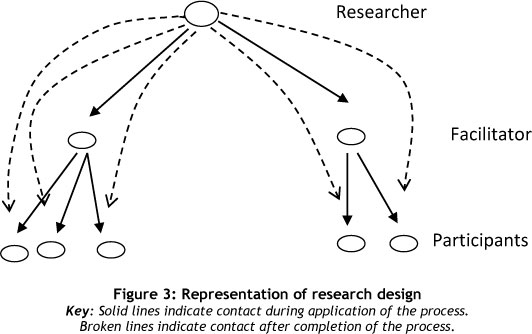
The research design uses facilitators, researchers, and participants, and everyone stays exclusively in one of these three classes (see Figure 3 below). This design tries to improve the validity of results when, for example, a researcher inadvertently transmits signals of expected behaviour to research subjects, causing them to behave in the manner that the researcher wants (called 'reactivity' by Bailey [55]). Bailey says that "a reactive research technique is one whose application causes a reaction on the part of the person being studied in such a way that the data is affected" [55], as shown in the Hawthorne effect [69]. To reduce reactivity during the strategy formulation process, only the facilitators had contact with the participants; the researchers received feedback through the facilitators. This prevented the researchers from directly causing reactivity in the participants. As facilitators could cause reactivity in participants, the facilitators were not told that research was being conducted. They saw the exercise as an opportunity for their organisations or sections to try out new procedures in strategic planning. Their task was therefore to try out the procedures in an actual planning session, and to report whether the procedures worked for their companies. Other researchers have used similar 'blinding' precautions (for example, the widely-recognised use of placebos in medical research).
Although this is seen as deception by some authors [70], others argue that it is an acceptable precaution when research purposes justify it and it is responsibly managed [71]. During this research, professional norms were maintained regarding confidentiality, etc.
Seventeen companies were initially co-opted into the study, although five were disqualified when it was discovered that the strategy process had not been done correctly. Twelve companies qualified for final analysis. They represent diverse industries, including breweries, chemical processing, electricity utilities, steam utilities, rail transportation, plastic products, project management, engineering consulting, communication equipment, and information technology consulting. Company sizes range from a four-person firm in a residential apartment to some with thousands of employees working in different locations. The companies have been in existence from a few months to more than thirty years. From these companies, forty-six people participated in the strategy process, excluding the twelve facilitators.
During the strategy process conducted in workshops, participants were guided through the CWBF strategy formulation instrument by facilitators, creating a conducive environment for consensus [73]. The CWBF process has six parts that are sequentially arranged. The first four represent planning stages and the last two represent implementation stages. Participants were taken through the planning stages over a period of four to five weeks, with an average of twelve to fifteen hours of total contact time. Participants were given two questionnaires to fill in, one before the process began and another after the completion of the process. The time difference between filling in the two questionnaires and the fact that questions not used were changed, decreased the chance of participants remembering and repeating answers.
3.1 Issues of validity and reliability in the research process
For the face validity of CWBF we appeal to the overseas work undertaken by Mills et al [72]. For face validity of the instrument, scrutiny by three persons ('experts') who had experience using the instrument helped to improve face validity. They were, however, limited by lack of intimate knowledge, required to ensure that the content was "exhaustive" and "mutually exclusive" [57].
The reliability measurement applied considered internal consistency of the measuring instrument - using coefficient alpha [58] - and both single-response (item) and multiple- item questions were used in the measuring instrument. Single items were used when the instrument was at an early stage of development, and because of difficulties in developing an initial pool of items for a new instrument using a multi-item scale. Although pre-testing of the instrument was limited, precautions were taken to minimise errors to ensure that findings were reliable. An important expected source of error is misunderstanding the questions, or mistaken scoring of positions on the scale. To minimise such errors in findings, action was taken at three levels: the measuring instrument level, participant level, and facilitator level.
At the measuring instrument level we obtain Cronbach's coefficient alpha of 0.75, raw (0.74, standardised) for the 17 multi-items using SAS V8 software. This meets the recommended value of 0.70 for preliminary stage measuring instruments [60]. At participant level, each participant was personally interviewed after the process and taken through the questionnaires to check their responses. Differences in pre- and post-responses, especially relatively large differences, were checked for accuracy, checking whether they had been accurately represented. This resulted in adjusting a few responses and in dropping one question [1] from analysis. Some respondents pointed out that this question did not mean the same thing as when it was first asked. Checking reliability directly with respondents is not common during research, but it is useful to confirm the presence of shifts or movements, and to probe what is hidden underneath. At the facilitator level, further checking was done to corroborate information obtained from participants. Facilitators were interviewed to gain insight into the reactions and attitudes of participants during the strategy sessions. This information was then compared with that which participants themselves gave regarding the process. This provided useful external triangulation of the information obtained from participants.
3.2 Questionnaire logistics
Using strategy sources - knowledge of the strategy [71] formulation process of creating a winning business formula (CWBF) instrument, and prior experience with the process - areas were selected that seemed likely to affect participants' opinions. To measure movement in each participant's opinion, 22 of the total questions asked in the first questionnaire were repeated in the second questionnaire. Expert scrutiny of the questionnaire [60] needed people who had a working knowledge of the CWBF instrument. Three people were found who met this criterion: one was a practising manager with a master's degree; another was a master's degree student with previous managerial experience; and the third was a university lecturer with a PhD and previous managerial experience. Using their prior experience with the CWBF instrument in strategy formulation, they scrutinised the questionnaire to check whether the questions were clear, simple and made sense. Some changes were made following their comments (mainly rewording for better clarity) and a few questions were dropped. Proper pilot testing [60] could not be done, as this would need a pool of participants who had recently been exposed to this strategy process, and such test participants were not available. Eighteen questions were finally considered for the detection of movement that all used the same 10-point Likert-type scale [74], ranging from 'strongly agree' to 'strongly disagree' (or vice versa). The 10-point scale was intended to increase the sensitivity of the instrument to detect slight movements. No neutral point was provided in the scale to force respondents to choose either one way or the other ('agree' or 'disagree').
Questionnaires were hand-delivered by facilitators to participants and returned to the researcher the same way. The first set of questionnaires (pre-process) was returned before or soon after the process began. The second set of questionnaires (post-process) was returned once the process was over. The response rate was considered to be those who filled in and returned both the pre- and post- questionnaires. 29 people out of 46 returned both questionnaires, but only 27 were considered for analysis (59%) as two of the individuals were the only ones among their fellow participants who returned the questionnaires. Non-respondents are those who filled in only one questionnaire, and the reasons for their lack of response were investigated. The reasons varied, but included retrenchments or restructuring in the organisation; suspicion of the process by a senior manager who refused his employees any contact with external persons through questionnaires; a resignation; being away on leave; being away on duty; and being too busy. Analysis of non-respondents showed diversity in age, hierarchical position, type of industry, and education. Thus no systematic bias was indicated.
4. RESULTS AND ANALYSIS
4.1 Determination of consensus
The location of a focal point is still subjective, since two people may disagree on the exact location of a focal point. Using decision criteria helps reduce subjectivity by keeping decisions consistent within a restricted margin. The questions indicated come from questions used in the questionnaire (see Appendix), with one group of participants being scored [66]. Arrows and squares indicate each individual opinion: opinions that have shifted are indicated by arrows, and those that have not shifted are indicated by squares. Once convergence, no change, and divergence have been established for all groups and questions, these are tabled below (Table 2).


4.2 Analysis
The results in Tables 1 and 2 are not from a random sample, and are based on ten companies. From these companies, 27 paired questionnaires were returned (pre- and post- process questionnaires) and were used for analysis. Overall movement among individuals occurs about 75% of the time, and no-change about 25% of the time. Three conditions were identified: convergence, divergence, and no-change. Overall there is about 60% convergence, 35% divergence, and 5% no-change among the strategy teams.
Total movement was counted 341 times and no-change 118 times (Table 1). In our opinion, with a one step in movement, there is doubt whether a shift has taken place or not, and these results are removed from further analysis that considers the significance in difference between movement and no-change. When the one step movements are removed (see Table 1, column five), there are generally more incidences of movement than no-change, but not always. Two out of 17 questions (Table 1) show that no-change occurs more often than movement. Two other questions indicate a small difference between the incidences of movement and no change, of one or two extra occurrences for movement. To test hypothesis (a) that participants will shift their opinions in a strategy process, the difference between movement and no-change (Table 1) is tested for significance. Non-parametric statistics are used - as no distribution is specified - to test the two columns in Table 1.
Using Wilcoxon's signed ranks test:
N = 17, Sum of positive differences T+ = 114, Sum of negative differences T- = 3
For N = 17, we use the formula: z = {T+ - N(N+1)/4} /{N(N+1)(2N+1)/24} [67].
Substituting values we obtain: z = 1.776 which gives p-value = 0.0379 [67].
This indicates that the frequency of occurrence of movement, when one-step movements are ignored, is significantly greater than no-change at the 5% level.
Since one step movements (34% of total movement) are ignored, the significant level obtained is based on a reduced proportion of 66% total movement.
To test hypothesis (b) that shifts will tend to converge rather than to diverge, the difference between convergence and divergence (Table 2) is tested for significance. Non- parametric statistics are used, as no distribution is specified, to test the two columns in Table 2. Using Wilcoxon's signed ranks test:
N = 10, Sum of positive differences T+ = 50, Sum of negative differences T- = 5; statistical tables give p-value = 0.0098 [67].
This indicates that the frequency of occurrence of convergence is significantly greater than divergence at the 1% significant level.
Comparing divergence with convergence descriptively, the data indicates that divergence is predominant in two companies (D and G) out of 10 (20%), while convergence predominates in the rest. In three companies (B, F and H), or 30% of total companies, divergence occurs at least 70% as many times as convergence. Hence in five out of ten companies (B, D, F, G, H) divergence is a prominent factor.
During interviews to confirm movement, some respondents were guarded or evasive about information they provided in the questionnaires, irrespective of whether they had shifted their opinions or not. However, when shown the response they had given in the questionnaire, they opened up and volunteered more information. For example, in company J one participant was evasive on question 29; in company K one participant was evasive on question 36; and in company A the sole respondent was evasive on question 33 - until they saw their responses. Another participant in company J was reluctant to discuss information he had indicated in the post-process questionnaire, saying it was 'sensitive', until reassured about confidentiality. From these experiences, we think that the data collected represents hidden thoughts as well as those in the questionnaires.
5. DISCUSSION
Results of this analysis show that movement in opinion is more likely in the strategy process when compared with absence of movement, using a conservative view of movement. Hypothesis (a) is therefore supported, indicating that participants in a strategy process are likely to shift their opinions. The strong likelihood of movement occurring in strategy processes makes the study of movement a potentially useful direction to pursue in order to gain further insight into consensus. Movement is thus a reliable indicator for consensus measurement.
The results of analysis also show that the occurrence of convergence is significantly more frequent than divergence in the majority of companies studied. Hypothesis (b) is therefore supported that shifts in the strategy process will tend to converge rather than to diverge. However, divergence plays an important role and cannot be ignored, given that overall it occurs 61% as many times as convergence. In 20% of the companies studied, divergence dominates the outcome of deliberations, and in another 30% it shows a marked influence. This strong presence and influence of divergence makes it an important dimension to consider during consensus measurement. Divergence is assumed to represent disagreement, just as convergence represents consensus. The results suggest that consensus measurements should take into consideration both agreements and disagreements. Markoczy's [31] approach when determining consensus, based on Langfield-Smith & Wirth's work [32], assumes that participants either perfectly agree or disagree - that is, "the values -1, 0 or +1" [32] are used. Their assumption does not provide for situations where there is a range of options between perfect agreement and total disagreement. Instead, the situation 'in- between' is calculated based on the assumption: "the greater the average distance between ... the smaller the level of consensus ... and the smaller the average distance the greater the consensus level" [31]. This procedure reflects the same weakness noted earlier in traditional measuring instruments, where the occurrence of consensus is judged based on whether 'there has been a move towards consensus', without probing this movement further. Not only should measuring instruments consider both agreement and disagreement when determining consensus, they should be able to account for situations that occur when there is other than perfect agreement.
The incidences of no-change among the studied teams of participants indicate a maximum occurrence of 5.3% of the total incidences. Although this appears low from a team-level perspective compared with consensus and divergence, the percentage of no-change is higher at 25.7% - when viewed at individual level - compared with general movement. It appears that at individual levels the occurrence of no-change may be higher than that perceived within groups. It is not clear what this absence of movement means. It may be that an individual's thoughts indicate no change because they have been reinforced as being correct, so that the process provides the influence needed not to change their opinion. Alternatively, the individual may have convinced others about his/her point of view, or the individual is simply resistant to change. On the other hand, a qualitative examination seems to indicate that incidences of no-change reduce as the number of participants increases, which may indicate a tendency for people to become more convinced and alter their views as they hear from a wider variety of opinion. laquinto & Fredrickson [25] have raised this point of participant size in a group; and although they did not find significant results to support it, there may be a need to revisit it. The apparent indication in the results here - that the perception of no-change at individual level and at group level may be different - adds to the questions. The category of no-change presents further challenges for a better understanding of consensus.
5.1 Discussing the perspective represented in diagrams
The diagrammatic representation used demonstrates the need to be more specific about the extent of movement towards consensus, and illustrates that to simply imply there has been 'a move towards consensus' is not sufficient (inconclusive) since a number of options are available. Some of these may be mistaken for consensus, as illustrated by the example given in question 17 in Figure 2. These examples show that misinterpretation of consensus, otherwise called 'false' consensus [68], can take place, and so there is a need to be more specific. The implication is that researchers need to pay greater attention to how they judge the occurrence of consensus.
The argument by Shanley & Correa [13] that there may be other dimensions to contend with in consensus, or that there may be a possible amalgam of components [15], is strengthened by the perspective represented in the diagrams. This argument is expanded by Floyd & Wooldridge [17] who believe that there could be a latent component "hidden underneath" a manifest component. This seems to be the case in question 11 of Figure 2, where the proximity of positions suggests convergence, and yet the relative movements indicate differences in foci. Similarly, Shanley & Correa [13] share a multi-dimensional view of consensus, but suggest a different form in which it might present - that of an 'actual' component and an 'apparent' component - such that the question of 'accuracy' becomes important. Their view also seems to be supported in the diagrams by the illustration in question 11 of Figure 2. This illustration indicates that there is need for accuracy, since either convergence or divergence may be interpreted to have occurred. In addition, Shanley & Correa's view [13] is further supported in the illustration in question 11 of Figure 2, which demonstrates a situation where one condition can be apparent while the other is actual. For example, convergence may be apparent while divergence is actual (or vice versa). From the examples given, support for the multi-dimensional view of consensus is demonstrated using the perspective represented in the diagrams.
Priem [15] suspects that traditional measures of consensus may inherently reflect the level of conflict or disagreement that occurs during the ongoing process of strategy decision- making. Floyd & Wooldridge [17] suspect that important differences may be taking place underneath. The illustrations given in Figure 2 seem to support their view - for example, in the responses to question 10, where consensus is indicated and yet an important difference by one of the participants seems to take place.
Priem [15] raises the prospect of dynamism in consensus, as do Wooldridge & Floyd [17]. The perspective used here, represented in Figure 2, suggests dynamism in consensus. By representing consensus by movement and apparent interactions, dynamism is illustrated. Priem [15] conceptualises a 'process' component and an 'outcome' component of consensus, which seem to describe the representations used in this paper as follows: the movements and apparent interactions in the diagrams may be interpreted as 'process', while their consequence - for example, convergence - may be interpreted as an 'outcome'.
The diagrammatic representations appear to be further strengthened by a qualitative observation made during the study. During the interviews, some participants were reluctant to discuss information that they had given in the questionnaires: they were guarded or evasive. However, when shown their responses, they opened up and volunteered further information. From these experiences, it appears that the information gathered in the approach used combines both apparent and some otherwise hidden thoughts. The implication is that both latent and manifest thoughts exist, into which this approach was able to tap. It may be argued that the representations given in the diagrams portray both latent features and manifest features, further supporting the notion that consensus is made up of at least a latent component and a manifest component, or is multidimensional in nature.
5.2 Limitations
Caution needs to be exercised in interpreting the results, since criterion and construct validation was not done, and the pool of multi-items that was used to test internal consistency is limited. The method too is limiting. It is tedious when many companies and participants are involved, particularly when checks have to be made by interviewing participants to see whether or not the process was carried out properly. This limits its wider application. The decision rules also become constrained and difficult to manage when there are many participants (ten or more). This leads to the diagrammatic representation of movement becoming confusing and difficult to interpret.
Since a pool of people with exposure to the process was not available, pilot testing was not carried out, and subsequent adjustments were not possible. Comparison with existing methods to provide necessary control was not undertaken.
6. CONCLUSION AND FURTHER RESEARCH
This paper argues for an alternative perspective of consensus measurement, and makes a contribution by demonstrating this. Convergence is introduced as an important indicator of consensus, and is used to operationalise consensus from an alternative perspective of movements and apparent interactions that can be diagrammatically represented to construct a measuring instrument. The representation approach seems to fit with, and explain, other perspectives conceptualised by authors who call for an alternative perspective of the consensus concept [15, 17, 13]. It would appear therefore that researchers calling for a fresh look at consensus are vindicated by this work.
The paper also demonstrates the need to tighten the criteria used to judge the occurrence of consensus in order to establish whether or not consensus takes place among participants. It agrees with and extends the concerns of other authors [24], that the problem of contradictory findings noted in the consensus literature may be due to defects in the consensus measuring instruments that have escaped the scrutiny of researchers, leading to erroneous identification of consensus. Within the limitations of the study, the findings suggest that consensus should be treated as a multidimensional construct by researchers -. at the least by categorising consensus into 'true' consensus and 'pseudo' consensus. Following on from this, multidimensions used need to be appropriately defined, operationalised, and - importantly - built into the measuring instruments. This paper contributes by proposing the use of three dimensions in the measuring instrument: convergence, divergence, and no-change. Convergence defines consensus and is located by a focal point. The paper proposes the use of decision criteria, which could be further refined and tightened by researchers. The instrument is empirically grounded where data from several companies are measured.
Another contribution made is to introduce a time dimension into the measuring instrument itself, enabling the instrument to tap into and portray the element of dynamism in consensus. This characteristic differentiates it from traditional measuring instruments, where consensus is usually determined at static points in time - for example, at two ends of a given time line with consensus indicated at each end, such an instrument is said to use a longitudinal design [22] and is the traditional approach. The instrument in this paper is described as incorporating a longitudinal design into its measurement, as opposed to the cross-sectional designs that characterise traditional approaches.
Fourthly, the paper pays attention to the concept of disagreements in consensus-related research. It argues that indications of disagreement need to be specifically scrutinised, even though the overall outcome is consensus. It proposes that knowledge of underlying disagreements may provide further insight into decisions reached - for example, patterns associated with sustainable agreements or with tenuous agreements. Priem et al have called for ways to be devised of measuring conflict that takes place during decision-making, noting that, "research... has yet to directly measure the level of cognitive conflict that occurs during decision making" [23]. Studying divergence in the diagrammatic representations used in this paper provides the opportunity to study disagreement or conflict in decision-making.
Finally, the paper provides an understandable and practical tool that people can use to determine consensus within company settings during strategy sessions.
Future work should look at ways of improving the measuring instrument, including the following areas: refining and expanding decision rules to accommodate times where participant numbers are higher than those investigated here (ten and more); automating the approach to simplify data analysis so as to increase its applicability; upgrading the instrument to demonstrate criterion validity and construct validity; developing constructs to enable formal testing of various hypotheses; and improving and increasing the pool of multi-item measures used, to prevent the need for follow up interviews. The latter would increase its capacity for wider application.
The perspective of consensus as movement currently raises more questions than answers. For example, what factors cause movement, how can the factors responsible be ascertained and measured, and why do some people shift their opinions more than others? The causes of movement should be investigated for further insight into consensus. These lines of inquiry offer promise for the way forward, noting that the questions - giving rise to further inquiry - are associated with cognitive rather than emotional efforts [17]. Dess & Priem [29] believe that research into cognitive efforts offers hope for further insight into consensus. This direction should be pursued. A related question is: what does the lack of movement by an individual signify? The presence of no-change is inadequately explained and needs further investigation. Linking movement with cognitive factors also seems to offer promise for the way forward in this aspect.
The relationship between consensus and other variables, like performance, has not been investigated in this paper. Future researchers may wish to do so, using the consensus approach suggested here. Measurement may extend to include implementation and other strategy formulation processes, testing the robustness of the approach.
The effect of environmental factors in the results is unknown. Although they have been assumed to be controlled or randomised for in the design, they have not been specifically considered. An investigation of environmental influences should be considered in future work.
APPENDIX: Questionnaire10
The questionnaire attempts to deal with the multi-dimensional nature of consensus for a standard strategy formulating process.
(‘*’ indicates questions used for the multi-item scale)
(‘+’ indicates questions which have a reversed response ranking)
Repeated items
(10- point Likert scales used)
*Qu 9: The business objectives of the company are not clear.
*Qu 10: The objectives of the operations function (e.g. manufacturing/service provision) are not clear.
*Qu 11: We should use consultants when seeking improvements in the areas of manufacturing/ service-provision/ operations rather than trying to do it on our own.
*Qu 14: It is better to hire consultants who know their job than train somebody internally to facilitate the process of long-term learning. +
*Qu 16: I feel that our current business strategy does not adequately reflect what we actually are capable of doing.
*Qu 17: It is difficult for the various departments in our organisation to agree on a common way of doing things.
*Qu. 20: Strategy planning is complicated and should be left to the experts.
*Qu. 23: Agreement on priorities is difficult to achieve in the organisation. +
Qu. 24: If a company follows 'best practice manufacturing strategies' e.g. just in time, total quality management, world class manufacturing, etc., there is no need for other strategies.
Qu. 29: Implementation stage is easy, while the planning stage is more difficult.
*Qu. 31: The question "how can manufacturing/ services/ operations contribute to the competitive advantage of this business?" should be left to senior managers to decide.
*Qu. 32: What finally gets implemented in our company is less than a half of what was planned at the beginning.
*Qu. 33: All departments should be represented at strategy planning sessions.
Qu. 35: There should be a tighter control on manufacturing/ operations to keep it in line with the rest of the organisation.
Qu. 36: Manufacturing/ operations can supply performance and/ or capabilities in a way that influences business and marketing strategy.
*Qu. 38: Implementation is the responsibility of operations people while senior management makes the plans. +
*Qu. 39: We don't always understand how our strategies are realised. What gets planned is not what gets implemented. +
*Qu. 40: Everybodies view is important and should be represented at strategy planning. +
Not repeated
(10-point Likert scale used).
*Qu.18: Many new plans although exciting at introduction stage do not get implemented.
*Qu.19: A long term plan that is readily understood by most people in the organisation would improve the way we do things in the company.
*Qu.25: Strategy planning should be left to senior management level. +
Checking items
Qu.7: Does the company hire consultants to help in improving manufacturing /services provision /operations practices? (Choose one of the following) often; sometimes; never; I don't know.
Qu.13: Some of our plans get implemented while others do not. The percentage that gets implemented is:
very low (0-20%), low (20-40%); medium (40-60%); high (60-80%); very high (80-100%).
Qu.34: Manufacturing/ operation works in a way not in line with the company business objectives. (Choose one of the following) often, rarely, always, never, I don't know.
Qu.42: For a company without 'best practice manufacturing strategies' e.g. just in time, total quality management, world class manufacturing, etc., (choose one of the following):
a) it should seek to get one as soon as possible b) it should not adopt 'best practice strategy' until it has carefully studied whether it is good for the company c) I don't know d) Other (please specify)
Omitted during analysis
Qu. 35: (Initially as given above was changed in the post- questionnaire to read:) Manufacturing/ operations does not need a tighter control but guidance through strategy exercises such as this one.
REFERENCES
[I] Selznick P. 1949. T.V.A. and the grassroots. University of California Press: Berkeley. [ Links ]
[2] Tilles S. 1963. How to evaluate corporate strategy. Harvard Business Review 41: 111-121. [ Links ]
[3] Mills, J.F. & Platts, K.W. 1996. Manufacturing strategy. In International Encyclopedia of Business and Management, Warner M (ed.) 4: 3126-3141. [ Links ]
[4] Whyte, G. 1989. Groupthink reconsidered. Academy of Management Review 14(1): 40-56. [ Links ]
[5] Bourgeois, L.J. 1980. Performance and consensus. Strategic Management Journal 1: 227-248. [ Links ]
[6] Dess, G.G. 1987. Consensus of strategy formulation and organisational performance: Competitors in a fragmented industry. Strategic Management Journal 8: 259-277. [ Links ]
[7] Stevenson, H.H. 1976. Defining corporate strengths and weaknesses. Sloan Management Review Spring: 51-68. [ Links ]
[8] Drucker, P.F. 1971. What we can learn from Japanese management. Harvard Business Review March-April: 110-122. [ Links ]
[9] Joshi, M.P., Kathuria. R. & Porth, S.J. 2003. Alignment of strategic priorities and performance: An integration of operations and strategic management perspectives. Journal of Operations Management 21: 353-369. [ Links ]
[10] Schweiger, D.M., Sandberg, W.R. & Ragan, J.W. 1986. Group approaches for improving strategic decision making: A comparative analysis of dialectical inquiry, devil's advocacy, and consensus. Academy of Management Journal 29(1): 51-71. [ Links ]
[11] Tjosvold, D. & Field, R.H. 1983. Effects of social context on consensus and majority vote decision making. Academy of Management Journal 26(3): 500-506. [ Links ]
[12] Hart, S., Boroush, M., Enk, G. & Hornick, W. 1985. Managing complexity through consensus mapping: Technology for the structuring of group decisions. Academy of Management Review 10(3): 587-600. [ Links ]
[13] Shanley, M.T. & Correa. M.E. 1992. Agreement between top management teams and expectations for post acquisition performance. Strategic Management Journal 13: 245-266. [ Links ]
[14] Dess, G.G. & Origer, N.F. 1987. Environment, structure, and consensus in strategy formulation: A conceptual integration. Academy of Management Review 12(2): 313-330. [ Links ]
[15] Priem, R.L. 1990. Top management team group factors, consensus, and firm performance. Strategic Management Journal 11: 469-478. [ Links ]
[16] Grinyer, P.H. & Norburn, D. 1975. Planning for existing markets: Perceptions of executives and financial markets. The Journal of the Royal Statistical Society. Series A 138(1): 70-97. [ Links ]
[17] Wooldridge, B. & Floyd, S. 1989. Research notes and communications: Strategic process effects on consensus. Strategic Management Journal 10: 295-302. [ Links ]
[18] Knight, D., Pearce, C.L., Smith, K.G., Olian, J.D., Sims, H.P., Smith, K.A. & Patrick, F. 1999. Top management team diversity, group process, and strategic consensus. Strategic Management Journal 20: 445-465. [ Links ]
[19] Floyd, S.W. & Wooldridge, B. 1992. Managing strategic consensus: The foundation of effective implementation. Academy of Management Executive 6(4): 27-39. [ Links ]
[20] Stagner, R. 1969. Corporate decision making: An empirical study. Journal of Applied Psychology 53(1): 1-13. [ Links ]
[21] Homburg, C., Krohmer, H. & Workman, J.P. 1999. Strategic consensus and performance: The role of strategy type and market related dynamism. Strategic Management Journal 20: 339 357. [ Links ]
[22] Schweiger, D.M., Sandberg, W.R. & Rechner, P.L. 1989. Experiential effects of dialectical inquiry, devil's advocacy, and consensus approaches to strategic decision making. Academy of Management Journal 32(4): 745-772. [ Links ]
[23] Priem, R.L., Harrison, D.A. & Muir, N.A. 1995. Structured conflict and consensus outcomes in group decision making. Journal of Management 21 (4): 691-710. [ Links ]
[24] West, C.T. & Schwenk, C.R. 1996. Top management team strategic consensus, demographic homogeneity and firm performance: A report of resounding nonfindings. Strategic Management Journal 17: 571-576. [ Links ]
[25] Iaquinto, A.L. & Fredrickson, J.W. 1997. Top management team agreement about the strategic decision process: A test of some of its determinants and consequences. Strategic Management Journal 18: 63-75. [ Links ]
[26] Whitney, J.C. & Smith, R.A. 1983. Effectiveness of group cohesiveness on attitude polarization and the acquisition of knowledge in a strategic planning context. Journal of Marketing Research May: 167-176. [ Links ]
[27] Hrebiniak, L.G. & Snow, C.C. 1982. Top management agreement and organisational performance. Human Relations 35(12): 1139-1158. [ Links ]
[28] Senge, P.M. 1990. The fifth discipline: The art and practice of the learning organization. Doubleday: New York. [ Links ]
[29] Dess, G.G. & Priem, R.L. 1995. Consensus-performance research: Theoretical and empirical extensions. Journal of Management Studies 32(4): 401-417. [ Links ]
[30] Bourgeois, L.J. 1985. Strategic goals, perceived uncertainty, and economic performance in volatile environments. Academy of Management Journal 28(3): 548-573. [ Links ]
[31] Markoczy, L. 2001. Consensus formation during strategic change. Strategic Management Journal 22: 1013-1031. [ Links ]
[32] Langfield-Smith, K. & Wirth, A. 1992. Measuring differences between cognitive maps. Journal of the Operational Research Society 43(12): 1135-1150. [ Links ]
[33] Markoczy, L. & Goldberg, J. 1995. A method of eliciting and comparing causal maps. Journal of Management 21(2): 305-333. [ Links ]
[34] Stoner, J.A.F. 1968. Risky and cautious shifts in group decisions: The influence of widely held values. Journal of Experimental Social Psychology 4: 442-459. [ Links ]
[35] Kogan, N. & Wallach, M.A. 1967. Risk taking as a function of the situation, the person, and the group. New directions in psychology 3. Holt, Rinehart and Winston: London. [ Links ]
[36] Thurstone, L.L. 1928. Attitudes can be measured. The American Journal of Sociology 33(4): 529-554. [ Links ]
[37] Likert, R. 1932. A technique for the measurement of attitudes. Archives of Psychology 22:1 -55. [ Links ]
[38] Evans, C. 1978. Psychology: A dictionary of the mind, brain and behaviour. Arrow Books: London. [ Links ]
[39] Ginsberg, M. 1972. Mind and belief: Psychological ascription and the concept of belief. George Allen and Unwin: London. [ Links ]
[40] Cook, S.W. & Selltiz, C. 1964. A multiple-indicator approach to attitude measurement. Psychological Bulletin 62(1): 36-55. [ Links ]
[41] Cooper, J.B. & McGaugh, J.L. 1966. Attitudes and related concepts. In Attitudes: Selected readings, Jahoda M, Warren N (eds). Penguin Books: London, 26-31. [ Links ]
[42] Mills, J., Neely, A., Platts, K. & Gregory, M. 1998. Manufacturing strategy: A pictorial representation. International Journal of Operations and Production Management 18:1067-1085. [ Links ]
[43] Mills, J., Platts, K. & Gregory, M. 1995. A framework for the design of manufacturing strategy processes: A contingency approach. International Journal of Operations and Production Management 15(4): 17-49. [ Links ]
[44] Platts, K.W. 1993. A process approach to researching manufacturing strategy. International Journal of Operations and Production Management. 13(8): 4-17. [ Links ]
[45] Platts, K.W. 1994. Characteristics of methodologies for manufacturing strategy formulation. Computer Integrated Manufacturing Systems 7(2): 93-99. [ Links ]
[46] Platts, K.W. & Gregory, M.J. 1990. Manufacturing audit in the process of strategy formulation. International Journal of Operations and Production Management 10(9): 5-26. [ Links ]
[47] Platts, K.W. & Gregory, M.J. 1992. A manufacturing audit approach to strategy formulation. In Manufacturing strategy: Process and content, Voss, C.A. (ed). Chapman and Hall: London, 29 55. [ Links ]
[48] Platts, K.W., Mill, J.F., Neely, A.D., Gregory, M.J. & Richards, A.H. 1996. Evaluating manufacturing strategy formulation processes. International Journal of Production Economics 46-47: 233-240. [ Links ]
[49] Platts, K.W. Mills, J.F., Bourne, M.C., Neely, A.D., Richards, A.H. & Gregory, M.J. 1998. Testing manufacturing strategy formulation processes. International Journal of Production Economics 56-57: 517-523. [ Links ]
[50] Skinner, W. 1969. Manufacturing - missing link in corporate strategy. Harvard Business Review May-June: 136-145. [ Links ]
[51] Festinger, L. 1957. A theory of cognitive dissonance. Stanford University Press: California. [ Links ]
[52] Styles, E.A. 1997. The psychology of attention. Psychology Press: Sussex, UK. [ Links ]
[53] Triandis, H.C. 1971. Attitude and attitude change. John Wiley and Sons: New York. [ Links ]
[54] Sternberg, R.J. 1996. Cognitive psychology. Harcourt Brace: Orlando, Florida. [ Links ]
[55] Bailey, K.D. 1994. Methods of social research. Free Press: New York. [ Links ]
[56] Cooper, D.R. & Emory, C.W. 1995. Business research methods. Irwin: Chicago. [ Links ]
[57] Babbie, E.R. 1989. The practice of social research. Wadsworth: California. [ Links ]
[58] Cronbach, L.J. 1951. Coefficient alpha and the internal structure of tests. Psychometrika 16(3): 297-334. [ Links ]
[59] Fredrickson, J.W. 1984. The comprehensiveness of strategic decision processes: Extensions, observations, future decisions. Academy of Management Journal 27: 445-466. [ Links ]
[60] Nunnally, J.C. 1978. Psychometric theory. McGraw-Hill: New York. [ Links ]
[61] Venkatraman, N. & Grant, J.H. 1986. Construct measurement in organisational strategy research: A critique and proposal. Academy of Management Review 11(1): 77-87. [ Links ]
[62] Peterson, R.A. 1994. A meta-analysis of Cronbach's coefficient alpha. Journal of Consumer Research 21: 381-391. [ Links ]
[63] Nunnally, J.C. 1970. Introduction to psychological measurement. McGraw-Hill: New York. [ Links ] [64] Peter, J.P. 1979. Reliability: A review of psychometric basics and recent marketing practices. Journal of Marketing Research 16 (Feb): 6-17. [ Links ]
[65] Guilford, J.P. 1954. Psychometric methods. McGraw-Hill: New York. [ Links ]
[66] Emwanu, B. & Snaddon, D.R. 2000. Measuring convergence among participants of a workshop in a strategy formulation process - a South African experience. In Performance measurement: Past, present and future, Neely, A. (ed.). Papers from the 2nd international Conference on Performance Measurement. University of Cambridge, July: 145-152. [ Links ]
[67] Siegel, S. & Castellan, N.J. 1988. Nonparametric statistics: For the behavioral sciences. 2nd ed. McGraw-Hill: New York. [ Links ]
[68] Hoch, S.J. 1987. Perceived consensus and predictive accuracy: The pros and cons of projection. Journal of Personality and Social Psychology 53(2): 221-234. [ Links ]
[69] Smith, H.W. 1981. Strategies of social research. Prentice Hall: New Jersey. [ Links ]
[70] Gans, H.J. 1962. The urban villagers: Group and class in the life of Italian-Americans. Free Press: New York. [ Links ]
[71] Denzin, N.K. 1978. The research act. McGraw-Hill: New York. [ Links ]
[72] Mills, J., Platts, K., Neely, A., Richards, H., Gregory, M. & Bourne, M. 1996. Creating a winning business formula. Department of Trade and Industry: UK. [ Links ]
[73] Akkermans, H.A. & van Aken, J.E. 1992. Process related problems in operations strategy. International Studies of Management and Organization 22(4): 6-20. [ Links ]
[74] Selltiz, C., Jahoda, M., Deutsch, M. & Cook, S.W. 1959. Research methods in social relations. Holt, Rinehart and Winston: New York. [ Links ]
* The author was enrolled as a PhD student in Industrial Engineering at the University of the Witwatersrand, and is the corresponding author.
** Formerly Barloworld Chair of Industrial Engineering, School of Mechanical, Industrial and Aeronautical Engineering, University of the Witwatersrand, South Africa
3 Bracketed words within all quotations in the paper are the authors' words.
4 Emphasis in the original.
5 In addition, these show multi-dimensions by going from the general to the particular and from content to process, and by showing the hierarchy in the firm.
6 The full title is "Creating a winning business formula".
7 Repeated questions. See [1] and Appendix.
8 Only the MD returned both questionnaires after barring the other participants from filling pre-process questionnaires.
9 The whole company was restructured and all participants were retrenched.
10 A copy of the complete questionnaire is available from the corresponding author.

