


Serviços Personalizados
Artigo
 Inglês (pdf)
 Artigo em XML
 Referências do artigo
Indicadores

Links relacionados
-
 Citado por Google
 -
 Similares em Google
Compartilhar

 Permalink
Lexikos
versão On-line ISSN 2224-0039
versão impressa ISSN 1684-4904
Lexikos vol.27 Stellenbosch 2017
ARTICLES
Visualisation of Collocational Preferences for Near-Synonym Discrimination
Die visualisering van kollokasionele voorkeure by die onder-skeiding van ampersinonieme
Mariusz Piotr Kamiński
Basic Science Centre, University of Applied Sciences, Nysa, Poland. (mariusz.kaminski@pwsz.nysa.pl)
ABSTRACT
This paper aims to explore the potential usefulness of two techniques that visualise collocational preference for the purpose of synonym discrimination. Given the fact that collocation is one of the most important markers of meaning difference, it is used as the criterion for distinguishing between near-synonyms. Collocational preferences for a set of near-synonyms (artificial, fake, false, and synthetic) were visualised using two techniques: correspondence analysis plot and collocational network. The collocations were retrieved from BNC corpus by using a distributional method. An advantage of the graphs is that they allow lexicographers to spot similarities and differences in collocational preference of several words in a single diagram. Such visualisations may be used as an alternative way to a tabular form of data presentation to avoid information overload which arises when lexicographers prepare synonym essays for productively-oriented dictionaries. The visualisations can be used as a starting point for exploring semantic differences between semantically similar words.
Keywords: visualisation, correspondence analysis, collocational network, synonymy discrimination, collocation, automatic retrieval of synonyms, near-synonym, collocation preferences
OPSOMMING
Hierdie artikel beoog om die potensiële bruikbaarheid van twee tegnieke te ondersoek wat kollokasionele voorkeure visualiseer met die oog op sinoniem-onderskeiding. Aangesien kollokasies een van die belangrikste merkers van betekenisverskil is, word dit gebruik as maatstaf om tussen ampersinonieme te onderskei. Kollokasionele voorkeure vir 'n stel van ampersinonieme (artificial, fake, false en synthetic) is gevisualiseer deur twee tegnieke te gebruik: ooreenkomsanalise-stipping en kollokasionele netwerk. Die kollokasies is onttrek uit die BNC korpus deur gebruik te maak van 'n verdelingsmetode. 'n Voordeel van die grafieke is dat hulle leksikograwe in staat stel om ooreenkomste en verskille ten opsigte van kollokasionele voorkeur raak te sien vir verskeie woorde in 'n enkele diagram. Sulke visualiserings kan gebruik word as 'n alternatiewe manier vir 'n tabellariese manier van datavoorstelling wat inligtingsoorlading voorkom wat ontstaan wanneer leksikograwe sinoniemreekse voorberei vir woordeboeke wat op produksie fokus. Die visualiserings kan gebruik word as 'n vertrekpunt om semantiese verskille te ondersoek tussen woorde wat semanties soortgelyk aan mekaar is.
Sleutelwoorde: visualisering, ooreenkomsanalise, kollokasionele netwerk, sinoniemonderskeiding, kollokasie, outomatiese onttrekking van sinonieme, ampersinoniem, kollokasievoorkeure
1. Introduction
Synonym discrimination may be a challenge for lexicographers constructing synonym essays for productively-oriented dictionaries. In such essays, words of similar meaning are brought together and their meaning discriminated by specifying the particular points where they overlap or differ.1 According to Landau, the inclusion of synonym discrimination in general dictionaries "makes a great deal of sense" and they are "a welcome superfluity" (2001: 141).
For many years, synonym discrimination, as a lexicographer's task, was laborious and time-consuming, as it was carried out manually and relied largely on the lexicographer's introspection and intuition.2 However, recent developments in computer technology offer support to this process by automating data excerption, visualisation, and analysis. Given the fact that collocation is one of the most important markers of meaning difference (see section 2) and easily accessible from corpora, contemporary lexicographic software uses collocation behaviour as the criterion for distinguishing between near-synonyms (Kilgarriff 2013).
sketch Engine, one of the widely used systems for writing dictionaries, offers a tool called sketch Diff, which supports comparing and contrasting two words by producing word sketches (see Kilgarriff 2013).3 These are summaries of the collocational behaviour of each word, presented in a tabular form, and accompanied by a statistical measure of collocational strength for each co-occurring word. Using this software, lexicographers are provided with collocational information in a clear and accessible way, which is essential for further analysis of semantically similar words. However, the tabular form of contrasting words, which is used in sketch Diff, helps lexicographers compare two words, rather than three or more at once, which means that lexicographers engaged in writing panels for several synonyms need to conduct several analyses on all possible word pairs in order to draw conclusions as to collocational overlap and differences. Thus, the question arises whether it would be possible to compare several synonyms in a single graph, by showing their collocational preference in such a way that the investigator can see at a glance which words are closer to each other by virtue of their grammatical-collocational behaviour.
This paper aims to explore the potential usefulness of two visualisation techniques: correspondence analysis plot and collocational network. The focus is to discriminate between a set of words (artificial, fake, false, and synthetic) by visualising their collocational preferences. Correspondence analysis (henceforth CA) is a frequency-based multivariate analysis used in statistics and quantitative studies. its output has a form of a plot which reveals associations in corpus data on the basis of co-occurrence of different features (see Glynn 2014: 443, Greenacre 2007). In turn, collocational network is a diagram that displays links between lexical units, showing how a given unit relates syntagmatically to other units in the lexical structure. Both ways of presentation of data help the analyst to spot collocational overlap between near-synonyms, which is obscured in a traditional textual or tabular form. The focus on collocational overlap is motivated by the need to establish similarities in collocation preferences across synonyms.
Despite enormous developments in computer lexicography, the above two forms of visualisation remain underexplored in lexicography. In particular, correspondence analysis is novel to dictionary making, though it has recently been used in related studies, i.e. in dictionary comparison, to visualise similarities in definition style (Kaminski 2015), and in corpus linguistics, to display semantic content of a set of moderators (Desagulier 2014). As for collocational networks, they have been employed in a few dictionary projects, for example, in constructing dictionary entries in E-Advanced Learner's Dictionary of Verbs in Science (see Alonso et al. 2011), and in building lexical systems as graph models of lexicons (Polguère 2014). The potential of the two visualisation techniques is worth exploring now, as computer technology is opening up new opportunities for lexicographic projects.
2. Synonymy and collocation
Synonymy is a relationship between two or more lexical items which have the same meaning. Because complete synonymy presupposes a rather unlikely situation in language, namely the substitutability of lexical items in all contexts and identity of denotative and connotative elements (Bussmann 1996: 1164), it is more convenient to extend the definition of synonymy to cover items that are close enough in meaning to be substitutable in some contexts, without changing the meaning of the sentence (Crystal 2003: 450, Lewandowska-Tomaszczyk 1990). In other words, it is possible to identify candidates for synonyms by selecting words that have the same collocational pattern, and disregarding differences in connotation due to particular regional, socio-dialectal or stylistic variation (Bussmann 1996: 1165). Of all the features distinguishing between near-synonyms, such as language variety, register, emotive content and degree of specificity (Moon 2013: 261), collocation is one of the easiest to retrieve from a corpus (Sinclair 1991: 170). As Firth (1957: 11) neatly put it: "you shall know a word by the company it keeps." According to Firth (1968: 181), "collocations of a given word are statements of the habitual or customary places of that word". Firth was the first to use the term collocation, and his definition above arguably implies a quantitative nature of collocation study (cf. Krishnamurthy 2000: 32; Xiao and McEnery 2006: 105). Although collocation analysis has become a well-established area of corpus linguistics, it is only relatively recently that collocation has been systematically exploited in dictionary making as a criterion for synonym discrimination.4
3. Collocation retrieval
Collocations can be acquired automatically from a corpus in at least two ways: one that depends on proximity of two words (Kilgarriff and Kosem 2012), and the other on grammatical relationships. The former rests on the assumption that two words are collocates of one another if they co-occur with a frequency far greater than chance (Atkins and Rundell 2008: 369). In this approach, which is used on an untagged corpus, a candidate for a collocate of a node word is established within a given span around the node by calculating the association strength between the two words. A commonly used measure of association strength is Mutual information (Mi), which is based on the probability of occurrence of the combination of the node and the collocate compared to the probabilities of the two words separately (Church and Hanks 1989). Apart from MI, there are other statistics, including t-score, z-score, log-likelihood ratio, the Dice coefficient, and logDice (Rychlý 2008). However, this proximity-based approach, which is based solely on calculating collocation measure, has a disadvantage of yielding a certain amount of noise in the form of rare words (in the case of MI) or function words (log-likelihood) (Kilgarriff and Kosem 2012). Because collocates are gathered together irrespective of the functional relations to the node word, extra effort is needed to identify the collocates that stand in specific relations to the node word. Furthermore, this approach requires one to set up a span within which the collocates are sought, which may be problematic for lexicographers who have no idea of how far from the node word they should look for (Kilgarriff and Tugwell 2002: 127).
The other approach, which is based on grammatical relationships, does not have the shortcomings of the former. It relies on distribution of words, that is only the collocates that stand in a relation of grammatical dependency to the node word are retrieved. For that to be possible the corpus has to be syntactically parsed with grammatical structure of sentences identified. As a result, one can retrieve lists of subjects, objects and other functional categories of collocates that a given word relates to. This approach has been used by Kilgarriff et al. (2004) in Sketch Engine. In this software, collocations extracted from a parsed corpus are accompanied by the measure of collocation strength, which helps the lexicographer reduce the amount of information overload.
In this paper the distributional approach will be used in extracting collocations. Collocation types and their frequencies will be supplemented by a statistical measure of collocation strength (Rychlý's logDice5).
4. Method
4.1 Material and preparation of data
The data were retrieved from BNC XML Edition6 and processed according to the following procedure:
(1) retrieving full sentences containing the adjectives from the corpus,
(2) parsing the corpus sentences with the stanford Parser (Chen and Manning 2014),
(3) retrieving 10 most frequent collocates for each adjective, in either attributive or predicative positions,
(4) creating a matrix of the adjectives and their top-frequency collocates, ordered according to the overall frequency,
(5) converting the raw frequencies into a measure of collocational strength (for collocational network),
(6) visualising the data
The sentences containing either of the adjectives under study were retrieved from the corpus and cleaned up of all BNC tags. They were then parsed with the stanford Parser, a program that outputs grammatical dependencies within a sentence. of all 50 typed dependencies produced by the parser, only two were of interest to us, namely the ones in which the adjective stands in either attributive or predicative position with respect to the noun. In the Stanford Parser, the above relationships are indicated as "amod" and "nsubj", respectively. Below is an example output for two sentences "But that was something of a false dawn" and "The style is artificial". In the first sentence, the relationship between false and dawn is indicated by "amod", and in the second one the relationship between style and artificial by "nsubj".
cc(something-4, But-1)
nsubj(something-4, that-2)
cop(something-4, was-3)
root(ROOT-0, something-4)
case(dawn-8, of-5)
det(dawn-8, a-6)
amod(dawn-8, false-7)
nmod:of(something-4, dawn-8)
det(style-2, The-1)
nsubj(artificial-4, style-2)
cop(artificial-4, is-3)
root(ROOT-0, artificial-4)
In order to reduce the parsing time, the maximum sentence length to parse was set to 100, which still allowed us to retrieve over 90% of the relevant sentences. From the parser output, a list of all collocates was extracted for each adjective. Function words such as "one", "it", "they", "that", etc., which stood in the subject position, were excluded from the list. A subset of the top 10 most frequent collocates for each adjective was ordered according to the overall frequency. As a result, a table of most frequent collocations was obtained (see Table 1). An advantage of constructing such a table is that one can see which adjectives share the same collocates. However, such a table is more difficult to read, when more data are included. In order to enhance the interpretation of the data, they were visualised using CA plot and network.

4.2 Visualisation
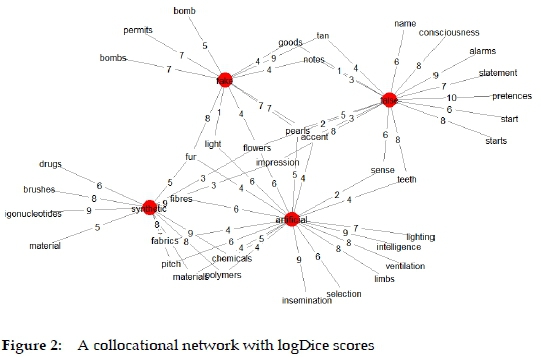
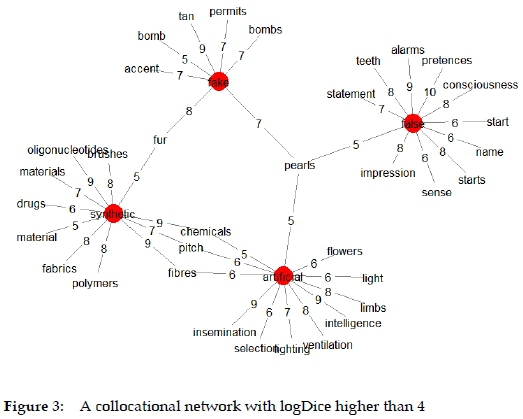
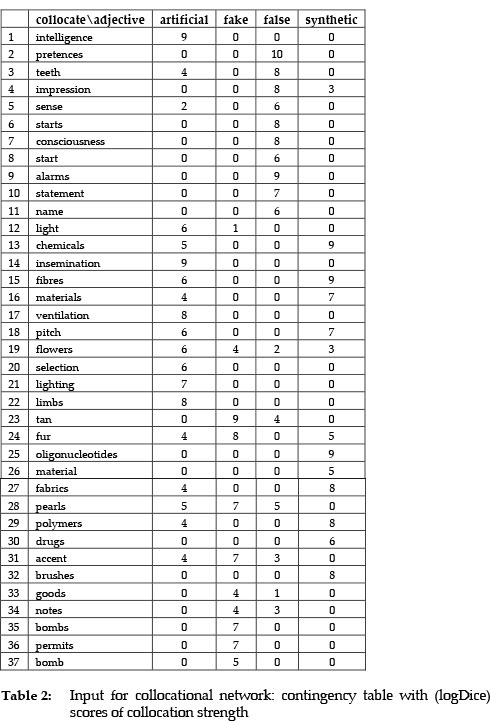
Table 1 brings together raw frequencies of collocations. The table was used as input to correspondence analysis (see Fig. 1). CA converts the frequencies of feature co-occurrence to distances and displays them in a two-dimensional graph. The graph shows correlations between data points through distance and proximity. The same input data were used to generate the collocational network (see Fig. 2 and Fig. 3), with the difference being that the raw frequencies were converted into Rychlý's logDice scores, a measure of correlation strength (see Table 2). For better clarity, the collocational network in Fig. 3 was generated only for strong collocations by removing the collocations with logDice lower than 5.

5. Results and discussion
The interpretation of the diagrams in Fig. 1 and 2 is straightforward. In CA plot, the data points that appear in proximity to each other show strong association, while those that are far apart are unrelated. The association is stronger for points located away from than close to the centre. The plot shows that the collocates cluster around their respective adjectives with which they are distinctly associated. This is especially noticeably for synthetic and false. As for adjectives artificial and fake, they are relatively close to each other, meaning that they share certain collocates, in particular accent, pearls, fur, and flowers. Given this fact, the adjectives are more similar to each other than to other adjectives. Apart from the shared collocates, there are nouns distinctly associated with either artificial or fake, for example (artificial) selection, intelligence, and (fake) goods, bomb, permits, tan, though it is not made explicit in this plot.
The position of the data points relative to the horizontal and vertical dimensions is also meaningful. Because the adjectives synthetic and artificial are placed in the same half of the plot, quite away from the centre, they have certain collocates in common. one of them is pitch, which is located half way between artificial and synthetic, meaning that it enters into a strong collocation with both of the adjectives.
When it comes to the collocational network in Fig. 2 and Fig. 3, one can see that each adjective enters into distinct collocations. In particular, the collocates which are not shared by any other adjective may be indicative of semantic differences between the adjectives. For example, fake makes collocation with bombs, permits, and accent, which may suggest the idea of tricking as a semantic feature of fake.
Fig. 2 also shows that the adjectives are highly interwoven. Worth noticing is the collocation overlap between synthetic and artificial, which is partly visible in CA plot (note the position of pitch mentioned earlier). The overlapping nouns such as pitch, materials, polymers, fibres, fabrics, and chemicals strongly correlate with synthetic and somewhat less so with artificial. This finding suggests that synthetic and artificial are semantically close in the sense when they are used to describe materials and substances produced in an artificial rather than natural way.
A good strategy in interpreting collocational overlap in Fig. 2 is to compare the collocation scores for a noun that enters into collocation with more than one adjective. For example, fur collocates with fake, synthetic and artificial, but the strongest collocation is made with fake (8 vs. 5 and 4). Another example can be light, which collocates with artificial with a higher collocation strength than with fake (6 vs. 1). By comparing the scores, one can identify the strongest collocations and consider them for inclusion in a dictionary. To obtain a clearer picture, it is possible to remove the collocations with lower collocation scores, as in Fig. 3.
Based on collocation evidence in Figures 1-3, one can draw tentative conclusions about semantic preferences of each adjective. An adjective artificial is used in the context of man-made things that have the same features as their natural counterparts (e.g. intelligence, light, respiration, ventilation). In this regard, the use of artificial overlaps with that of synthetic (synthetic fibres), as well as of false (false teeth). In turn, a word synthetic collocates with the words denoting substances and materials specific to the field of chemistry and biology (e.g. chemicals, oligonucleotides, polymers), which are produced in an artificial or unnatural way. With regard to false, the word carries the core meaning of being "untrue" or "wrong" in the collocation false statement. However, the word has other meanings which are more or less related to the core one, such as false pretences, which is semantically more distant to the core meaning than false impression. The collocation with teeth, which is also common to artificial, suggests that false is a good candidate for synonymy with artificial. Given the above collocational preferences, artificial is semantically more similar to synthetic than to false, and these two adjectives are semantically simpler than polysemous false. Finally, fake is used to describe valuable objects (fur) or is used to deceive people (permit, bomb). The feature of deceiving is also present in some collocations of false (notes, statement).
On the whole, the results of correspondence analysis overlap with those of collocational network, but certain points of difference emerge. CA reduces the number of dimensions to just two, which allows one to spot major differences and parallels in the distribution of the data. As a result, it highlights strong collocations and obscures the weak ones. For example, while the noun flowers is shared by all the adjectives in the network, in the CA plot it appears close to just artificial, on the grounds that there is a much higher frequency of artificial flowers than fake flowers, synthetic flowers, or false flowers (see Table 1). This fact is left implicit in the network, in which flowers is linked with all the adjectives. Likewise, teeth is linked with both false and artificial in the network, but it correlates with just false in the CA plot. Thus, the network tends to obscure strong collocations in favour of weak ones, treating all of them as equal. In turn, an advantage of CA is that it highlights the collocations that contribute significantly to the variation of the data and disregards the less distinctive co-occurrences.
The analysis of visualisations of collocational preferences is a starting point for a detailed investigation of meaning differences through the analysis of a wider context of word use.
6. Conclusions
Correspondence analysis plot and collocational network have their strengths and weaknesses. They allow researchers to spot similarities and differences in collocational preferences of several words in a single diagram. They help lexicographers deal with information overload which arises while comparing more than two words. Using the diagrams, one can identify which words are contextually similar to or different from each other and see what collocational patterns underlie the semantics of the words. The visualisations may be used as an alternative way to the presentation of data in tabular form. They save a great deal of time, as they show what one can discover by perusing thousands of concordance lines or by analysing summaries of collocational behaviour generated by Sketch Engine for each pair of adjectives.
Because the visualisations are based exclusively on collocational behaviour, they do not provide lexicographers with ready-made solutions to such semantic details as sense division. The semantic boundaries, however, can be discovered through an in-depth analysis of the diagrams in combination with the frequency tables and concordance lines. Such an analysis would be enhanced by making the diagrams interactive, that is by associating hyperlinks with data points on the plot to enable instant access to corpus evidence. Finally, the visualisations are potentially useful as long as they are restricted to a subset of data. Visualising a large number of data points may result in the diagram being illegible.
References
Alonso, A., C. Millon and G. Williams. 2011. Collocational Networks and their Application to an e-Advanced Learner's Dictionary of Verbs in Science (DicSci). Kosem, I. and K. Kosem (Eds.). 2011. Electronic Lexicography in the 21st Century: New Applications for New Users. Proceedings of eLex 2011, Bled, 10-12 November 2011: 12-22. Ljubljana: Trojina, Institute for Applied Slovene Studies. [ Links ]
Atkins, B.T. Sue and M. Rundell. 2008. The Oxford Guide to Practical Lexicography. Oxford/New York: Oxford University Press. [ Links ]
The British National Corpus. Version 3 (BNC XML Edition). 2007. Distributed by Oxford University Computing Services on Behalf of the BNC Consortium. URL: http://www.natcorp.ox.ac.uk/.
Bussmann, H. (Ed.). 1996. Routledge Dictionary of Language and Linguistics. (Translated and edited by Trauth, G. and K. Kazzazi). London/New York: Routledge. [ Links ]
Chen, D. and C.D. Manning. 2014. A Fast and Accurate Dependency Parser Using Neural Networks. Proceedings of the 2014 Conference on Empirical Methods in Natural Language Processing (EMNLP): 740-750. Doha, Qatar: Association for Computational Linguistics. [ Links ]
Church, K.W., W. Gale, P. Hanks, D. Hindle and R. Moon. 1994. Lexical Substitutability. Atkins, B.T.S. and A. Zampolli (Eds.). 1994. Computational Approaches to the Lexicon: 153-177. Oxford: Clarendon Press. [ Links ]
Church, K. and P. Hanks. 1989. Word Association Norms, Mutual Information and Lexicography. ACL Proceedings, 27th Annual Meeting, Vancouver, Canada, June 26-29, 1989: 76-83. Stroudsburg, PA: Association for Computational Linguistics. [ Links ]
Crystal, D. 2003. A Dictionary of Linguistics and Phonetics. Fifth edition. Oxford: Blackwell Publishing. [ Links ]
Desagulier, G. 2014. Visualizing Distances in a Set of Near-Synonyms: Rather, Quite, Fairly, and Pretty. Glynn, D. and J.A. Robinson (Eds.) 2014. Corpus Methods for Semantics. Quantitative Studies in Polysemy and Synonymy: 145-178. Amsterdam: John Benjamins. [ Links ]
Firth, J.R. 1957. Papers in Linguistics. Oxford: Oxford University Press. [ Links ]
Firth, J. 1968. A Synopsis of Linguistic Theory 1930-1955. Palmer, F.R. (Ed.). 1968. Selected Papers of J.R. Firth 1952-59: 1-32. Bloomington: Indiana University Press. [ Links ]
Glynn, D. 2014. Correspondence Analysis: Exploring Data and Identifying Patterns. Glynn, D. and J. Robinson (Eds.). 2014. Corpus Methods for Semantics. Quantitative Studies in Polysemy and Synonymy: 443-486. Amsterdam: John Benjamins. [ Links ]
Greenacre, M. 2007. Correspondence Analysis in Practice. Second edition. London: Chapman & Hall. DOI: 10.1201/9781420011234. [ Links ] ,
Hartmann, R.R.K. 2005. Lexicography and Its Interdisciplinary Contacts, with Special Reference to Linguistics and Onomasiology. Lexikos 15: 70-89. [ Links ]
Kaminski, M. 2015. In Search of Lexical Discriminators of Definition Style: Comparing Dictionaries through n-Grams. International Journal of Lexicography 29(4): 403-423. [ Links ]
Kilgarriff, A. 2013. Using Corpora as Data Sources for Dictionaries. Jackson, H. (Ed.). 2013. The Bloomsbury Companion to Lexicography: 77-96. London: Bloomsbury. [ Links ]
Kilgarriff, A. and I. Kosem. 2012. Corpus Tools for Lexicographers. Granger, S. and M. Paquot (Eds.). 2012. Electronic Lexicography: 31-55. Oxford: Oxford University Press. [ Links ]
Kilgarriff, A., P. Rychlý, P. Smrz and D. Tugwell. 2004. The Sketch Engine. Williams, G. and S. Vessier (Eds.). 2004. Proceedings of the Eleventh EURALEX International Congress, EURALEX 2004, Lorient, France, July 6-10, 2004: 105-116. Lorient: Faculté des Lettres et des Sciences Humaines, Université de Bretagne Sud. [ Links ]
Kilgarriff, A. and D. Tugwell. 2002. Sketching Words. Corréard, M.-H. (Ed.). 2002. Lexicography and Natural Language Processing: A Festschrift in Honour of B.T.S. Atkins: 125-137. Grenoble: EURALEX. [ Links ]
Krishnamurthy, R. 2000. Collocation: From Silly Ass to Lexical Sets. Heffer, C., H. Sauntson and G. Fox (Eds.). 2000. Words in Context: A Tribute to John Sinclair on his Retirement: 31-47. Birmingham: University of Birmingham. [ Links ]
Landau, S.I. 2001. Dictionaries: The Art and Craft of Lexicography. Second Edition. New York/Cambridge: Cambridge University Press. [ Links ]
Lê, S., J. Josse and F. Husson. 2008. FactoMineR: An R Package for Multivariate Analysis. Journal of Statistical Software 25(1): 1-18. 10.18637/jss.v025.i01. [ Links ]
Lewandowska-Tomaszczyk, B. 1990. Meaning, Synonymy, and the Dictionary. Tomaszczyk, J. and B. Lewandowska-Tomaszczyk (Eds.). 1990. Meaning and Lexicography: 181-208. Amsterdam: John Benjamins. [ Links ]
Macmillan Dictionary. 2009-2015. Macmillan Publishers Limited. The Entry for False. June 2015. http://www.macmillandictionary.com.
McArthur, T. 1986. Worlds of Reference. Lexicography, Learning and Language from the Clay Tablet to the Computer. Cambridge: Cambridge University Press. [ Links ]
Moon, R. 2013. Braving Synonymy: From Data to Dictionary. International Journal of Lexicography 26(3): 260-278. [ Links ]
Piotrowski, T. 1994. Z Zagadnien Leksykografii. Warszawa: Wydawnictwo Naukowe PWN. [ Links ]
Piozzi, H.L. 1794. British Synonymy: or An Attempt at Regulating the Choice of Words in Familiar Conversation. London: Printed for G.G. and J. Robinson. [ Links ]
Polguère, A. 2014. From Writing Dictionaries to Weaving Lexical Networks. International Journal of Lexicography 27(4): 396-418. [ Links ]
Roget, P.M. 1852. Thesaurus of English Words and Phrases. New York: Longmans, Green & Co. /Dell Publishing. [ Links ]
Rychlý, P. 2008. A Lexicographer-friendly Association Score. Sojka, P. and A. Horák (Eds.). 2008. Proceedings of Second Workshop on Recent Advances in Slavonic Natural Languages Processing, RASLAN 2008: 6-9. Brno: Masaryk University. [ Links ]
Sinclair, J. 1991. Corpus, Concordance, Collocation. Oxford: Oxford University Press. [ Links ]
Trusler, J. 1766. The Difference, Between Words, Esteemed Synonymous, in the English Language. London: J. Dodsley. January 2017. https://archive.org/details/differencebetwe00giragoog. [ Links ]
Urdang, L. 1991. The Oxford Thesaurus. An A-Z Dictionary of Synonyms. Oxford: Oxford University Press. [ Links ]
Xiao, R. and T. McEnery. 2006. Collocation, Semantic Prosody, and Near Synonymy: A Cross-Linguistic Perspective. Applied Linguistics 27(1): 103-129. [ Links ]
1. In contemporary general dictionaries, synonym discriminations are provided in the middle matter. Sometimes brief discriminations supplement definitions, together with illustrative examples. For example, in an EFL MacMillan Dictionary Online, synonyms for false are provided in a panel titled "Synonyms: false", with a definition, collocations or an illustrative example for each synonym.
2. Synonym discrimination was a feature of early synonym dictionaries such as Trusler's The Difference, Between Words, Esteemed Synonymous, in the English Language (1766) and Piozzi's British Synonymy: or An Attempt at Regulating the Choice of Words in Familiar Conversation (1794) (Landau 2001: 135). These dictionaries attempted to discriminate between related words by discussing differences in meaning, and sometimes indicating collocations. Apparently for practical reasons, this practice was soon abandoned by Roget and his followers, who limited themselves to enumerating related words without specifying what distinguished them (Hartmann 2005: 83). Roget's Thesaurus of English Words and Phrases (1852) groups words together to the effect that the user understands the meaning of the headword through these words. However, like in many contemporary thesauri, the choice of synonyms is highly dependent on the compiler's subjective judgement (see McArthur 1986, Piotrowski 1994). This intuition-based approach leaves a great deal to be desired, as there is little agreement among lexicographers with regard to which synonyms should be recorded in an entry (Church et al. 1994: 156).
3. Distributional Thesaurus, which is another Sketch Engine tool, is used for automatic generation of a list of synonyms for a given word (Kilgarriff et al. 2004). The list is ranked according to a similarity score, and visualised in the form of a word cloud, with most similar words in the centre and others in the periphery. The similarity score is computed on the basis of a distributional criterion, by comparing quantitatively grammatical and collocational behaviour of the words.
4. According to Landau (2001: 137), the fact that dictionaries of cumulative synonymy are easier to prepare than dictionaries of synonym discrimination is a reason why publishers are more willing to compile the former type of reference works. However, as corpus processing tools allow lexicographers for efficient exploitation of texts, contemporary dictionaries address the problem of synonym discrimination in a more principled way. For example, Urdang's Oxford Thesaurus (1991) divides synonyms into groups according to whether they are "more or less substitutable for the main entry in the illustrative sentence".
5. This is an association measure which was proposed by Rychlý (2008). It is based on the frequency of collocates, nodes, and the collocational pair. The theoretical maximum of the score is 14, but it is usually less than 10 (ibid.). In the network shown in Fig. 2, values equal to or lower than 0 are omitted, as these indicate little or no significance of collocation.
6. Data cited herein have been extracted from the British National Corpus, distributed by the University of Oxford on behalf of the BNC Consortium. All rights in the texts cited are reserved.
7. To obtain the CA plot, I used R package FactoMineR designed by Lê et al. (2008), available from https://tran.r-project.org/web/packages/FactoMineR/index.html.

