


Serviços Personalizados
Artigo
 Inglês (pdf)
 Artigo em XML
 Referências do artigo
Indicadores

Links relacionados
-
 Citado por Google
 -
 Similares em Google
Compartilhar

 Permalink
Scientia Militaria: South African Journal of Military Studies
versão On-line ISSN 2224-0020
versão impressa ISSN 1022-8136
SM vol.51 no.2 Cape Town 2023
http://dx.doi.org/10.5787/51-2-1397
ARTICLES
The Ecological Footprint of Individual Members at the Army Support Base, Eastern Cape
Desire Fouché; Hennie Smit; Ivan Henrico
Department of Military Geography, Faculty of Military Science, Stellenbosch University
ABSTRACT
The ecological footprint is a measure that calculates the demand for resources from the environment based on daily people's needs and desires. The study, on which this article is based, used the GFN online calculator to measure the ecological footprint of individual members of the Army Support Base, Eastern Cape. The ecological footprint online survey was used to obtain the quantitative data from the online results of each participant. Statistical analysis was performed using the STATISTICA 14.0 program to calculate the ecological footprints of the individual members of the Army Support Base, Eastern Cape and their combined ecological footprints. Officers recorded the highest ecological footprints in most categories, while NCOs, Private Services Act personnel, and privates in general recorded the lowest scores. Males scored higher than females in almost all categories, suggesting that they have a higher ecological footprint than females, and therefore a larger impact on the environment. The results of this study are significant as it is the first ecological footprint calculation performed for a military base in South Africa and one of only a few global studies similarly targeting the military. These results can be used as a basis for further studies in units of the South African National Defence Force, ultimately leading to more sustainable resource use.
Keywords: Ecological Footprint, South African National Defence Force, Military, Sustainable Resource, Environmental Management.
Introduction: Environmental Footprint Calculators and the South African Military
The development of environmental footprint (EF) calculators over the last few decades expanded the array of tools that could be used to ensure a more stable ecological future through sustainable resource use. The sections below present a short overview of the EF calculators available, and argue for the use of such a calculator to determine the environmental footprint of a South African (SA) Army unit.
Choosing the Most Suitable Environmental Footprint Calculator for the Study
Two main ways to determine the environmental footprint of a community or individual are using an online calculator, or mathematical calculation. See Figure 1 for a schematic representation of the different methods.
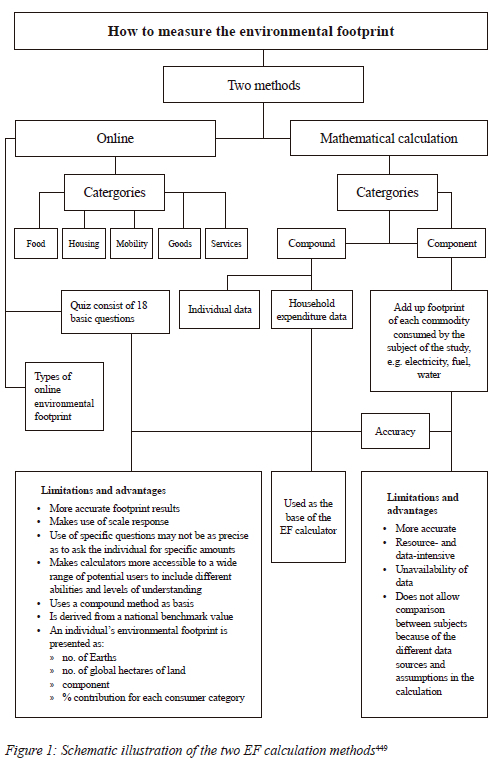
Collins et al. explain the EFA methodology and why they chose not to use the Global Footprint Network (GFN) online EF calculator.450 They focussed their study at household level to measure the environmental footprint of students, and used the research of Baabou et al. to explain the different mathematical methods to calculate the environmental footprint.451 When calculating the environmental footprint at a level below national level, either a top-down or bottom-up approach is used, with the bottom-up using a component EF calculation, and the top-down using a compound EF calculation.
The top-down (compound) and bottom-up (component) EF calculation methods use National Footprint Analysis (NFA) data to calculate the lower-level (regional or provincial level) and the household EF respectively. The online EF calculation uses a top-down approach to measure the environmental footprint of an individual. Collins et al. agree that top-down EF calculation methods are more accurate than bottom-up methods, but such methods are also more data-intense, and there are no guarantees that local, provincial, or regional data will be available.452 Figure 1 reflects a schematic summary of the two EF calculation methods, the ecological footprint analysis (EFA) and the online EF calculation.453,454 Apart from the two mathematical calculations, several other online EF calculators exist. Both mathematical calculations and the online calculator have limitations and advantages.455,456
The GFN, Redefining Progress and World Wildlife Fund (WWF) are the most popular online calculators used by researchers.457,458,459,460 Based on their research, Fernandez et al. and Collins et al. chose to measure the environmental footprint of students at Cardiff University and the University of Siena using the GFN calculator.461,462 The GFN calculator was easily accessible, easy to understand, quick to complete, provided individual data, and was available for individuals in more than 15 countries. These qualities made the GFN calculator the most suitable for use at Army Support Base (ASB), Eastern Cape (EC).
The South African Army and Environmental Footprint Calculators
In 2018, Smit and Van der Merwe focussed their research on military environmental literacy (MEL), which included the attitude, behaviour, and knowledge of the environment of members of the SA Army.463 According to their research, the results obtained from the associations between the three different components showed a strong relationship between the improvement of an individual's attitude and his or her behaviour towards the environment. These results pave the way for the involvement and support of the military-integrated environmental management programme (MIEM) in the South African National Defence Force (SANDF). Smit extended this research on the MEL of members of the SA Army to the implementation of environmental military courses to produce environmentally responsible soldiers for the Department of Defence (DoD).464 Using results from the 2017 annual MIEM to substitute the MEL results, Smit found a definite improvement in environmental literacy among students who had received some environmental education or training. Based on these findings, Smit concluded that soldiers needed to receive more environmental management training and education than was the case at the time.465 This bottom-up approach would enhance the educational level of soldiers from a low to a high level, leaving the commanders and chief with the non-negotiable task to support and develop improved MEL for the DoD.466
The relevance of the calculation of the environmental footprint of individuals at the ASB EC is as follows:
• Once members of the ASB EC have been made aware of the EF calculation and completed it online, it would enable improvement of individual attitudes, which will eventually improve individuals' behaviour towards the environment.
• With the possibility to include the EF online calculation in the annual environmental training programme, it is possible to make a positive contribution to the MEL level of SANDF soldiers and improve the sustainability of resource use in the SANDF.
• By using the delimitation of Wackernagel and Beyers, Jorgenson et al., and Galli et al., the ASB EC would qualify as a community of soldiers in a municipal area with specific boundaries, shared road infrastructure and facilities that relate to military activities467,468,469,470
The aim of the study reported on in this article, was to measure the environmental footprint of individuals at the ASB EC, situated in the Eastern Cape, a province of South Africa. The study could be extended to other arms of service, and it could be used to measure the environmental footprint throughout the SANDF.471,472,473,474 Such a measurement of the environmental footprint of military personnel of the SANDF has never been done.475This research aimed to fill this gap.
Calculating the Environmental Footprint of Individuals at the Army Support Base, Eastern Cape
Different methods to calculate the environmental footprint have been designed over the years, the first being the land-use matrix (LUM), proposed by Wackernagel and Rees.476 Others followed, either calculating the consumption of goods and services, or using the environmentally extended multi-regional input-output (EE-MRIO) analysis, which incorporates EF drivers of consumption to determine environmental impact and environmental footprint.477,478,479 These are all mathematical methods. The first online calculator was designed by the GFN in 2007 after the early introduction of the land-use matrix. The online questionnaire focusses on specific categories, such as food, housing and transport, and expresses the score as an EF value.
Fernandez et al. used a quantitative framework to analyse the daily effect of consumer demands and consumption patterns on the environment.480 The researchers used descriptive statistical analysis to analyse the data obtained from the results provided by the online EF calculation regarding the consumer behaviour of primary school teachers. The results from the online survey, global EF measure in global hectare (gha), and environmental footprint listed in the different categories, were tabulated, making it possible to compare the carbon footprint, food footprint and goods and services footprint.
In the study reported on in this article, a similar methodological approach was used. A random sample of the population was used to complete the online EF calculation. The EF online questionnaire was used to collect quantitative data from each participant's responses. The different categories and EF calculations were tabulated in a data matrix table to enable completion of the data analysis process. The qualitative data available from the data matrix table were then used to calculate the environmental footprint of the individual members of the ASB EC as well as their combined environmental footprint.
The choice of using the GFN online EF calculator as a data collection method was supported by the fact that no cost is involved, the calculation gives an immediate result, the questionnaire relates to the everyday lives of participants, and it is preferred by international researchers in the field.481,482,483 The quantitative information, i.e. primary data, was obtained from the calculations of the online EF measurement.484,485 The information is visually displayed in different categories as qualitative data. In Figure 2, an example of the results page of the GFN online EF calculator is depicted. For each answer, the calculator provides a value. At the end of the questionnaire, the calculation provides a graphic breakdown, and a visual percentage value of the land-use types and each consumption category, namely food, shelter, mobility, goods, and services. The value of the individual's overshoot day486 and the number of earths it would take to sustain the individual's current living standard, the land-use type by consumption category, the ecological footprint, carbon footprint, and the carbon footprint as part of the ecological footprint are displayed (based on the individual's environmental footprint).
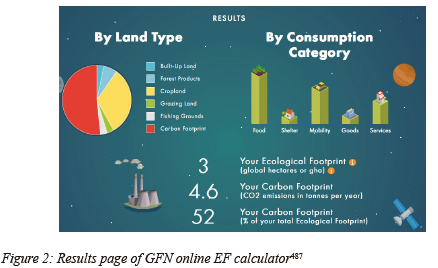
These figures are unique to each participant. All participants who completed the online calculation provided data from their lifestyle, and choices for the measurement of the ecological footprint of the individuals at the ASB EC. The online calculation was explained in detail before the participants started with the calculation. The validity of the research method was not compromised because the questions listed in the online questionnaire were directly related to the research questions and linked to the research objectives. The data collection instrument plays a fundamental part in data collection as well as the way the relevance, validity, and accuracy of the study are presented in the conclusion and recommendations related to the research problem.488
The calculation of the ecological footprint of the individuals at the ASB EC was based predominantly on a quantitative research method. Both quantitative and qualitative research tools were used to formulate the actual online EF calculation process.489,490,491
The Study Area: Army Support Base, Eastern Cape
The study area for this study was the ASB EC, a military base in the city of Gqeberha, situated in the Eastern Cape, South Africa (Figure 3).492
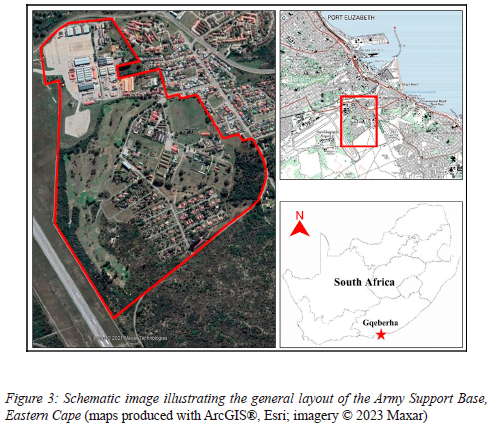
The ASB EC houses three different arms of service, and covers an area of close to five km2. The ASB EC is one of four units that are housed in the garrison. Most of the site is taken up by married and single quarters, a mess for officers and NCOs, and the golf course.
The personnel comprise officers, warrant officers (WOs), non-commissioned officers (NCOs), privates, and Public Service Act Personnel (PSAP).493 The ASB EC is a support unit, and is under command of the SA Army Support Formation. The ASB EC aims to serve all clients in the Eastern Cape, and to be ready to execute any logistical task as requested by the general officer commanding (GOC) SA Army Support Formation. The unit is primarily responsible for providing support services, namely procurement, transport, facility maintenance, technical maintenance, and safety and protection.
Surveying the Support Base, Eastern Cape
At the time, the ASB EC had 460 personnel, with males making up 68,6 per cent and females representing 31,4 per cent. The unit members are made up of 33 officers, 35 warrant officers, 198 NCOs, 96 privates and 98 PSAP.494 The size of the sample determined the specific number of participants that were selected from the official name list of the unit to complete the online EF calculation. The names of the possible participants were entered on an Excel spreadsheet with name, rank, department, and gender as identifiers. Using the number of potential participants per rank group, made it possible to identify the ratio of male and female participants.495 If a member was not willing to participate, was on leave or on a military course, the next member on the list was asked to complete the calculation. This rule was followed until the criteria for the sample size and gender split had been reached.
Participants who did not want to complete the calculation were removed from the randomly selected list, and the next person on the list from the same group was contacted to participate voluntarily. In the case where a person of a different gender to the one originally selected agreed to participate, an additional participant from the other gender was chosen from the next rank group to be able to adhere to or balance the gender split values of the ASB EC. Participants had the choice to complete the calculation in a predetermined venue (according to COVID-19 regulations) or complete the calculation in their own office (following COVID-19 regulations). On completion of the online calculation, the results page of the participant was printed and used to complete the data matrix table. The results page remained with the researcher for safekeeping. A total of 140 participants voluntarily completed the GFN online EF calculation. A total of 80 males and 60 females completed the calculation i.e. 57,1 per cent males and 42,9 per cent females. This represented a gender split of 1,3:1. Considering the number of males in the ASB EC, it was expected that more males would participate in this study. However, two reasons were listed for the smaller gender split that was recorded in the study: many male members were away on a military course during the data collection; and more females across all rank groups were willing to complete the online EF calculation.
Before starting the calculation, participants were reminded of the background and aim of the study. After completion, the results page of the calculation was printed, and the interpretation of the results was explained. Each participant received a number to ensure the confidentiality and anonymity of his or her results. All the EF results were then listed in the data matrix table according to the predetermined criteria.
Research Ethics and the Environmental Footprint Calculations
During this study, it was essential to address multiple ethical considerations for measuring the ecological footprint. Once the officer commanding (OC) ASB EC granted approval, ethical clearance was sought from both the Stellenbosch University Research Ethics Committee and the Defence Intelligence (DI) Division of the Department of Defence (DoD). Since ASB EC individuals were to fill in a questionnaire for data collection, the researcher ensured compliance with the ethical policy of Stellenbosch University.496,497
Once ethical clearance and authorisation had been obtained from the DoD, the participants were informed of the research in the form of a presentation on -
• why the information would be collected;
• what the purposes of the questionnaire and of the research were;
• the role the participants would play, and how; and
• how the research would affect the individuals, either directly or indirectly.498,499,500
During the presentation, an online example of the EF calculation was displayed to give participants a visual idea of what the research was about and what the questions would be that they would have to answer during the calculation. The participants were informed that no sensitive questions would be asked, that they would suffer no harm, and that they could withdraw at any time without any negative consequences.501 The calculation was completed anonymously, and the data of each individual appeared next to a number to maintain confidentiality throughout the data collection and analysis process.
Results of the Environmental Footprint Survey
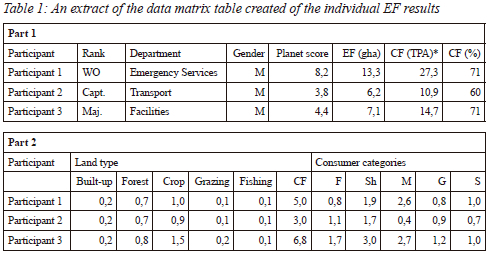
The results of the GFN online calculation of participants at the ASB EC are presented in the sections below. Table 1 lists examples of the scores achieved. These are presented in two parts.
GFN Results for Environmental Footprint of Individuals at the ASB EC
Table 1 (Parts 1 and 2) shows an extract from the complete data matrix table of the participants' scores for rank, department, gender, planet score, environmental footprint, carbon footprint, and carbon footprint (as a percentage), as well as land-use values, which include built-up land, forest, cropland, rangeland, fisheries, and carbon footprint. The consumer categories covering food (F), shelter (Sh), traffic or mobility (M), goods (G) and services (S) are also indicated. This extract (Table 1) is presented for display and page fit purposes.
The statistical composition (median, mean, standard deviation, minimum and maximum) of the GFN results according to the EF calculation categories for the individuals of the ASB EC is indicated in Table 2. Note that the land types (built-up land, forest, crop, fishing grounds, grazing, and the carbon footprint) indicate the amount of land needed for the specific lifestyle of the individuals of the ASB EC, and the consumption categories (food, shelter, mobility, goods and services) indicate the most important consumer goods and services.
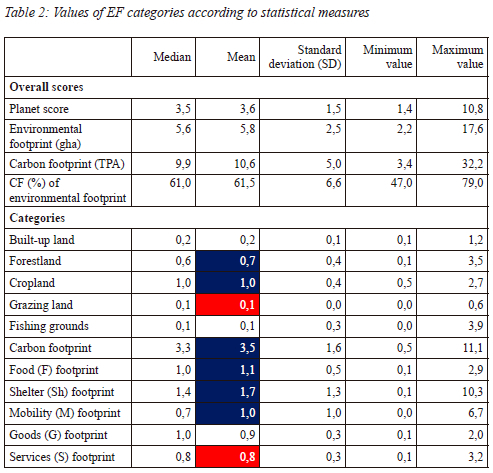
The values in Table 2 show that the mean (average) planet score was 3,6, environmental footprint was 5,8, and the carbon footprint was 10,6, It is further indicated that 61,5 per cent of the carbon footprint forms part of the EF. In terms of land use categories, forestland (0,7) and cropland (1,0) have the highest (marked in blue) land type scores, while grazing land (0,1) has the lowest score (marked in red). Looking at the mean values of the consumer categories, the highest footprints are carbon (3,5), shelter (1,7), food (1,1), and mobility (1,0), while the footprint of service (0,8) has the lowest scores.
Statistical Significance of the GFN Results of the EF Categories of the ASB EC
In Table 3, the EF categories are displayed against the rank groups (NCOs, officers, PSAP, privates and WOs) based on their p-values.502
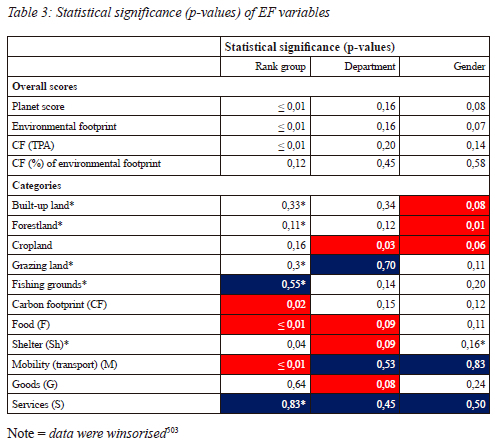
The different EF categories include the planet score, environmental footprint, carbon footprint, and carbon footprint as a percentage of the environmental footprint, the land-use categories: built-up land, forest, cropland, grazing land and fishing grounds and the consumer categories: food (F), shelter (Sh), mobility (M), goods (G) and services (S).
According to the statistical treatment of the data, only the planet score, environmental footprint, carbon footprint (TPA), food and mobility variables showed significant differences by reporting a p-value < 0,05, In the case of the land-use categories: built-up land, forestland, goods and services data were winsorised to reduce the effect of outliers on the results. In the case of the various departments, no significant differences were recorded for any of the environmental footprint, land-use or consumer categories. In the case of gender, the only category that showed a significant difference was forestland while the data for the consumer category home or shelter were winsorised.
Statistical Significance of Different Variables (Rank, Departments, and Gender) Against the EF Categories
Rank groups
The letters (a,b,c) next to the scores in Table 4 indicate significant differences between rank groups and different EF categories at a significance level of 5 per cent (p < 0,05). If at least one letter overlapped between two groups (e.g. b vs ab), then the difference was not significant (p > 0,05). If there were no overlapping letters (e.g. a vs b), then the difference was significant (p < 0,05). The scores marked in blue show the highest scores, and those in red, the lowest scores.
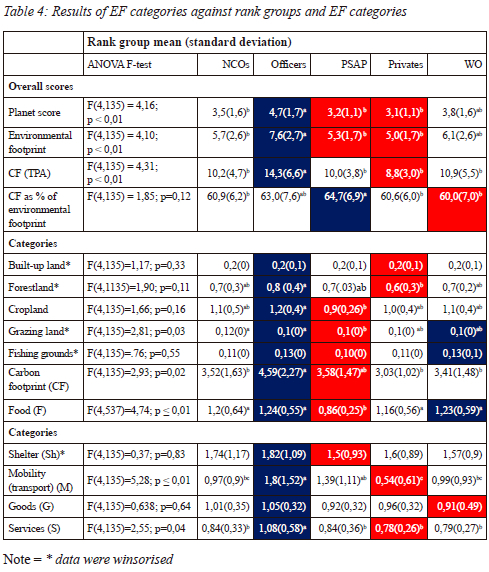
Officers show the greatest differences of all rank groups with a planet score of 4,67 while other rank groups have a planet score of > 3. The reason for the large difference in planet score between officers and the other rank groups can be explained by the higher income of officers, their higher standard of living, a high transport footprint as well as high food and carbon footprints. The lower scores for NCOs, PSAP, privates and WOs can be explained based on their lower income, their average standard of living, making use of lift clubs or walking to work, and their inability to buy expensive foods, as expensive products would increase their carbon footprint. The perception is that expensive products may have a larger ecological footprint because they often utilise rarer materials and more energy-intensive production processes. However, the relationship between price and ecological impact is not universally consistent, and some high-quality expensive items might be more sustainable in the long run.
The small differences in planet score between the NCOs and WOs, and PSAP and privates might be ascribed to both groups having a lower income than that of officers, a trend also observed by Bayraktar.504
Similar statistical differences were recorded for the environmental footprint and carbon footprint of the different rank groups. Officers scored the highest environmental footprint of 7,6 gha and a carbon footprint of 14,3 TPA, while the other groups' scores for EFs were between 5 gha and 6 gha and CFs between 8,8 TPA and 10,9 TPA. The carbon footprint as a percentage of the environmental footprint shows very few significant differences with a p-value of p=0,12 and a mean value of 60 per cent for WOs and 65 per cent for PSAPs while officers show a value of 63 per cent.
Although there is a small difference between the different rank groups, the only constant high value was reported by officers. Since rank is an indicator of income, this was expected, and these results are corroborated by the research of Flint and Cordero et al.505,506
Departments
In Table 5, the letters (a,b,c) indicate significant differences between departments (groups) and different EF categories at a significance level of 5 per cent (p < 0,05). If at least one letter overlapped between two groups (e.g. b vs ab), then the difference was not significant (p > 0,05). If there were no overlapping letters (e.g. a vs b), then the difference was significant (p < 0,05). The scores marked in blue show the highest scores, and those in red, the lowest scores. To ease the representation of the results, the departments were combined into groups, namely:
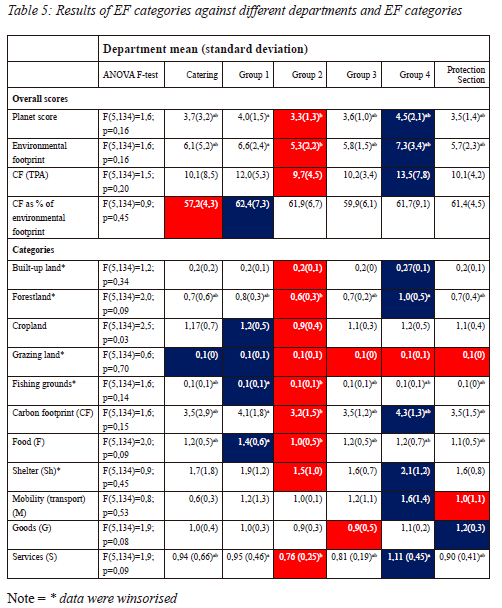
• Group 1 represents the Headquarters (HQ), Communication, Human Resources (HR), Senior Warrant Officer (SWO), and Control departments;
• Group 2 represents the Support Supply Service Centre (SSSC);
• Group 3 represents the Transport and Technical Maintenance Service Centre; and
• Group 4 represents the Emergency Services, and Physical Training, Sport and Recreation (PTSR), and Protection departments.
The different departments do not show significant differences in the number of planets they need to live their daily lives, reflected in the p-value of p=0,16, However, Group 4 recorded a high score of 4,47 Earths, while Group 2 had a lower score of 3,28 Earths. These results are higher than the world average planet score derived from the studies by Lambert and by Fernández et al., where an overall average number of 4,46 Earths or planets were recorded.507,508 The EF score shows a similar pattern with fewer significant differences amongst the departments with a p-value of p=0,16. The highest score was recorded by Group 4 at 7,27 gha, and the lowest score was recorded by Group 2 at 5,33 gha. According to Bayraktar, a high income relates to a high environmental footprint because of the purchasing power that the individual has.509
It seems the carbon footprint and the carbon footprint (as a percentage of the environmental footprint) followed a similar pattern to the planet score and the environmental footprint. However, in the case of the carbon footprint as a percentage of the environmental footprint, Group 1 (HQ, Communication, HR, SWO and Control) recorded the highest carbon footprint as a percentage of the environmental footprint of 62,4 per cent, and catering, the lowest score of 57,2 per cent. One of the reasons for the high carbon footprint of Group 1 can be explained by the increase in consumption patterns of goods and services. The possibility exists that the individuals in this group have large families and earn a high income, which enables them to purchase luxury goods from supermarkets and choose to have a dominantly meat diet instead of vegetables, something also postulated by researchers, such as Bayraktar and Sarkodie.510,511
In general, departments in all categories of the environmental footprint achieved fairly similar results. Even if there were differences, these were not always significant. This may be because the departments are all made up of a mixture of different rank groups. While ranks are representative of income, the mix in ranks negates differences between departments.
Gender
As indicated in Table 6, significant differences were recorded between the environmental footprint, built-up land, cropland, and forest footprint scores. These p-values were p < 0,08 while the other categories recorded scores between p=0,11 and p=0,83, Males dominated all the scores except the carbon footprint as a percentage of the environmental footprint where females scored 61,9 per cent while males recorded 61,2 per cent. Males scored higher (marked in blue) in all the other categories. In their study of university students in India, Raj et al. found no difference between the EF scores of males and females; thus, corroborating the results of this study.512 Reasons for this could be that males and females at the ASB EC live similar lives and take part in very much the same activities, have the same eating habits, and travel almost the same distances to work every day. Bayraktar recorded the same pattern in a study with Turkish pre-service teachers.513
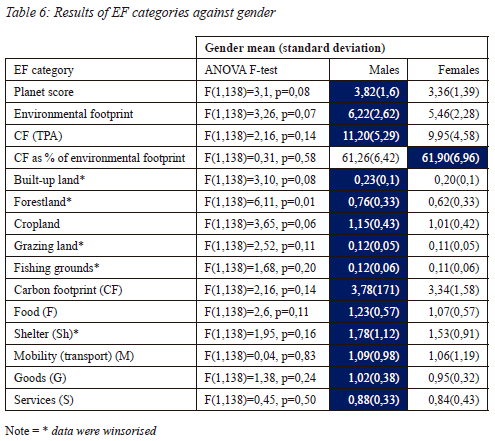
In the current study, males recorded a higher environmental footprint than females. According to Flint, a large environmental footprint can be the cause of a high carbon, transport, food, and goods footprint.514 On the other hand, a low environmental footprint can be contributed to a low food and service footprint, which implies a predominantly vegetable diet, recycling of waste, lower carbon footprint and choosing alternative energy and water consumption methods.515 Three factors that play a significant role in a CF score are related to economic purchasing power, the number of family members, and level of income. People in many cultures have historically expected men to have a prominent role in economic activities, while women were often associated with household responsibilities; however, these roles and perceptions are evolving, and vary widely across different societies.516 Other aspects that contribute to the carbon footprint are a high food and mobility footprint, which add to the increase of gas emissions released into the atmosphere.517,518
The results indicated in Table 6 reveal significant differences between male and female participants. Males recorded a larger environmental footprint than females in almost all categories, suggesting that they have a higher environmental impact than females. This trend is supported by the results of other studies.519
Combined Environmental Footprint and Result
A total of 140 participants completed the GFN online EF calculation. The individual values of the EF calculation were used to calculate the combined ecological footprint of the individual members of the ASB EC participating in the study. The individual EF results were listed in a data matrix table created using an Excel spreadsheet. The combined environmental footprint of all participants in the study was 825,5 gha, with an average of 5,89 gha per participant. After calculating the average environmental footprint based on the total number of ASB EC members, the combined environmental footprint of all members in the ASB EC is 2 709,4 gha. These results are higher than normal gha per participant and average planet score (3,6) when compared to similar studies. Raj et al. calculated the environmental footprint of students at the University of Punjab at 5,58 gha in comparison with that of the general population of India at 0,91 gha.520 In 2007, a world average of 2,7 gha per person was recorded. This increased to 2,8 gha in 2016.521,522Collins et al. and Galli et al. respectively reported a minimum of 1,6 planets in 2012 and a maximum of 2,4 planets in 2016 required by the world population to live their lives the way they were living at the time.523,524 Lambert reported a higher than the world average planet score,525 where an overall number of 4,46 earths or planets were recorded by students; 3,99 by academic personnel; and 4,55 by non-academic personnel. Other studies respectively recorded an EF per person of 4,84 gha, 3,89 gha and 3,65 gha.526,527,528
Rank Groups
The results show that officers had the highest scores in all categories, while PSAPs and privates had the lowest scores. The combined environmental footprint of the members of the ASB EC participating in the study was very high, and the average environmental footprint was higher than the world average of 2,8 gha.529 A possible reason for this result is that a few researchers found that participants had a higher than average initial EF score when they completed the online EF calculation for the first time, and that they were not aware of the demands their lifestyles placed on the environment.530,531,532,533,534 A review of the participants during the current study revealed that the majority of privates were living-ins at military quarters and were dependent on the accommodation that was available at the base. PSAP members might have shared their accommodation with other members, depending on their circumstances. Most senior ranks lived in their own homes and could make their own decisions about their lifestyle. Higher ranks had a higher financial remuneration bracket than privates and PSAP members, which gave them greater freedom in the choice of their living conditions. This result was also reflected by the research of Lambrechts and Van Liedekerke, and Raj et al. who found the same trends for higher-income groups.535,536 This included the high food footprint, independence in terms of the mode of transport, number of years employed, and ability to follow fashion trends, use the latest technology, and keeping up with what is available in the market. Lower income groups are not in a financial position to follow such a lifestyle, a finding that is corroborated by the research of Lambrechts and Van Liedekerke.537
Departments
The departments are combined into smaller groups:
• Group 1 = headquarters (HQ) - communication, human resources, senior warrant officer (SWO) and control;
• Group 2 = supply support service centre (SSSC), procurement and facilities;
• Group 3 = transport and technical maintenance service centre; and
• Group 4 = emergency services and PTSR, as well as protection).
According to the findings highlighted in Table 5, the results of the departments in relation to the three identified EF calculation categories showed that Group 2 had the highest individual EF scores, while Group 4 had the lowest scores. From the results for the EF of different departments at the ASB EC, the individual EF was dominated by Group 4, and the lowest score was that of Group 2. In terms of the land use category, the highest sub-groups were the built-up and forest land footprint for Group 4, and the lowest score was that of Group 2. Group 1 had the highest cropland and fishing ground footprint, while Group 2 again had the lowest score. The catering services recorded the highest grazing land score while all the other groups had a much lower grazing land score.
Group 4 consisted of the Emergency Services and PTRS, while Group 2 consists of SSSC, procurement and facilities. Group 4 was made up the three largest service centres while Group 2 represented the two smallest service centres. In their research, Lambrechts and Van Liedekerke determined that different components could differ in different departments. 538 One of the reasons for the different scores of the two groups might be that Group 4 was less concerned about environmental matters in contrast with Emergency Services and PTSR service centres who worked more closely with the environment. The number of participants might be another contributing factor as well as the possibility that most participants in Group 2 were males while Group 2 had an equal number of male and female participants. The possibility exists that most participants were officers, which put them in a higher income bracket, leading to a lifestyle that translated into a higher EF calculation, something also reported by Li and Young.539 In addition, the high built-up and forest land, carbon, shelter, mobility and services footprint of Group 4 could be explained based on the studies by Collins et al.540 and Raj et al.541 These are all indications of large homes, big families, travelling long distances by car, and preferring to eat in restaurants rather than buying and preparing local fresh produce. The low sub-category scores of Group 2 (built-up, forest, grazing land, fishing grounds, food, shelter and services footprint) are indications of a group that limit travelling by car, eat more fresh foods, have smaller families, and are committed to recycle and reduce energy consumption, trends echoed by Fernandez et al., Galli et al., and Lambrechts and Van Liedekerke.542,543,544
Gender
In the current study, males had the highest scores in 13 of the 15 categories (see Table 6). However, no significant differences between the overall environmental footprint of males and females were found. Results from various other studies indicate that males have a higher environmental footprint than females, while some researchers found no difference between genders, and some studies reported a higher environmental footprint for females.545,546,547,548,549,550
Raj et al. calculated a consumer footprint for students, and found three opinions in terms of the difference in gender EF:551
• No difference was found between the environmental footprint of male and female participants;
• Male participants had a higher environmental footprint than female participants; and
• Female participants had a higher environmental footprint than male participants.552
The three opinions above can be explained by the fact that, in some instances, men and women had similar lifestyles, travelled the same distances, consumed the same processed drinks and food, and used the same technology. Where male participants had a higher EF than female participants, the main reasons related to identical activities with the only difference being that men lived a more outgoing life, travelled more, ate in restaurants, lived with large families in their own homes, did not recycle and were more fashion conscious than women.553,554
In the last instance, female participants had a larger EF than the male participants, which could be linked to female participants who have to travel often in terms of transporting children to and from school, have the purchase power in the household, do not recycle and prefer to take the family to restaurants instead of serving home-cooked meals, use technology to run the household, such as for online purchases, have a prominent social life, and stay up to date with fashion.555,556,557
From these lifestyle examples, it is possible to explain the high EF of males and the low EF for females in the calculation of the environmental footprint of individuals at the ASB EC. Several factors, such as high income, longer travel distances, processed foods, fashion trends, and living with large families in their own homes might be reasons for the higher result for male participants. The reason for the lower EF of females might be connected to their weak purchase power, preferring home-cooked meals for their family, not following fashion trends consciously, rather walking or using a bus to travel from point A to point B, and not being empowered by the use of technology to make their lives easier.558 Another reason for the higher EF of males might be that many participants were men. As a final comment, it should be taken into consideration that, although males generally recorded higher scores for most categories, almost none of these results were significant if statistically interrogated. This means that the results for women and men do not differ significantly.
Concluding Remarks
From the combined EF of the different categories, officers (Group 1 (HQ, Communication, Human Resources, SWO and Control), and Group 4 (Emergency Services and PTSR) as well as males, were the most prominent contributors to the overall environmental footprint of the unit. The high EF of officers might be attributed to several factors, including higher income, elevated CF, and increased shelter, food, and mobility footprints. For Groups 1 and 4, the predominance of officers and males further amplified the collective EF of the members. As far as gender is concerned, male participants recorded higher scores in almost all categories than female participants, although virtually all differences were found to be statistically not significant.
The results of the different rank groups are dominated by officers on the one side of the spectrum, while PSAP and privates on the other side had the lowest scores. This seems to indicate that financial income plays a significant role in the environmental footprint of individuals. No significant difference existed between the different departments, although Group 2 (officers) recorded the lowest score. Group 4 (privates) recorded the highest scores, except in the case of grazing land, and was dominated by male participants who had higher incomes, more expensive lifestyles, more travel expenses and high consumer demand than female participants. Males generally dominate the structure of the ASB EC, and their higher environmental footprint is confirmed by these results and affirmed by various studies, as indicated earlier.
The main findings from this study are that level of income plays the most significant part in the calculation of the environmental footprint of an individual. A high income could influence 90 per cent of the other categories, and officers who fall in a high-income bracket play a dominant role in both the rank group as well as the different groups because where the participants in the group where mostly officers, high scores were recorded in the different categories. This means a high income reflects a more lavish lifestyle and a higher EF. Males dominated the EF calculation, evidenced by an overall high score in the different categories. Males and females in the ASB EC might therefore not have as different EFs as the raw results suggest, but more research is needed to confirm or refute this conclusion.
The study found the GFN online EF calculator to be a suitable tool to measure the ecological footprint of individuals at the ASB EC and to calculate their combined environmental footprint. It is an internationally accepted calculation, and can be used by individuals on their own or in a group context. It is easy to use, and calculations can be done over time to follow the progress of reducing the environmental footprint. The spectrum of the calculator makes it possible for individuals and groups or communities to work on different areas to reduce their environmental footprint. Within the three sub-categories, it is possible to identify specific areas that individuals need to change and where they could adapt their daily lives. The calculation of the environmental footprint of military personnel is a first for the SA military. This calculation could also be used as a benchmark against which to measure other military units.
The SA National Defence Force (SANDF) has a responsibility towards the environment, and one of the ways to commit to this responsibility is through education and training. To establish environmental literacy in the SANDF, education needs to take place at all levels of command, according to an environmental management system (EMS). Based on the research by Smit, the relationship between attitude, behaviour, and knowledge plays a critical role in how soldiers act towards the environment. It is therefore important to improve their knowledge about the environment.559,560
The current study identified several practical issues that could be addressed to improve the environmental footprint of members of the ASB EC. Officers commanding could reduce the number of cars inside unit lines; daily electricity consumption could be reduced by switching lights off during lunch and tea times; recycling of paper and plastic could be initiated both in offices and in the mess; and the unit environmental officer could employ an incentive programme for service centres that would contribute to reducing their environmental footprint.
The preparation of soldiers during basic training and again during formative and promotional courses for officers or NCOs is critical to embed the knowledge that individuals place demands on the environment, and to teach them how to reduce their environmental footprint. The current research established a benchmark for EF calculation in the SA Department of Defence and paved the way for future use of the methods developed for this study.
Acknowledgements
The authors would like to thank Professor Martin Kidd (Centre for Statistical Consultation at the University of Stellenbosch) who assisted with the statistical analysis, which was performed using the STATISTICA 14.0 program.
446 Desiré Fouché joined the South African Defence Force in 1986 as a volunteer. After completing the Non-Commissioned Officers and Officers courses in 1989, she started her training as an Intelligence Officer and served as an Intelligence -, Military Security - and Counter Intelligence Officer until 2001 when she joined the Reserve Force Regional Office in the Eastern Cape. Desiré completed the Senior Command and Staff Duties programme at the SA Army War College in Pretoria in 2011. The topic of her research paper was "The effect of Global Warming on the SANDF" for which she received the floating trophy for the best research paper. Desiré completed her Degree in Environmental Management in 2015 at UNISA and successfully finished her MMil in Military Geography in December 2022. Her master's degree-related research forms the basis of this article.
447 Hennie Smit is an Emeritus Associate Professor of Military Geography at the University of Stellenbosch, South Africa. Hennie lectured in Military Geography in the Faculty of Military Science at the South African Military Academy from 1999 to 2022. During his tenure, he was awarded the Rector's Award for Excellence in Teaching on three occasions, served as Head of the Department of Military Geography for five terms, and was elected Chair of the School for Geospatial Studies and Information Systems for the 2012 to 2014 term. He also served as President of the International Association for Military Geosciences from 2017 to 2022. In 2020 he was awarded the Society of South African Geographers' Gold Medal award for his contribution to Geography in South Africa over more than two decades.
448 Ivan Henrico served in the South African National Defence Force for more than a decade as an intelligence officer. He obtained his PhD in Geoinformatics from the University of Pretoria in 2017. His expertise includes geosciences, geography, geopolitics, and geophysics, and is currently the chair of the School of Geospatial Studies and Information Systems at the Faculty of Military Science, Stellenbosch University. He is the co-chair of the UN Open GIS Initiative Working Group 2 (Capacity Building), chair of the research committee at the Faculty of Military Science, and serves on the faculty's executive committee. Ivan has published numerous accredited papers and presented at various national and international conferences. In 2021, he received the Faculty of Military Science Achievement Award for outstanding research outputs; and in 2022, he was the recipient of the Chris Nelson Floating Trophy for a significant contribution to the teaching excellence of the Faculty of Military Science.
449 Global Footprint Network, 'Measure What You Treasure', 2021. <http://www.footprintnetwork.org> [Accessed on 4 October 2022], 1-10,
450 A Collins, A Galli, N Patrizi & FM Pulselli, 'Learning and Teaching Sustainability: The Contribution of Ecological Footprint Calculators', Journal of Cleaner Production, 174 (2018), 1000-1010, [ Links ]
451 W Baabou, N Grunewald, C Ouellet-Plamondon, M Gressot & A Galli, 'The Ecological Footprint of Mediterranean Cities: Awareness Creation and Policy Implications', Environmental Science & Policy, 69 (2017), 94-104. [ Links ]
452 Collins et al., 'Learning and Teaching Sustainability'.
453 Baabou et al., 'The Ecological Footprint of Mediterranean Cities'.
454 J Moore, M Kissinger & WE Rees, 'An Urban Metabolism and Ecological Footprint Assessment of Metro Vancouver', Journal of Environmental Management, 124 (2013), 51-61. [ Links ]
455 Baabou et al., 'The Ecological Footprint of Mediterranean Cities'.
456 Collins et al., 'Learning and Teaching Sustainability' .
457 M Fernandez, A Alférez, S Vidal, M Fernandez & S Albareda, 'Methodological Approaches to Change Consumption Habits of Future Teachers in Barcelona, Spain: Reducing their Personal Ecological Footprint', Journal of Cleaner Production, 122 (2016), 154-163.
458 A Galli, K Iha, M Halle, H El Bilali, N Grunewald, D Eaton, R Capone, P Debs & F Bottalico, 'Mediterranean Countries' Food Consumption and Sourcing Patterns: An Ecological Footprint Viewpoint', Science of the Total Environment, 578 (2017), 383-391.
459 M Wackernagel & B Beyers, Ecological Footprint: Managing our Biocapacity Budget (Gabriola Island, BC, Canada: New Society Publishers, 2019).
460 Collins et al., 'Learning and Teaching Sustainability'.
461 Fernández et al., 'Methodological Approaches'.
462 Collins et al., 'Learning and Teaching Sustainability'.
463 HAP Smit & J van der Merwe, 'Military Environmental Literacy in the South African Army', Scientia Militaria: South African Journal of Military Studies, 46 (2018), 59-77. [ Links ]
464 H Smit, 'Developing Military Environmental Literacy in the South African Army through a Dedicated Military Environmental Management Course', Scientia Militaria: South African Journal of Military Studies, 48 (2020), 75-96. [ Links ]
465 Smit, 'Developing Military Environmental Literacy'.
466 Smit, 'Developing Military Environmental Literacy'.
467 M Wackernagel & W Rees, Our Ecological Footprint: Reducing Human Impact on the Earth (Canada: New Society, 1998).
468 AK Jorgenson, B Clark & J Kentor, 'Militarization and the Environment: A Panel Study of Carbon Dioxide Emissions and the Ecological Footprints of Nations, 1970-2000', Global Environmental Politics, 10 (2010), 7-29.
469 Galli et al., 'Mediterranean Countries' Food Consumption' .
470 Wackernagel & Beyers, Ecological Footprint.
471 NC Crawford, 'The Defense Department is Worried about Climate Change - and also a Huge Carbon Emitter', Che Conversation, 2021. <https://theconversation.com/the-defense-department-is-worried-about-climate-change-and-also-a-huge-carbon-emitter-118017> [Accessed on 4 March 2021].
472 C Davies, 'Don't Mention the US Military Carbon Footprint!', Pressenza, 2020, <https://www.pressenza.com/2020/02/dont-mention-the-us-military-carbon-footprint> [Accessed on 4 March 2020].
473 Moore et al., 'An Urban Metabolism'.
474 L Nunes, A Catarino, MR Teixeira & E Cuesta, 'Framework for the Inter-comparison of Ecological Footprint of Universities', Ecological Indicators, 32 (2013), 276-284.
475 Liebenberg, personal communication, 10 October 2019.
476 Wackernagel & Rees, Our Ecological Footprint.
477 A Galli, K Iha, SM Pires, MS Mancini, A Alves, G Zokai, D Lin, A Murthy & M Wackernagel, 'Assessing the Ecological Footprint and Biocapacity of Portuguese Cities: Critical Results for Environmental Awareness and Local Management', Cities, 96 (2020), 1-11.
478 Y-L Lee & S-Y Lin, 'Vulnerability and Ecological Footprint: A Comparison between Urban Taipei and Rural Yunlin, Taiwan', Environmental Science and Pollution Research, 27 (2020), 34624-34637.
479 A Lim, 'What is Ecological Footprint? Definition and How to Calculate it', Treehugger, 2022. <https://www.treehugger.com/what-is-ecological-footprint-4580244> [Accessed on 1 March 2022].
480 Fernandez et al., 'Methodological Approaches'.
481 B Brownell, 'Calculating the Ecological Footprint of the Built Environment', Architect Magazine, 26 (2017).
482 Collins et al., 'Learning and Teaching Sustainability'.
483 CR Kothari, Research Methodology: Methods and Techniques (Abingdon: New Age International, 2004).
484 Kothari, Research Methodology.
485 R Kumar, Research Methodology: A Step-by-step Guide for Beginners (London: Sage, 2018).
486 Overshoot Day marks the date when humanity's demand for ecological resources and services in a given year exceeds what the Earth can regenerate in that year. It represents the point at which our consumption surpasses the planet's ability to replenish. See Earth Overshoot Day, 'This Year's Earth Overshoot Day Fell on August 2', 2023. <https://www.overshootday.org/> Accessed on 2 August 2023.
487 Global Footprint Network, 'Measure What You Treasure'.
488 Kumar, Research Methodology.
489 Kumar, Research Methodology.
490 W Trochim, J Donnelly & K Arora, The Essential Research Methods Knowledge Base (Boston: Cengage, 2016).
491 C Wagner, B Kawulich & M Garner, Doing Social Research: A Global Context (e-book, McGraw Hill, 2012).
492 R Maluleke, 'Mid-year Population Estimates 2021', Statistics South Africa, 2022. <http://www.statssa.gov.za/publications/P0302/Mid%20year%20estimates%202021_presentation.pdf> [Accessed on 15 November 2021].
493 ASB EC Command Directive, personal communication, February 12, 2020.
494 PSAP serve the public service as auxiliary service members. See South African Government, 'Public Service Act, 1994'. <https://www.gov.za/documents/constitution-republic-south-africa-rationalisation-public-administration-replacement-laws> [Accessed on 15 January 2023].
495 Trochim et al., The Essential Research Methods Knowledge Base.
496 Kumar, Research Methodology.
497 MJ Polonsky & DS Waller, Designing and Managing a Research Project: A Business Student's Guide (Place: Sage, 2018).
498 Kumar, Research Methodology.
499 Polonsky & Waller, Designing and Managing a Research Project.
500 K Kaiser, 'Protecting Respondent Confidentiality in Qualitative Research', Qualitative Health Research, 19 (2009), 1632-1641.
501 Polonsky & Waller, Designing and Managing a Research Project.
502 The p-value indicates the probability that the differences detected were only coincidental and not real differences. The closer to 1, the higher the probability of a coincidental difference, and therefore the more evidence to accept the null hypothesis (i.e. there is no difference). The closer to zero, the more evidence that the difference was not coincidental, which implies the null hypothesis is rejected. If p < 0,05, then the hypothesis can be rejected at a 5% significance level (Prof. M Kidd, Stellenbosch University, personal communication, 9 February 2022).
503 To 'winsorise' means to set extreme outliers equal to a specified percentile of the data.
504 S Bayraktar, 'Pre-service Primary Teachers' Ecological Footprint Awareness: Are There Differences Based on Gender, Educational Level of Parents, and Longest-lived Place of Residence', PUPIL: International Journal of Teaching Education and Learning, 3, 1 (2019), 230-244. https://doi.org/10.20319/pijtel.2019.31.230244
505 K Flint, 'Institutional Ecological Footprint Analysis: A Case Study of the University of Newcastle, Australia', International Journal of Sustainability in Higher Education, 2 (2001), 48-62.
506 EC Cordero, AM Todd & D Abellera, 'Supplement: Climate Education and the Ecological Footprint', Bulletin of the American Meteorological Society, 89 (2008), ES36-ES38.
507 ME Lambert, The SJSU Ecological Footprint Challenge and its Impacts on Pro-environmental Behavior (MSc thesis, San Jose State University, 2013).
508 Fernandez et al., 'Methodological Approaches'.
509 Bayraktar, 'Pre-service Primary Teachers' Ecological Footprint Awareness'.
510 Bayraktar, 'Pre-service Primary Teachers' Ecological Footprint Awareness'.
511 SA Sarkodie, 'Environmental Performance, Biocapacity, Carbon & Ecological Footprint of Nations: Drivers, Trends and Mitigation Options', Science of the Total Environment, 751 (2021), Art. 141912.
512 S Raj, S Goel, M Sharma & A Singh, 'Ecological Footprint Score in University Students of an Indian City', Journal of Environmental and Occupational Health, 1 (2012), 23-26.
513 Bayraktar, 'Pre-service Primary Teachers' Ecological Footprint Awareness'.
514 Flint, 'Institutional Ecological Footprint Analysis'.
515 Flint, 'Institutional Ecological Footprint Analysis'.
516 Sarkodie, 'Environmental Performance'.
517 Fernandez et al., 'Methodological Approaches'.
518 B Bleys, B Defloor, L van Ootegem & E Verhofstadt, 'The Environmental Impact of Individual Behavior: Self-assessment versus the Ecological Footprint', Environment and Behavior, 50 (2018), 187-212.
519 Bayraktar, 'Pre-service Primary Teachers' Ecological Footprint Awareness'; Fernandez et al., 'Methodological Approaches'; Flint, 'Institutional Ecological Footprint Analysis'; Raj et al., 'Ecological Footprint Score'; Sarkodie, 'Environmental Performance'.
520 Raj et al., 'Ecological Footprint Score'.
521 Raj et al., 'Ecological Footprint Score'.
522 Collins et al., 'Learning and Teaching Sustainability'.
523 Collins et al., 'Learning and Teaching Sustainability'.
524 Galli et al., 'Assessing the Ecological Footprint' .
525 Lambert, The SJSU Ecological Footprint Challenge.
526 Fernandez et al., 'Methodological Approaches'.
527 D Gottlieb, E Vigoda-Gadot & A Haim, 'Encouraging Ecological Behaviors among Students by Using the Ecological Footprint as an Educational Tool: A Quasi-experimental Design in a Public High School in the City of Haifa', Environmental Education Research, 19 (2013), 844-863.
528 P McManus & G Haughton, 'Planning with Ecological Footprints: A Sympathetic Critique of Theory and Practice', Environment and Urbanization, 18 (2006), 113-127.
529 World Wide Fund, 'Ecological Footprint', 2023. https://wwf.panda.org/discover/knowledge_hub/all_publications/ecological_footprint2/ [Accessed on 5 August 2023].
530 Collins et al., 'Learning and Teaching Sustainability'.
531 Fernandez et al., 'Methodological Approaches'.
532 Gottlieb, et al., 'Encouraging Ecological Behaviors'.
533 Raj et al., 'Ecological Footprint Score'.
534 McManus & Haughton, 'Planning with Ecological Footprints' .
535 W Lambrechts & L van Liedekerke, 'Using Ecological Footprint Analysis in Higher Education: Campus Operations, Policy Development and Educational Purposes', Ecological Indicators, 45 (2014), 402-406.
536 Raj et al., 'Ecological Footprint Score'.
537 Lambrechts & Van Liedekerke, 'Using Ecological Footprint Analysis' .
538 Lambrechts & Van Liedekerke, 'Using Ecological Footprint Analysis' .
539 P Li & G Yang, 'Ecological Footprint Study on Tourism Itinerary Products in Shangri-La, Yunnan Province, China', Acta Ecologica Sinica, 27 (2007), 2954-2963.
Collins et al., 'Learning and Teaching Sustainability'.
541 Raj et al., 'Ecological Footprint Score'.
542 Fernandez et al., 'Methodological Approaches'.
543 Galli et al., 'Assessing the Ecological Footprint'.
544 Lambrechts & Van Liedekerke, 'Using Ecological Footprint Analysis' .
545 Fernandez et al., 'Methodological Approaches'.
546 Bayraktar, 'Pre-service Primary Teachers' Ecological Footprint Awareness'.
547 Bleys et al., 'The Environmental Impact of Individual Behavior'.
548 Cordero et al., 'Supplement: Climate Education'.
549 Flint, 'Institutional Ecological Footprint Analysis'.
550 A Dor & M Kissinger, 'A Multi-year, Multi-scale Analysis of Urban Sustainability', Environmental Impact Assessment Review, 62 (2017), 115-121.
551 Raj et al., 'Ecological Footprint Score'.
552 Raj et al., 'Ecological Footprint Score'.
553 V Solar, 'Comparative Study on Male and Female Personal Ecological Footprint', International Conference on Biotechnology and Environment Management, 2, 5 (2011), 399-401.
554 A Toledo-Bruno & M Medina, 'Ecological Footprint of University Students: Does Gender Matter? Global Journal of Environmental Science and Management, 2, 4 (2016), 2-6.
555 Collins et al., 'Learning and Teaching Sustainability'.
556 Fernandez et al., 'Methodological Approaches'.
557 Raj et al., 'Ecological Footprint Score'.
558 Fernandez et al., 'Methodological Approaches'.
559 Smit & Van der Merwe, 'Military Environmental Literacy'.
560 Smit, 'Developing Military Environmental Literacy'.

