


Serviços Personalizados
Artigo
 Inglês (pdf)
 Artigo em XML
 Referências do artigo
Indicadores

Links relacionados
-
 Citado por Google
 -
 Similares em Google
Compartilhar

 Permalink
South African Journal of Childhood Education
versão On-line ISSN 2223-7682
versão impressa ISSN 2223-7674
SAJCE vol.10 no.1 Johannesburg 2020
http://dx.doi.org/10.4102/sajce.v10i1.646
ORIGINAL RESEARCH
Relationship between academic achievement, visual-motor integration, gender and socio-economic status: North-West Child Health Integrated with Learning and Development study
Dané Coetzee; Anita E. Pienaar; Yolanda van Wyk
Physical Activity, Sport and Recreation (PhASRec), North-West University, Potchefstroom, South Africa
ABSTRACT
BACKGROUND: Inconsistencies are found regarding the relationship between academic achievement and visual-motor integration (VMI), gender and socio-economic status (SES).
AIM: The study examined the associations between academic achievement in different compulsory learning areas and VMI skills, and what role gender and SES play.
SETTING: A total of 863 participants (n = 538, low SES group; n = 325, high SES group) from 20 schools in four school districts in the North West province of South Africa were randomly selected to participate.
METHODS: The Beery Visual-Motor Integration Test, 4th edition (VMI-4) was used to evaluate the VMI, visual perception and motor coordination skills; and the June mid-year school assessment (JMSA) and the Annual National Assessment (ANA) marks were used to examine their academic achievements. Spearman rank-order correlations and stepwise regression analyses were used to, examine significant associations and unique contributors, respectively.
RESULTS: Small-to-moderate significant correlations were found between all the learning areas assessed during the JMSA and the ANA examinations and the VMI-4. The strongest correlations occurred between visual perception and most of the learning areas. Socio-economic status had the greatest predictive association with most of the academic learning areas. The largest contributions (≥ 10% moderate, ≥ 25% great) of SES were found during the JMSA in English, life orientation, mathematics, natural science, social sciences and in the grade point averages. During the ANA, SES had the highest predictive contribution to English and mathematics.
CONCLUSION: The overall academic achievement of learners could be negatively affected by their SES and visual perception skills, that suggest timeously prevention strategies to counter these effects.
Keywords: visual-motor integration; visual perception; motor coordination; socio-economic status; academic achievement; learning areas.
Introduction
Visual-motor integration (VMI) refers to the extent to which visual perception (VP) and motor coordination (MC) (finger-hand movements) are harmoniously co-ordinated. Visual perception is described by various researchers (Beery & Buktenica 1997; Haywood & Getchell 2009; Wilson & Fakel 2004) as an acquired process which involves how visual stimuli that are received are perceived, interpreted and understood - thus how images obtained through sight are transformed into useful information. Motor coordination is described by Lane (2005) and Winnick (2005) as the ability to co-ordinate vision with bodily movement, and plays an important role in effective hand-eye coordination and fine motor activities such as drawing, copy-drawing and colouring, which are, in turn, important skills for learning to write (Grissmer et al. 2010; Wilson & Falkel 2004). The ability to correctly copy geometric forms, letters and pictures in a suitable space involves effective development and use of spatial orientation, memory, fine motor development, visuospatial encoding, motor planning, order and cognition (Lane 2005). Beery and Buktenica (1997) indicate that learners' ability to copy geometrical shapes has a significant relationship with their school achievement. Visual perception and motor skills develop rapidly during the early childhood years and a certain level of maturity has to be reached before learners are able to learn to read, write and become numerate (Lane 2005). Developmental delays in any of these skills can lead to delays in the development of academic skills (Beery & Beery 2010; Case-Smith 2005).
The links between VMI, VP and MC skills and reading, writing and general academic achievement have been studied and confirmed by various researchers (De Waal, Pienaar & Coetzee 2018; Grissmer et al. 2010; Lopes et al. 2013; Pagani et al. 2010; Pienaar, Barhorst & Twisk 2013; Watson et al. 2003). It would appear, however, that the link between VMI and school performance weakens as learners progress through school (Weintraub & Graham 2000). However, there are various studies in the literature that have already investigated and confirmed the links between handwriting and VMI (Borsting & Barnhardt 2001; Kaiser, Albert & Doudin 2009) and handwriting and academic performance (Roth, McCaul & Barnes 1993). For good handwriting, it is necessary to have adequate fine motor control and VMI skills as well as suitable motor planning, proprioception, and VP (Gabbard 2008; Payne & Isaacs 2008); sustained attention or concentration, hand-eye coordination (Grissmer et al. 2010); and finger sensory awareness (Feder & Majnemer 2007). Difficulties in any of the above-mentioned skills can lead to untidy handwriting and can negatively impact a child's overall academic achievement and school readiness (Capellini, Coppede & Vale 2010; Feder & Majnemer 2007; Grissmer et al. 2010; Pagani et al. 2010). Researchers have also investigated and confirmed the links between VMI and VP (Bezrukikh & Terebova 2009; Coetzee, Pienaar & Van Wyk 2019; Haywood & Getchell 2009).
Direct relationships between performance in mathematics and VMI of learners have been reported in the literature by various researchers (Borsting & Barnhardt 2001; Pereira et al. 2011; Pieters et al. 2012; Mayes et al. 2009). Similar relationships have also been reported with VP (De Waal et al. 2018; Geary 2004; Kulp et al. 2004; Pieters et al. 2012; Watson et al. 2003), MC (Van Niekerk 2012) and fine motor skills (Grissmer et al. 2010; Pagani et al. 2010; Son & Meisels 2006). A study by Pienaar et al. (2013) in the North West province of South Africa showed that VMI and VP are strongly related to basic literacy skills, including mathematics, reading and writing literacy. Another South African study (De Waal et al. 2018) also reported a relationship between VP and academic achievement, irrespective of children experienced signs of perceptual motor difficulties. Furthermore, Grissmer et al. (2010) reported that fine motor skills (which include hand-eye coordination) are important developmental predictors for later academic achievements. In agreement, Pagani et al. (2010) also reported that fine motor skills play a significant role in the prediction of later academic achievements and school readiness, especially regarding reading and mathematics.
In the past, various studies have focussed on the link between gender and academic performance where comparisons between mathematics and gender are the most general field of study. Research findings in this regard, however, are not significant, age-dependent or inconsequential (Gonzales et al. 2004; Penner 2003; Voyer, Voyer & Bryden 1995). The findings of Lachance and Mazzocco (2006) also support the general view of minimal or no gender differences in mathematical skills among primary school learners. However, Pagani et al. (2010) reported that girls who struggled with mathematics in kindergarten still had lower mathematics grades in Grade 2. These researchers further reported that the boys who struggled with mathematics in kindergarten outperformed the girls (who also had low mathematics scores in kindergarten) in Grade 2. One constant in the literature is the suggestion that the size of the differences varies with age (Voyer et al. 1995). In cases where gender differences are indicated, the extent of the differences is directly linked to the degree of difficulty of the problem, and it would seem that the differences are clearer between the groups of high or lower performing individuals (Gonzales et al. 2004; Penner 2003). Deary et al. (2007) in the United Kingdom did a 5-year longitudinal study on 74 403 English learners (36 894 boys and 37 509 girls) and found moderate differences between the genders in the different learning areas, where girls significantly outperformed the boys in all the learning areas with the exception of physics. The effect of gender on academic achievement in general as well as on reading, writing and mathematics has been studied by various researchers, while only few studies could be found that investigated links between all learning areas that are offered in the school curriculum separately. The same shortcoming is found with regard to studies focussing on socio-economic status (SES) influences on academic achievement.
A worldwide increase in learners who grow up in low socio-economic conditions is reported (Caro, McDonald & Williams 2009; Portela 2007; Walker et al. 2007). Various studies (Delemarre-Van de Waal 1993; Gallahue & Ozmun 2006; Taylor & Yu 2009) have found with regard to the factors that inhibit optimal performance of learners that these can be aligned with the different systems as described in Bronfenbrenner's (1979) ecological systems theory (EST). This theory distinguishes amongst four systems of social development, and later also a fifth one, the chrono-system, which encapsulates the changes and interaction amongst these four systems that contribute to the changes that take place in one's lifespan, and that play a role in one's development. Higher socio-economic conditions are associated with better learning environments, within which a child's development occurs. The negative effect of SES on learners' general development and academic performance has been studied by various researchers in South Africa as well as worldwide (Bush et al. 2010; Du Plessis, Coetzee & Pienaar 2015; Grissmer & Eiseman 2008; Grissmer et al. 2010; Lotz, Loxton & Naidoo 2005; Pienaar et al. 2013; Roth et al. 1993; Taylor & Yu 2009). In South Africa, national statistics show a close relationship between population group (race) and level of poverty (low SES), as more than half of the black population live in poverty (Stats SA 2014). Taylor and Yu (2009) reported that education inequality trends in South Africa reflect the general nature of income disparity. According to them, strong disparity is visible with a strong basis in race and growing social class dimensions. These researchers furthermore report that in some countries, like South Africa, the gap in educational equality that is found between high and low SES learners has a cumulative effect, which could inevitably lead to greater gaps in academic achievements over time (Taylor & Yu 2009). In this regard, Grissmer et al. (2010) report that the children from disadvantaged areas are likely to struggle with the development of fine motor skills that are needed for later academic success because of a lack of opportunities. Children who grew up in the lower SES or high-risk areas enter the formal school system with already-existing delays in terms of cognitive development (Walker et al. 2007). Gorard and See (2009) reported a negative relationship between low SES and achievement in the age-expected standards in English, mathematics and science in England Maples (2003). In South Africa, the quality of education of learners from low SES has increased at a reasonable tempo. Unfortunately, there are still significant racial gaps in the percentage of learners who pass Grade 12 (Anderson, Case & Lam 2001; Beckman 2011). The average national Grade 12 pass rate for the North West province was 87.2% (88.8% boys, 85.9% girls) in 2013 (Anderson et al. 2001; Stats SA 2013b).
This literature background revealed that various studies have been conducted that confirmed SES as a good predictor of VMI status as well as of overall academic achievement. The literature has also confirmed correlations between VMI skills (fine motor skills), VP skills and academic achievements of learners. However, only a few studies could be found that was performed not only on South African learners but also worldwide who have studied the role of different elements of visual-motor skills on all the different compulsory school learning areas. In addition, only few studies with unequivocal results could also be found regarding the possible contribution of gender to the different learning areas. If a better understanding of such links can be established through this study, the findings of this study can contribute to not only more focussed interventions but also prevention strategies for learners with academic difficulties that are related to VMI, gender and SES.
With the above literature as background, the purpose of the present study is to examine the relationship between academic achievement in the different learning areas of the South African school curriculum and VMI, VP and MC skills. The role of gender and SES on the academic achievement in the different learning areas among 9- and 10-year-old learners in the North West province in South Africa will also be investigated.
Research methodology
Study design and participants
This study is a cross-sectional study within the longitudinal North-West Child Health Integrated with Learning and Development (NW-CHILD) study, which consists of three time point measurements collected over a period of 6 years (2010, 2013, 2016). The sample was selected by means of stratified random sampling in conjunction with the Statistical Consultation Service of the University. To determine the sample for baseline measurements, a list of names of schools in the North West province was obtained from the Department of Basic Education. From the list of schools of the North West province, which contains eight education districts and each represented 12-22 regions with about 20 schools (minimum 12, maximum 47) per region, 4 regions and 20 schools were randomly selected with regard to population density and school status. In South Africa, the Department of Basic Education divides schools into five quintiles (categories) on the basis of their poverty classification (Hall & Giese 2009), where quintile 1 represents the least well-off schools, while quintile 5 represents the best-off schools. The poverty classification of schools is performed in accordance with the national poverty table as compiled by the Treasury (Hall & Giese 2009) and includes the income levels, dependency relations and the literacy levels of the inhabitants of the area (Hall & Giese 2009; Stats SA 2013a). For the purposes of this study, the five quintiles were only divided into two groups, where the low SES group represented quintiles 1-3 and the high SES group represented quintiles 4 and 5. Boys and girls were randomly chosen from each school to make up the participants for the research group. Data of the first follow-up measurement of the learners (living in different regions of the North West province of South Africa) in 2013 were used solely for the purposes of the study. The total number of subsamples that were included in this study was 863 (453 boys and 410 girls) learners in Grades 3 and 4 with a mean age of 9.9 years (±0.42).
Measuring instruments
The Developmental Tests of Visual-Motor Integration, Fourth Edition
The Developmental Tests of Visual-Motor Integration, Fourth Edition (VMI-4) (Beery & Buktenica 1997) is a measuring instrument that consists of three sections, VMI as well as two supplementary tests, VP and MC. The first subtest of the VMI-4 consists of 27 geometrical shapes (development sequential) that have to be copied with pencil and paper. The VMI test can be performed in group context or individually within a period of about 10-15 minutes. This test is suitable for use from preschool children to adults. The visual-perceptual subtest requires that the correctly corresponding form is identified for each specific picture. The MC sub-test entails completing the dots in a geometric shape and takes approximately 5 min to complete. The given form must be redrawn as accurately as possible while remaining within the lines. The MC sub-test can be carried out individually or in a group, but is only ceased when the time is up. The two supplementary tests (VP and MC) are separately assessed and marks given. The VMI-4-marks allocation is performed in accordance with the number of test items completed correctly. Cessation of the assignment occurs as soon as the person makes the same mistake in three consecutive test items, if the allocated time expires, or with completion of the section. For incorrect performances, a '0' is assigned and a '1' for those carried out correctly. Points are therefore allocated according to the number of test items the person carried out correctly. The total mark is processed into a standard score according to which the person is allocated to one of five classes (far below average class 5 to far above average class 1). The division of the groups was as follows: 40-67 is far below average; 68-82 is below average; 83-117 is average; 118-132 is above average; 133-160 is far above average. The VMI test as well as supplementary VP and MC tests each had a general reliability of r = 0.92, r = 0.91 and r = 0.89 (Beery & Buktenica 1997). Data were collected by senior researchers who were qualified as Kinderkineticists and Kinderkinetic Honours students who had all completed in-depth training of the applicable standard test before data collection started. In cases where English or Afrikaans was not a participant's mother tongue, pre-trained interpreters explained each test to the participant.
Curriculum and assessment policy statement and Annual National Assessment
According to the Department of Basic Education's Curriculum and Assessment Policy Statements (CAPS), the six learning areas include the following: mathematics, home language, second language, life orientation (LO), natural sciences and social sciences. All the official languages in South Africa (Afrikaans, English, isiNdebele, isiXhosa, isiZulu, Sepedi, Sesotho, Setswana, SiSwati, Tshivenda and Xitsonga) are included in Grade 4 language learning. Home language refers to one or two languages offered at home language level (this is applicable for each school or learning district), while the second language refers to a language that is not a mother tongue but that is used for certain communicative functions in a society or in the classroom (Department of Basic Education. Curriculum Assessment Policy Statements [CAPS] 2014). Assessment guidelines for the Annual National Assessment (ANA) of South African learners indicate that learners are evaluated based on knowledge that had to be mastered during the first three terms of the school year, which extends from January to December. For the scholastic achievements, we requested from each involved school, Grade 3 and Grade 4 participants' academic progress reports from June 2013, reflecting percentages obtained in each learning area, a grade point average and grading codes in the learning areas set out by the Department of Basic Education Curriculum and Assessment Policy Declarations (CAPS): (1) mathematics, (2) native language and (3) first additional language (Department of Basic Education, South Africa 2011b). The grading codes were as follows: (1) '7' was awarded for exceptional achievement (80% - 100%), (2) '6' for meritorious achievement (70% - 79%), (3) '5' described significant achievement (60% - 69%), (4) '4' sufficient achievement (50% - 59%), (5) '3' average achievement (40% - 49%), (6) '2' basic achievement (30% - 39%) and (7) '1' was allocated when the learning outcome 'was not reached' (0% - 29%). In addition, we obtained scores (also in percentages) on the ANA, conducted on a provincial level to assess learners' achievement, including the following learning areas: Afrikaans, English, Setswana and Mathematics. The June mid-year assessments are compiled and scored by the applicable learning area teachers. The ANA tests are compiled nationally by the Department of Basic Education and only scored by the teachers, making it a more objective, representative and comparative assessment of learners' academic achievements in South Africa.
Data analysis and statistical procedures
The 'Statistica for Windows' Statsoft computer program package was used (StatSoft 2015) to analyse the data. The statistical consultation service of the university was consulted regarding the most suitable statistical analysis to be performed. Data were firstly analysed descriptively by way of means (M) and standard deviations (SD) to examine the level of 9-10-year-old learners' VMI, VP and MC skills. Non-parametric Spearman rank-order correlation coefficients were used to examine possible relationships among the different school learning areas (as determined according to the mid-year school and the September ANA results) and VMI, VP and MC skills. Effect sizes that provide cut-offs for practical significance of derived correlations were set at r ≥ 0.1 as a small effect, r ≥ 0.3 a medium effect and r ≥ 0.5 a large effect. A stepwise regressions analysis was used for exploratory purposes to examine statistically significant meaningful dependence between academic achievement in the different learning areas during the June mid-year school assessments (JMSA) and the ANA (dependent variables) with the independent variables, VMI, VP, MC, gender and SES. Furthermore, this was also used to determine the independent variables that indicated the largest contribution to the total variance in the different academic learning areas. The contribution of each independent variable to a learning area is represented by a percentage, where R2 ≥ 1% indicated a small contribution, R2 ≥ 10% a medium contribution and R2 ≥ 25% a large contribution. The adjusted R2 (which represents the joint contribution of the independent variables in the regression predictions) is only regarded as meaningful at 25% and more (adjusted R2 ≥ 0.25). In this analysis, statistical significance was set at a p-level ≤ 0.05, while the following guidelines were used in the interpretation of practical significance (d): ≥ 0.2 indicates a small effect, d ≥ 0.5 indicates a medium effect and d ≥ 0.8 indicates a large effect (Cohen 1988).
Results
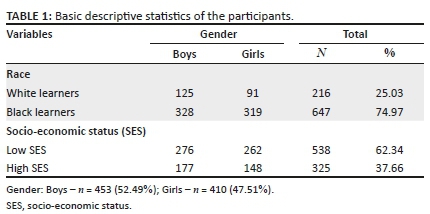
Table 1 describes the research group of 9-10-year-old learners with regard to age, gender, race and SES. The total of 863 study participants (453 boys and 410 girls) had a mean age of 9.9 years (±0.42), with 216 white learners (125 boys and 91 girls) and 647 black learners (328 boys and 319 girls). Five-hundred and thirty-eight (62.34%) of the participants represented the low SES group, while 325 (37.66%) represented the high SES group.
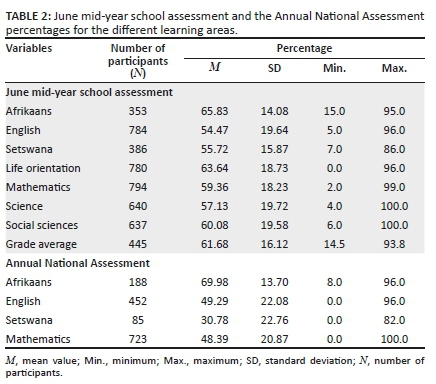
In Table 2, the basic descriptive statistics of the JMSA and the ANA percentages for the different learning areas for the group as a whole are represented. The learning area in which the learners obtained the highest group average (65.83%; 69.98%) was Afrikaans in both the JMSA and ANA learning areas, respectively. The lowest mean percentages for the group in the JMSA (54.47%) were seen in the English results, while Setswana percentages (30.77%) were the lowest in the ANA results.
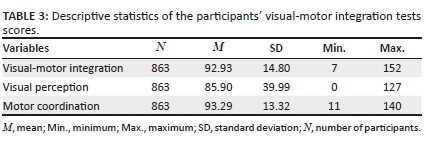
In Table 3, the basic descriptive statistics of the VMI tests scores for the group are represented. Standard scores of VMI (92.93 ± 14.82), VP (85.90 ± 39.99) and MC skills (93.29 ± 13.32) were found in this analysis.
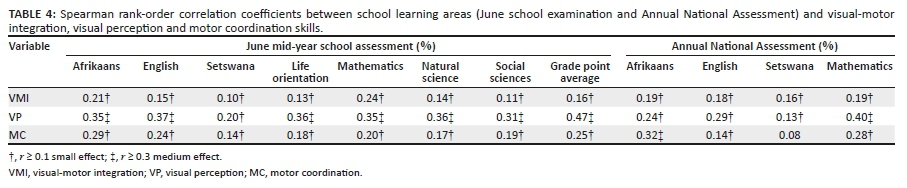
Spearman rank-order correlation coefficients were subsequently used to examine possible correlations between the different school learning areas (JMSA and ANA) and VMI, VP and MC skills. These results are reported in Table 4. It reveals medium significant correlations between VP and all the JMSA learning areas (Setswana excluded, r = 0.2), where the largest significant correlation occurred between VP skills (r = 0.47) and the grade point average. All the learning areas that were assessed during the JMSA and the ANA assessment further revealed small significant correlations (r ≥ 0.1) with VMI and MC skills. The only non-significant (r < 0.1) correlation between the dependent and the independent variables was between the ANA's Setswana and MC skills (r = 0.08).
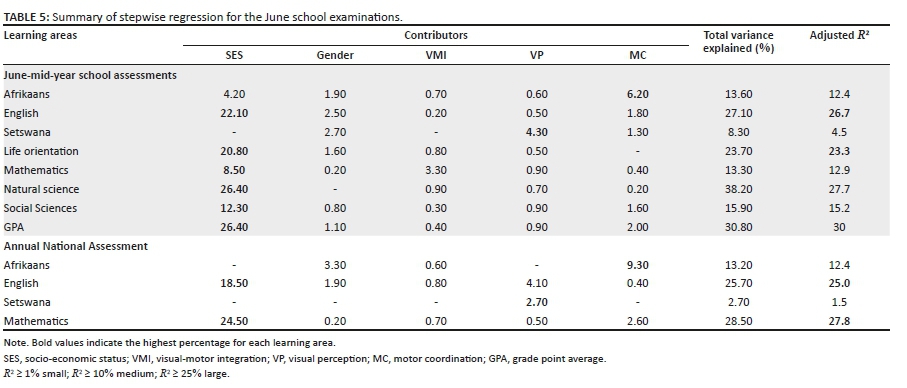
Lastly, a stepwise regression analysis was performed to examine the statistically and practically meaningful dependency between academic achievement in the JMSA (with regard to all the different school learning areas and not only language) and ANA learning areas (which included first and second language and mathematics) (dependent variables) and the independent variables that included VMI, VP, MC, gender and SES. These results are reported in Table 5 for the JMSA and for the ANA assessments. The percentage (R2 ≥ 1% small; R2 ≥ 10% medium; R2 ≥ 25% large) contribution of each independent variable on a learning area is indicated by the R2 change and the joint contribution of all the relevant independent variables is indicated by the adjusted R2 (see Table 5).
Table 5 shows SES as having the strongest statistically significant predictive value (p ≤ 0.001) for most of the JMSA learning areas (dependent variables). Only Setswana (JMSA and ANA) and the ANA's Afrikaans results revealed no significant relationship with SES. In mathematics and natural science achievements, VMI emerged as the second strongest predictor (p ≤ 0.001; p = 0.05) and to a lesser extent Life Orientation (LO) (p = 0.01). The learning areas of the June school assessment where the joint predictor of the independent variables (adjusted R2) was found to be above 25% were in English (26.7%) and natural sciences (27.7%) as well as in the grade point average (30%). The largest contribution to this variation was consistently SES (22.1% - 26.4%). In the ANA learning areas, the joint prediction of the independent variables was significant in mathematics (27.8%) and English achievements (25%) of which 24.5% of the achievement in mathematics and 18.50% of the achievement in English could once again be explained by SES.
Discussion
The aim of this study was to examine possible relationships between academic achievement in the different compulsory school learning areas and VMI, VP and MC skills. In addition, the contribution of gender and SES to this association among 9-10-year-old learners in the North West province of South Africa was also investigated.
This study confirmed relationships between VMI, VP and MC and the different compulsory school learning areas. Most of the relationships found were with VP and showed moderate practical significance. The highest relationship that was found in the JMSAs was with the grade point average (r = 0.47), while in the ANA it was with mathematics (r = 0.40). However, MC indicated the second highest relationship with most of the compulsory school learning areas. Motor coordination correlated the highest with Afrikaans in the ANA (r = 0.32). These results therefore confirmed that visual-motor and MC skills (fine motor skills) are associated with academic achievement in the different school learning areas. Our results are supported by Pienaar et al. (2013) and De Waal et al. (2018) that also reported meaningful relationships between VP and most of the learning areas in 6- and 12-year-old children. Regarding the relationship that was also established between MC (fine motor skills) and academic achievements, our results are also in agreement with those of Grissmer et al. (2010) and Pagani et al. (2010). These researchers indicated that fine motor skills (which include MC) showed a significant relationship with mathematics, reading skills and later academic achievements.
The joint contribution of the independent variables (VMI, VP, MC, gender and SES) in the regression analysis of each learning area (adjusted R2) was the largest in the learners' JMSA grade point average (30%). Here, 26.4% of the contribution was made by SES and 2% by MC. The smallest joint contribution of the variables to this regression was found in Setswana (1.5%) and only VP made a contribution to this regression. Learning areas where the joint prediction of the independent variables (adjusted R2) was also found to be significant were in the June school mid-year school assessment in English (26.7%) and natural sciences (27.7%) as well as marks obtained in the ANA during mathematics (27.8%) and English (25%). The independent variable that consistently made the biggest contribution to the academic achievement in the different learning areas was the SES of the learners. In the June mid-year school and ANA assessments, the contributions of SES to the different learning areas were as follows: English (22.10%), LO (20.80%), mathematics (8.5%), natural sciences (26.40%), social sciences (12.30%) and grade point average (26.40%), while it was 18.50% for English and 24.50% for mathematics in the ANA. The total contribution of VMI, VP and MC to the different compulsory school learning areas variables ranged between 0.2% and 3.3%, 0.5% and 4.2%, and 0.2% and 9.3%, respectively. In the present study, a large variation in the regression analysis is observed in the percentage contribution that SES had on the JMSA mathematics achievement (8.5%) in comparison to the ANA mathematics achievement (24.50%). The significant 16% variance can possibly be ascribed to the JMSAs being performed by the teachers at the schools, on the basis of work selected by the teachers and taught by them. The ANA, on the contrary, is a standardised national assessment where the teachers have no direct prior access to the content of the article, and is therefore a more objective measurement (Department of Basic Education 2011a).
Our results are confirmed by Caro et al. (2009) who also investigated the influence of SES on academic achievement with the aim to determine to which extent large performance gaps in academic achievement can be attributed to SES as it changes from a young age of 7 up to adolescence (15 years old). These researchers used four data sets from Canada's National Longitudinal Study of Children and Youth (NLSCY). The results indicate that the SES gap remains fairly stable from 7 to 11 years of age, after which the gap increases at a greater tempo from 11 to 15 years of age. The different regression techniques consistently indicate in the study of Caro et al. (2009) that SES, at the age of 12 years, explains about 17% of the variance in mathematics performance. Furthermore, Grissmer et al. (2010) also indicated that children growing up in disadvantaged communities have fewer opportunities to develop the necessary skills that will be accounted for in the school environment and that the gap will remain later in the child's schooling years (Grissmer & Eseman 2008).
Our results are also in agreement with the findings of Lotz et al. (2005) who found that low SES does not only have an undesirable impact on VMI, VP and MC skills of children, but also negatively impacted school learning areas such as language and mathematics. This study by Lotz et al. (2005) was completed on 171 boys and 168 girls (95 in Grade 1, 76 in Grade 2, 70 in Grade 3 and 98 in Grade 4 from various socio-economic backgrounds in the Western Cape province of South Africa with the VMI-4. Fleisch (2008) and Bush et al. (2010) also confirm the relationship between SES and achievements in languages and mathematics achievement in South African learners. Gorard and See (2009) determined trends between science achievement and SES by doing a re-analysis of data from the Pupil-level Annual Schools Census (PLASC) and National Pupil Database (NPD) in England for 2001/2002 to 2005/2006. Each age group (5-7 and 7-11 years of age) consisted of about 650 000 learners. Clear percentage differences were confirmed between high and low SES learners' English (14%), mathematics (14%) and science (17%) achievements. These achievement gaps between the low and high SES learners were also consistent over time (2002-2006) among both the 7- and 11-year-old learners. In summary, Gorard and See (2009) established a clear negative relationship between SES and achievements in English, mathematics and science, with similar achievement gaps (±15%) between the SES groups across the learning areas. Grissmer and Eiseman (2008) also indicated that there were substantial achievement gaps between learners representing different socio-economic backgrounds, when they entered the pre-primary school. This gap was also not closed in the later schooling years, despite programmes being in place to improve the mathematics and reading skills of these learners. The independent variables investigated in our study explained as much as 30% of the variation in academic achievement of which the relationship with SES made a contribution of 26.4% (average of JMSA). Possible additional factors which can, especially in South Africa, add to the poorer academic achievement that was found in the low SES participants would be excessive learner numbers in a class (up to 50), poorly trained teachers or teachers who are not qualified in the learning area that they are teaching. Caro et al. (2009) report in this regard that poorly trained teachers can contribute to a weak foundation being established in the early grades on which learners must fall back. Furthermore, the possibility exists that the learners that enter Grade 1 are not ready for the school setting because they did not attend any pre-primary school, thus the early school development is lacking.
The findings of the study of Maples (2003) are, however, in contrast with the above. These researchers found that VMI was the most accurate predictor of academic success of learners from Grades 1, 2 or 3 over three successive years, and that SES was a less meaningful predictor. Maples (2003) did a 3-year longitudinal study to evaluate the visual and academic achievement of 540 learners from three primary schools in Tahlequah (Oklahoma, United States), which included basic skills such as mathematical concepts, language, listening, reading, word analysis and vocabulary. Participants were, among others, assessed by making use of the VMI-4 as well as the World Sentence Copy Test for VMI and Motor Free Visual Perception Test (MVPT) additionally to VP, while SES was determined by using a questionnaire which the parents had to complete. Maples (2003) further reported that VMI made a contribution to the grade point average of the learners (21.4%), mathematics (11.2%), languages (7.3%) and natural science (14.5%), while no contribution to social sciences was found. The findings of the present study are therefore in contrast to the findings of Maples (2003) because VMI in the present study was not indicated in any of the learning areas as the variable that had made the biggest contribution to the regression. It was only in the JMSA Mathematics learning area (3.3%) that a small significant contribution was made by VMI to the regression. However, during the regression analysis in the present study, no significant contributions were found between VMI and any of the languages or the grade point averages. It did emerge from the regression that VMI made a contribution with the ANA mathematics as well as JMSA in natural science achievement of learners which is in agreement with the findings of Maples (2003), although the contribution is smaller.
Maples (2003) furthermore reports no contribution of VP and only a small significant contribution of SES to the learners' grade point averages (1.9%), while the contribution of VP was not visible in any of the other learning areas. These differences in findings could firstly possibly be explained by the differences in tests that were used in the two studies. In the Maples study, a VP test was used, where the MVPT only requires that the learner should point to the correct or relevant block, while the World Sentence Copy Test was used to test VMI. In addition, different methods were used to determine SES, where the present study used the school SES as a proxy for SES status, while Maples (2003) made use of the proxy household income that was provided by parents by means of a questionnaire. The differences found in the contribution of SES can also possibly be explained by the differences in the number of low SES learners in South Africa compared to in the United States of America, while the circumstances of children growing up in a low-income country might also differ from those growing up in developed countries such as the United States of America. South Africa is classified as a middle-income country, although a significant number of the population live in poverty, with about 60% of the learners who grow up in households with income levels under a minimum acceptable level (Fleisch 2008).
Second to SES, VMI and VP skills had the strongest statistically significant predictive value in mathematics achievement in the JMSA as well as in the ANA. Mayes et al. (2009) assessed 214 primary school learners (47% boys and 53% girls) between the ages of 6 and 12 years old with a mean age of 8.6 years, SD = 1.5 with the VMI-4, and found significant correlations with mathematics achievement among all ages. Pienaar et al. (2013) reported similar results among Grade 1 learners. These researchers reported a higher correlation between VP and letter and numeracy skills compared to MC. Although the present study showed a contribution from VP and MC on letter and numeracy skills, a moderately significant contribution (r ≥ 0.3) was found in most learning areas and small significant contributions in only four learning areas, JMSA Setswana and ANA Afrikaans, English and Setswana. Furthermore, regarding the results that were obtained from the regression analysis, it seemed that VP made the largest contribution to the Setswana achievement (4.3%) in the JMSA and in the ANA (2.7%). However, Setswana did not show any contribution to the percentage variation in the regression, and the correlation that was found with VP was small. There is, however, also a small contribution by VP in ANA English (4.1%), and although the contribution was not significant (≤1%), VP does make contributions to mathematics (JMSA and ANA), LO, natural sciences, social sciences and the grade point averages of the participants in the regression analysis. Various researchers (De Waal et al. 2018; Geary 2004; Kulp et al. 2004; Pienaar et al. 2013; Pieters et al. 2012; Watson et al. 2003) have reported that VP is especially important in the development of mathematical skills. Pereira et al. (2011) evaluated 77 learners (40 girls and 37 boys) with a mean age of 7.4 years in São Paulo, Brazil, with the VMI-4 and compared their VMI, VP and MC skills with their writing, reading and mathematical skills. Significant links were established between VMI and these academic abilities, while a significant correlation between VP and the reading sub-test, as well as MC and cursive writing, was also reported (Pereira et al. 2011).
Motor coordination was the variable that made the largest contribution to the regression in achievement in Afrikaans in both the JMSA and ANA results, although the contributions of 6.2% and 9.3% were small. Motor coordination further only shows small relationships with the JMSA social sciences (1.6%) and only in mathematics achievement during the ANA (2.6%), where in both cases it is indicated as the second contributing variable to the regression. The effect of MC on the learning areas can possibly be explained by the use of fine motor skills that include handwriting and hand-eye coordination in all learning areas (Capellini et al. 2010; Feder & Majnemer 2007; Grissmer et al. 2010; Pagani et al. 2010), as it is foundational skills in all learning areas. According to Grissmer et al. (2010), fine motor skills play an important role in the development of language because of the different areas involved in this subject, for example, to be able to read the eye movements need to be controlled so that the tracking of the word is smooth, which is also a fine motor skill. Poor or unclear handwriting often results in that the child cannot read or understand their own written symbols, which can contribute to mistakes in interpretations (Bezrukikh & Kreshchenko 2004). Furthermore, the results indicated that MC skills are minimally associated with children's achievement in any of the other learning areas. There is some measure of disagreement, as Pienaar et al. (2013) reported that mathematics achievement was not significantly linked to the MC skills, but with VMI and VP skills. Our results are in agreement with that of Pienaar et al. (2013) as the relationships that occurred between academic achievements were stronger for VMI and VP skills, and to a lesser extent with MC, which mostly assessed hand control in the VMI. The study of Pienaar et al. (2013) that was completed on 812 Grade 1 learners (418 boys and 394 girls) with a mean age of 6.78 years in the North West province of South Africa further also found that the relationship between academic achievement and VMI skills was stronger among low SES learners. Roth et al. (1993) completed a longitudinal study on 161 children (95 boys and 41 girls) living in Maine in the United Sates, where the baseline measurements were taken during the nursery school years and the final measurements during their Grade 3 year. By making use of a regression analysis, these researchers observed that children, who experienced academic difficulties and therefore would need special education, also experienced problems with their fine motor skills. Following on that, socio-demographic factors were the second strongest predictor for possible difficulties in fine motor skills (Roth et al. 1993). In contrast to the above studies, Grissmer et al. (2010) and Pagani et al. (2010) found that fine motor skills, motor skills and behaviour played important roles in later academic achievements.
Gender made the second largest contribution to the regression in the JMSA for Afrikaans (1.9%), English (2.5%), Setswana (2.7%), LO (1.6%) and the grade point average (1.1%), as well as in the ANA Afrikaans (3.9%) and English (1.9%). The percentage contribution of gender to the regression was, however, small in all cases. The boys' academic achievements were also consistently lower than girls. The contribution of gender to mathematics achievement was low (0.2%) in both regression analyses. These results are in agreement with those of Deary et al. (2007) who also reported that girls significantly outperformed boys in all learning areas except for physics (p ≤ 0.001). These researchers conducted a 5-year longitudinal study in the United Kingdom on 74 403 English learners (36 894 boys and 37 509 girls) to examine differences between psychometric intelligence at the age of 11 and academic achievement at the age of 16, as well as the role of gender in such differences. This study involved 25 academic learning areas that were part of the General Certificate of Secondary Education. The contribution of gender to the different learning areas was as follows: art and humanities (3.4% - 7.4%), mathematics and science (≤ 0.1%), social sciences (1% - 2%), design and technological graphics (5.7%) and 8.0% in art and design. These results show that gender made the biggest contribution to achievement in languages, while no correlations could be established with science, which is also well aligned with the findings of our study.
Visual-motor integration, VP and MC are all skills that improve over time with practice and repetition (Coetzee et al. 2019). The improvement of these skills can possibly play a significant role in the solution of the complex problem of academic under-achievement. It is clear that the academic under-achievement problem has multiple implications that can be decisive for successful academic outcomes, but also that improvement of VMI, VP and MC skills can contribute to the improvement of the general outcome. Although SES and gender are variables of which the status cannot be changed, efforts can be made to minimise the potential negative effect of these variables. The results of the present study can also help to identify possible focus learning areas that are affected to different degrees by learners' gender and SES. Thus, teachers can use the guideline for additional approaches to the various identified learning areas with due consideration to the identified potential at-risk learners. Problems associated with low SES schools that have to be addressed include the large numbers of learners per classroom, as well as the quality of the teaching offered. Schools can ensure on an ongoing basis that all teachers are up to standard by offering additional training sessions in the different learning areas at the schools. Furthermore, the schools and the teachers can also offer targeted high-risk learners additional compulsory learning opportunities in the different identified learning areas (during and after school). Unfortunately, the topics of SES and gender (including race) are more sensitive areas in any milieu and in any country, where terms such as discrimination and exceptions can easily lead to an (unintended) uproar.
The findings of this study have shortcomings that must be highlighted to enable one to evaluate the generalisability of the results. Causality could not be established in our study because of the cross-sectional nature of the study design that was followed which is a limitation that should be acknowledged. Longitudinal analysis of the established relationships is therefore strongly recommended. We also did not have access in our study to information regarding the intelligence quotient (IQ) of the learners, while it emerges from the study of Deary et al. (2007) that 50% - 60% of the variance in examination marks can be statistically explained by the underlying intelligence characteristics that contribute to academic achievement. It is therefore recommended that future studies will consider the use of information about inherent intelligence characteristics in regression analyses. The strong point of this study, however, is that the results are based on a random sample and a large group of subjects who represented different levels of SES, although only based on school types.
Conclusion
In summary, it can be concluded that SES had the greatest predictive academic achievement influences for most of the school learning areas in 9-10-year-old South African school learners. Socio-economic status was also the only variable that made contributions with substantial statistical and practical significance while also showing the largest contributions to the application learning areas such as mathematics and natural science, followed by MC and VP skills. The independent variables investigated in this study were able to affirm up to 30% of the variation in academic achievement of 9-10-year-old learners in all the learning areas. Although of smaller magnitude or non-significant in all cases, contributions were made by VMI, VP, MC and gender, to the academic achievements in various learning areas in both the June mid-year school and ANA examinations. It also seems that the contribution of VMI, VP and MC to academic achievement decreases with an increase in age, although the contribution of SES remains.
There are many inconsistencies in the literature regarding the relationships between academic achievement and VMI and SES. A possible explanation could be that till date most studies have examined the relationship of only the VMI status on the child's academic achievement as a whole and not with the different individual learning areas, thus making it a very wide comparison. The skills required to master specific learning areas will vary from one learning area to the other, and thus require that each compulsory school learning area is individually compared to the independent variables, which includes VMI, VP and MC, that might have an effect on a learner's ability to perform to the best of his or her potential. From the results of the current study, it emerged that some of these variables should definitely receive attention to minimise the possible negative influences of these variables on a child's academic achievement in the different individual learning areas and on his or her academic achievement as a whole. More research, and especially longitudinal analysis, is therefore recommended in accordance with the specifications of the current study.
Acknowledgements
The authors express their sincere gratitude to the Department of Education of the North West province, the principals of the schools and the children for the permission granted to enable the researchers to complete this study. For all financial support received to make this research possible, they thank the Medical Research Council of South Africa, the South African Sugar Association and the National Research Foundation of South Africa.
Competing interests
The authors declare that they have no financial or relationships that may have inappropriately influenced them in writing this article.
Authors' contributions
Both D.C. and A.E.P. contributed to the conceptualisation of this study. D.C. and Y.V.W. did all the data collection, while all the authors were involved in the statistical analyses. All three authors wrote the article together.
Ethical consideration
Ethical approval for the project was obtained from the Ethics Committee of the North-West University, Potchefstroom Campus (No. NW-00070-09-A1), as well as permission from the North West Province Department of Basic Education to gather data during school hours for which permission had also been obtained from school principals of the schools that was identified to part take in this study. The parents or legal guardians of learners who participated in the study were requested to complete the informed consent forms, while learners gave ascent on the test day. An effort was made to re-evaluate the same learners who had been evaluated in Grade 1 again during the two follow-up measurements. In the case where learners who had been part of the study in 2010 had moved out of the area, or whose parents did not consent for their further participation, new learners per school were recruited to supplement the number of the target population. The data were collected by senior researchers and postgraduate students having a qualification in Human Movement Science, specialising in Kinderkinetics.
Funding information
Funding for this work was received from the Medical Research Council of South Africa, the South African Sugar Association and the National Research Foundation of South Africa.
Data availability statement
Data sharing is not applicable to this article as no new data were created or analysed in this study.
Disclaimer
Any opinions, findings, conclusions or recommendations emanating from this material are those of the author(s) and therefore the MRC, SASA and the NRF do not accept any responsibility or liability.
References
Anderson, K.G., Case, A. & Lam, D., 2001, 'Causes and consequences of schooling outcomes in South-Africa: Evidence from survey data', Social Dynamics 27(1), 37-59. https://doi.org/10.1080/02533950108458703 [ Links ]
Beckman, J., 2011, 'Onderwys in Suid-Afrika van 1961 tot 2011: Tussen twee paradigmas en ontwykende ideale', Tydskrif vir Geesteswetenskappe 51(4), 507-532. [ Links ]
Beery, K.E. & Beery, N.A., 2010, The Beery-Buktenica developmental test of visual-motor integration, 6th edn., Pearson, TX, Texas.
Beery, K.E. & Buktenica, N.A., 1997, The Beery-Buktenica developmental test of visual-motor integration: Administration, scoring and teaching manual, 4th edn., Modern Curriculum Press, Parsippany, NJ.
Bezrukikh, M.M. & Kreshchenko, O.Y., 2004, 'Psychophysiological correlates of writing and reading difficulties in children of elementary school age', Human Physiology 30(5), 521-525. https://doi.org/10.1023/B:HUMP.0000042606.60550.ed [ Links ]
Bezrukikh, M.M. & Terebova, N.N., 2009, 'Characteristics of the development of visual perception in five- to seven-year-old children', Human Physiology 35(6), 684-689. https://doi.org/10.1134/S0362119709060048 [ Links ]
Borsting, E.J. & Barnhardt, C.N., 2001, 'The relationship between visual-motor integration and spatial organization of written language and math', M.S. dissertation, United States - California: California State University, Fullerton. ProQuest Digital Dissertations database. (Publication No. AAT 1404014). [ Links ]
Bronfenbrenner, U., 1979, The ecology of human development: Experiments by nature and design, Harvard University Press, Boston, MA.
Bush, T., Joubert, R., Kiggundu, E. & Van Rooyen, J., 2010, 'Managing teaching and learning in South African schools', International Journal of Educational Development 30, 162-168. https://doi.org/10.1016/j.ijedudev.2009.04.008 [ Links ]
Capellini, S.A., Coppede, A.C. & Vale, T.R., 2010, 'Fine motor function of school-aged children with dyslexia, learning disability and learning difficulties (original title: Função motora fina de escolares com dislexia, distúrbio e dificuldades de aprendizagem)', Pró-fono Revista de Atualização Científica 22(3), 201-208. https://doi.org/10.1590/S0104-56872010000300008 [ Links ]
Caro, D.H., McDonald, J.T. & Williams, J.D., 2009, 'Socio-economic status and academic achievement trajectories from childhood to adolescence', Canadian Journal of Education 32(3), 558-590. [ Links ]
Case-Smith, J., 2005, Occupational therapy for children, 5th edn., Elsevier Mosby, St Louis, MO.
Coetzee, D., Pienaar, A.E. & Van Wyk, Y., 2019, 'Longitudinal influences of socio-economic status on visual-motor integration: The North-West Child Health, Integrated with Learning and Development study', South African Journal of Childhood Education 9(1), a645. https://doi.org/10.4102/sajce.v9i1.645 [ Links ]
Cohen, J., 1988, Statistical power analysis for the behavioural sciences, 2nd edn., Lawrence Erlbaum, Hillsdale, NJ.
Deary, I.J., Strand, S., Smith, P. & Fernandes, C., 2007, 'Intelligence and educational achievement', Intelligence 35, 13-21. https://doi.org/10.1016/j.intell.2006.02.001 [ Links ]
Delemarre-Van de Waal, H.A., 1993, 'Environmental factors influencing growth and pubertal development', Environmental Health Perspectives, Supplement 101(2), 39-44. https://doi.org/10.1289/ehp.93101s239 [ Links ]
De Waal, E., Pienaar, A.E. & Coetzee, D., 2018, 'Perceptual-motor contributors to the association between developmental coordination disorder and academic performance: North-West child health, integrated with learning and developmental study', South African Journal of Childhood Education 8(2), a562. https://doi.org/10.4102/sage.v8i2.562 [ Links ]
Du Plessis, W., Coetzee, D. & Pienaar, A.E., 2015, 'Interrelationships between visual-motor integration, visual perception, motor coordination and object control skills of grade 1-learners: NW-CHILD study', South African Journal for Research in Sport, Physical Education and Recreation 37(3), 69-81. [ Links ]
Feder, K.P. & Majnemer, A., 2007, 'Handwriting development, competency, and intervention', Developmental Medicine & Child Neurology 49, 312-317. https://doi.org/10.1111/j.1469-8749.2007.00312.x [ Links ]
Fleisch, B., 2008, Primary education in crisis: Why South African schoolchildren underachieve in reading and mathematics, Juta, Cape Town.
Gabbard, C.P., 2008, Lifelong motor development, 5th edn., Pearson Education, San Francisco, CA.
Gallahue, D.L. & Ozmun, J.C., 2006, Understanding motor development, 6th edn., McGraw-Hill, New York, NY.
Geary, D.C., 2004, 'Mathematics and learning disabilities', Journal of Learning Disabilities 37(1), 4-15. https://doi.org/10.1177/00222194040370010201 [ Links ]
Gonzales, P., Guzmán, J.C., Partelow, L., Pahlke, E., Jocelyn, L., Kastberg, D. et al., 2004, 'Highlights from the trends in International Mathematics and Science Study (TIMSS) 2003 (NCES 2005-005)', U.S. Department of Education, National Center for Education Statistics. Washington, DC7 U.S. Government Printing Office. [ Links ]
Gorard, S. & See, B.H., 2009, 'The impact of socio-economic status on participation and attainment in science', Studies in Science Education 45(1), 93-129. https://doi.org/10.1080/03057260802681821 [ Links ]
Grissmer, D.W. & Eiseman, E., 2008, 'Can gaps in the quality of early environment and non-cognitive skills help explain persisting Black-White achievements gaps?', in K. Magnuson & J. Waldfogel (eds.), Steady gains and stalled progress: Inequality and the Black-White test score gap, pp. 139-180, SAGE, New York, NY.
Grissmer, D.W., Grimm, K.J., Aiyer, S.M., Murrah, W.M. & Steele, J.S., 2010, 'Fine motor skills and early comprehension of the world: Two new school readiness indicators', Developmental Psychology 46, 1008-1017. https://doi.org/10.1037/a0020104 [ Links ]
Hall, K.H. & Giese, S., 2009, 'Addressing quality through school fees and school funding', in S. Pendlebury, L. Lake & C. Smith (ed.), South African child gauge, 2008/2009, pp. 35-40, University of Cape Town. Children's Institute, Cape Town.
Haywood, K.M. & Getchell, N.G., 2009, Life span motor development, 5th edn., University of Missouri, Human Kinetics, St. Louis, MI.
Kaiser, M., Albert, J. & Doudin, P., 2009, 'Relationship between visual-motor integration, eye hand coordination, and quality of handwriting', Journal of Occupational Therapy, Schools & Early Intervention 2, 87-95. https://doi.org/10.1080/19411240903146228 [ Links ]
Kulp, M.T., Earley, M.J., Mitchell, G.L., Timmerman, L.M., Frasco, C.S. & Geiger, M.E., 2004, 'Are visual perceptual skills related to mathematics ability in second through sixth grade children?', Focus on Learning Problems in Mathematics 26(4), 44-51. [ Links ]
Lachance, J.A. & Mazzocco, M.M.M., 2006, 'A longitudinal analysis of sex differences in math and spatial skills in primary school age children', Learning and Individual Differences 16, 195-216. https://doi.org/10.1016/j.lindif.2005.12.001 [ Links ]
Lane, K.A., 2005, Developing ocular motor and visual perceptual skills: An activity workbook, Slack incorporated, Slack, Thorofare, NJ.
Lopes, L., Santos, R., Pereira, B. & Lopes, V.P., 2013, 'Associations between gross motor coordination and academic achievement in elementary school children', Human Movement Science 32, 9-20. https://doi.org/10.1016/j.humov.2012.05.005 [ Links ]
Lotz, L., Loxton, H. & Naidoo, A.V., 2005, 'Visual-motor integration functioning in a South African middle childhood sample', Journal of Child & Adolescent Mental Health 17(2), 63-67. https://doi.org/10.2989/17280580509486602 [ Links ]
Maples, W.C., 2003, 'Visual factors that significantly impact academic performance', Optometry 74(1), 35-49. [ Links ]
Mayes, S.D., Calhoun, S.L., Bixler, E.O. & Zimmerman, D.N., 2009, 'IQ and neuropsychological predictors of academic achievement', Learning and Individual Differences 19, 238-241. https://doi.org/10.1016/j.lindif.2008.09.001 [ Links ]
Pagani, L.S., Fitzpaterick, C., Archambault, I. & Janosz, M., 2010, 'School readiness and later achievement: A French Canadian replication and extension', Developmental Psychology 46(5), 984-994. https://doi.org/10.1037/a0018881 [ Links ]
Payne, V.G. & Isaacs, L.D., 2008, Human motor development. A lifespan approach, 7th edn., McGraw-Hill Company, New York, NY.
Penner, A.M., 2003, 'International gender X item difficulty interactions in mathematics and science achievement tests', Journal of Educational Psychology 95(3), 650-655. https://doi.org/10.1037/0022-0663.95.3.650 [ Links ]
Pereira, D.M., De Cássia Tibério Araújo, R. & Braccialli, L.M.P., 2011, 'Relationship analysis between visual-motor integration ability and academic performance', Journal of Human Growth and Development 21(3), 808-817. https://doi.org/10.7322/jhgd.20033 [ Links ]
Pienaar, A.E., Barhorst, R. & Twisk, J.W.R., 2013, 'Relationships between academic performance, SES school type and perceptual-motor skills in first grade South African learners: NW-CHILD study', Child: Care, Health and Development 40(3), 370-378. https://doi.org/10.1111/cch.12059 [ Links ]
Pieters, S., Desoete, A., Roeyers, H., Vanderswalmen, R. & Van Waelvelde, H., 2012, 'Behind mathematical learning disabilities: What about visual perception and motor skills?', Learning and Individual Differences 22, 498-504. https://doi.org/10.1016/j.lindif.2012.03.014 [ Links ]
Portela, N., 2007, 'An assessment of the motor ability of learners in the foundation phase of primary education', MSc dissertation, University of Zululand. [ Links ]
Roth, M., McCaul, E. & Barnes, K., 1993, 'Who becomes an ''at-risk'' student? The predictive value of a kindergarten screening battery', Exceptional Children 59, 348-358. https://doi.org/10.1177/001440299305900407 [ Links ]
Son, S.H. & Meisels, S.J., 2006, 'The relationship of young children's motor skills to later reading and math achievement', Merrill-Palmer Quarterly 52(4), 755-778. https://doi.org/10.1353/mpq.2006.0033 [ Links ]
South Africa, Department of Basic Education, 2011a, 'Nasionale Kurrikulumverklaring', viewed 30 September 2015, from http://www.education.gov.za/Curriculum/CurriculumAssessmentPolicyStatements(CAPS).aspx.
South Africa, Department of Basic Education, 2011b, 'Annual national assessment', viewed 30 September 2015, from http://www.education.gov.za/Curriculum/AnnualNationalAssessments(ANA).aspx.
South Africa, Department of Basic Education, 2014, 'Curriculum Assessment Policy Statements (CAPS)', viewed 30 September 2015, from http://www.education.gov.za/Curriculum/NCSGradesR12/CAPS/tabid/420/Default.aspx.
Stats SA (Statistics South-Africa), 2013a, 'Mid-year population estimates 2013', viewed 30 September 2015, from http://www.statssa.gov.za/publications/P0302/P03022013.pdf.
Stats SA (Statistics South-Africa), 2013b, Report on the 2013 National Senior Certificate School performance report, viewed 30 September 2015, from http://www.gov.za/sites/www.gov.za/files/NSC%202013%20School%20Performa nce%20Report.7Jan2013pdf.pdf.
Stats SA (Statistics South-Africa), 2014, 'Poverty trends in South Africa: An examination of absolute poverty between 2006 and 2011', viewed 30 September 2015, from http://www.statssa.gov.za/publications/Report-03-10-06/Report-03-10-06March2014.pdf.
Statsoft, 2015, Statistica for windows: General conventions & statistics, Statsoft, Tulsa, OK.
Taylor, S. & Yu, D., 2009, The importance of socio-economic status in determining educational achievement in South Africa, Stellenbosch University, Bureau of Economic Research, Stellenbosch. (Stellenbosch Economic Working Papers: 01/09, 1-77.)
Van Niekerk, C., 2012, 'Die stand van neuro-motor ontwikkeling en visual-motor integration by 7- en 8-jarige learners met leerverwante probleme', MA dissertation, North-West University, Potchefstroom. [ Links ]
Voyer, D., Voyer, S. & Bryden, M.P., 1995, 'Magnitude of sex differences in spatial abilities: A meta-analysis and consideration of critical variables', Psychological Bulletin 117(2), 250-270. https://doi.org/10.1037/0033-2909.117.2.250 [ Links ]
Walker, S.P., Wachs, T.D., Meeks Gardner, D., Lozoff, B., Wasserman, G.A., Pollitt, E. et al., 2007, 'Child development: Risk factors for adverse outcomes in developing countries', Lancet 369(9556), 145-157. https://doi.org/10.1016/S0140-6736(07)60076-2 [ Links ]
Watson, C.S., Kidd, G.R., Horner, D.G., Connell, P.J., Lowther, A., Eddins, D.A. et al., 2003, 'Sensory, cognitive and linguistic factors in early academic performance of elementary school children: The Benton-IU project', Journal of Learning Disabilities 36(2), 165-197. https://doi.org/10.1177/002221940303600209 [ Links ]
Weintraub, N. & Graham, S., 2000, 'The contribution of gender. Orthographic, finger function, and visual-motor processes to the prediction of handwriting status', Occupational Therapy Journal of Research 20, 121-140. https://doi.org/10.1177/153944920002000203 [ Links ]
Wilson, T.A. & Falkel, J., 2004, Sportsvision, training for better performance, Human Kinetics, Champaign, IL.
Winnick, J.P., 2005, Adapted physical education and sport, 4th edn., Human Kinetics, Champaign, IL.
 Correspondence:
Dané Coetzee
dane.coetzee@nwu.ac.za
Received: 30 Mar. 2018
Accepted: 14 May 2020
Published: 26 Aug. 2020

