


Servicios Personalizados
Articulo
 Inglés (pdf)
 Articulo en XML
 Referencias del artículo
Indicadores

Links relacionados
-
 Citado por Google
 -
 Similares en Google
Compartir

 Permalink
South African Journal of Childhood Education
versión On-line ISSN 2223-7682
versión impresa ISSN 2223-7674
SAJCE vol.9 no.1 Johannesburg 2019
http://dx.doi.org/10.4102/sajce.v9i1.712
ORIGINAL RESEARCH
Moving beyond league table standings: How measures of opportunity to learn can inform educational quality and policy directives?
Surette van Staden; Celeste Combrinck; Karen Roux; Mishack Tshele; Nelladee M. Palane
Department of Science, Mathematics and Technology Education, University of Pretoria, Pretoria, South Africa
ABSTRACT
BACKGROUND: South Africa's participation across a number of international large-scale assessment programmes provides continued evidence of poor student achievement across grades and phases. Despite discouraging achievement results, evidence of slow progress begins to emerge, yet systemic inequalities persist
AIM: This article aims to unpack the possible value of large-scale assessment data in measuring equal educational opportunity as conceptualised by the opportunity to learn (OTL
SETTING: While overall scores on international large-scale assessment in countries like South Africa are often driven by aptitude, student motivation and social class, OTL, as described in this article, should provide a more accurate reflection of the nature of performance and the kinds of opportunities afforded to students across an unequal sector to learn
METHODS: A multiple linear regression was conducted using the South African PIRLS 2016 teacher and student questionnaire data and the PIRLS Literacy Grade 4 overall reading literacy performance score as the dependent variable
RESULTS: While socio economic status makes a substantial contribution in the current model, the only predictor that was significant is the scale based on student reports on lessons about reading
CONCLUSION: Through the use of multiple regression analysis, this article concludes that a more effective use of large-scale assessment data from an OTL perspective, specifically in developing contexts, is still problematic using teacher and student questionnaire data. Issues of social desirability and overly positive reporting make any claims about the teachers' role in providing opportunities to learn and exposure to the curriculum in the classroom difficult to gauge
Keywords: reading literacy; opportunity to learn; PIRLS Literacy 2016; large-scale assessments; classroom practice.
Introduction
South Africa's participation in three cycles of the Progress in International Reading Literacy Study (PIRLS) since 2006 has pointed to disappointingly low reading comprehension performance (see Howie et al. 2009, 2012, 2017).
As an international comparative study in reading literacy, PIRLS is administered in 5-year cycles and requires the assessment of students who have had 4 years of schooling (Mullis et al. 2007). For most countries, this requirement translates to Grade 4 students. PIRLS is run under the auspices of the International Association for the Evaluation of Educational Achievement (IEA). As an organisation, the IEA undertakes international studies that benchmark performance of schoolgoing children in mathematics, science, civic education, information, communication, technology and reading. Progress in International Reading Literacy Study 2011 aims to describe trends and international comparisons for the reading achievement of Grade 4 students. It also focuses on students' competencies in relation to goals and standards for reading education, the impact of the home environment and how parents foster reading literacy, the organisation, time and reading materials for learning to read in schools and curriculum and classroom approaches to reading instruction (Mullis et al. 2004).
While the most recent results of PIRLS 2016 show slow and steady systemic improvement, the fact remains that young South African students are not developing the higher order reading literacy skills needed for their further schooling and future participation in the knowledge economies of the 21st century (Ananiadou & Claro 2009). The results from PIRLS 2006, 2011 and pre-PIRLS 2011 in South Africa revealed the extent of students' difficulties with reading literacy development. For PIRLS 2006, the results suggested that students at grades 4 and 5 were struggling to develop reading literacy competencies associated with reading comprehension (Howie et al. 2007), with the average performance of students at both grades being approximately 250 points or more below the international average of 500 points. South Africa again participated in the PIRLS 2011, this time with the majority of the sampled Grade 4 South African students completing a new assessment known as pre-PIRLS 2011. Pre-PIRLS is a shorter, easier test at a lower level of cognitive demand. The South African Grade 4 students still achieved the lowest overall achievement (461 score points) in comparison to Botswana (463 score points) and Colombia (576 score points), the only other participating countries in pre-PIRLS 2011 (Howie et al. 2012). In the PIRLS 2016 cycle, South African students yet again achieved the lowest overall scores in PIRLS Literacy (previously called pre-PIRLS) in comparison to the best-performing Denmark (501 score points), followed by Iran (428 score points). South African Grade 4 students achieved an overall score of 320 (standard error [SE] = 4.4) and as many as 78% of children failed to reach the advanced international benchmark that would indicate the ability to read for meaning. Results like these unfortunately catch media attention, with discouraging newspaper headlines and public opinion regarding the education sector and quality of schooling is at an all-time low.
By doing a secondary analysis of PIRLS Literacy 2016 data, this article argues for participation in international large-scale studies and not against the overall results that provide disappointing outcomes cycle after cycle. Instead, large-scale assessments for developing countries like South Africa could unpack the value in measuring equal educational opportunity as conceptualised by Opportunity to Learn (OTL). While overall scores are often driven by aptitude, student motivation and social class, OTL, as described in this article, has the potential to provide another reflection of the nature of performance and the kinds of opportunities afforded to students to learn across an unequal sector.
Theoretical framework and literature review
In unpacking OTL, the manifestations of the curriculum, as described by the IEA's tripartite curriculum model, are used for purposes of the current analyses. The tripartite curriculum model characterises the nature of PIRLS and is a model that is shared with other international comparative studies similar to PIRLS, such as the Trends in Maths and Science Study (TIMSS). According to Shorrocks-Taylor and Jenkins (2001), the IEA's tripartite model of the curriculum manifests itself in three ways:
-
What society would like to see taught in the education system (the intended curriculum).
-
What is actually taught (the implemented curriculum).
-
What is learnt (the attained curriculum).
Reinikainen (2007) refers to the focus on the curriculum as a broad explanatory factor underlying student achievement. Figure 1 illustrates these manifestations of the curriculum.
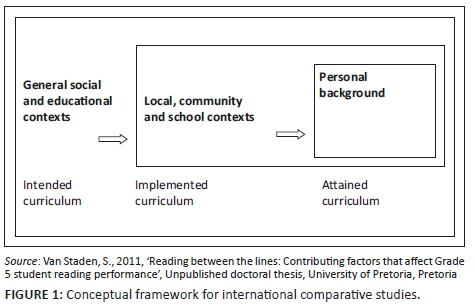
Opportunity to learn was introduced as part of the IEA's First International Mathematics Survey in the 1960s (McDonnell 1995). The Mathematics curriculum was conceptualised as functioning at the three levels of the intended, implemented and attained curriculum. To examine the implemented curriculum, an OTL questionnaire was administered to the teachers of the students who were assessed. The teachers were asked whether the content needed to respond to items on the achievement tests had been taught to their students. In instances where the content had not been taught, reasons for this were explored (McDonnell 1995).
The conceptual framework provided by the IEA in terms of curricular focus and the differences between what was intended, what was implemented and what was attained should be regarded as the guiding force behind participation, subsequent results and their interpretation. The implemented curriculum is unpacked in this article from an OTL perspective. In doing so, the role of international large-scale assessments in developing contexts may move beyond its use only as an exercise to determine the country's standing on a long list of countries. Instead, OTL could provide a more accurate reflection of the nature of performance and the kinds of opportunities afforded to students across an unequal sector of learning.
Curricular expectations of South African Grade 4 students
With an incremental implementation that started in February 2012, the National Curriculum Statement (NCS) in South Africa was amended to include the Curriculum and Assessment Policy Statement (CAPS). Curriculum and Assessment Policy Statement is a single comprehensive and concise policy document that guides what is taught and how it should be taught as part of the NCS grades R-12. For primary schools, the curriculum is spread over three phases: Foundation Phase (grades 1-3), Intermediate Phase (grades 4-6) and Senior Phase (grades 7-9). According to Du Plessis (2013), subject and time allocations across the Intermediate Phase, where Grade 4 students find themselves in their primary education careers, are as follows (see Table 1).
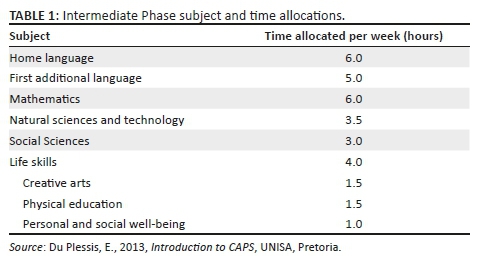
Table 1 shows that curriculum prescriptions require teachers to spend 6 h per week on Home Language (HL) teaching and 5 h weekly on First Additional Language (FAL) teaching (Department of Basic Education [DBE] 2011:13). Curriculum and Assessment Policy Statement is divided into topics and each topic is further divided into a content outline. Some subjects, such as the languages, refer to skills (such as listening and reading) instead of topics, thus placing an emphasis on competencies that must be demonstrated. Table 2 provides an example of the time and skill allocations for Grade 4 students for English First Additional Language - a curriculum followed by the majority of South African students who progress from Foundation Phase to Intermediate Phase.
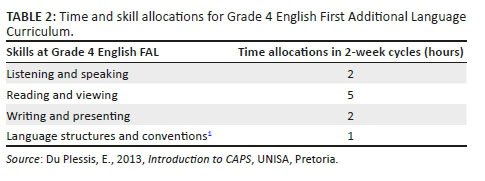
Length of reading texts for FAL students to engage in includes (DBE 2011) the following:
-
longer listening comprehension texts (e.g. story, interviews, plays and news reports) of 100 - 150 words or up to 5 min
-
shorter listening comprehension texts (e.g. announcements, information texts, instructions and directions) of 40 - 60 words or 1 min - 2 min
-
reading comprehension or intensive reading texts of 100 - 150 words only. (p. 29)
Of importance to note here is that PIRLS Literacy texts at 400 words and PIRLS texts at 800 words provide an indication that curricular expectations for South African Grade 4 children are low, even at FAL, where the expectation is for children to engage in texts of only 100-150 words.
Evidence from studies on opportunity to learn and how the construct is measured
A common explanation for low student achievement in many developing countries' primary schools is that students have relatively little OTL skills needed for academic success (Reeves, Carnoy & Addy 2013:426). Opportunity to learn is a classroom level factor which consistently and most strongly affects reading test scores whether it is measured as the amount of the curriculum covered or the percentage of test items taught (Blömeke & Kaiser 2012; Reynolds 1998). Growing research literature surrounding students' development of comprehension skills in South African primary schools ratifies that these school students would appear to have had little OTL the skills needed for their reading literacy development (Heaton, Amoateng & Dufur 2014; Lewin & Sabates 2012; Pretorius & Klapwijk 2016; Taylor 2014; Zimmerman & Smit 2014), impacting their successful engagement with assessments such as the PIRLS, pre-PIRLS and PIRLS Literacy as referred to in the 2016 cycle.
According to Bold et al. (2017), surveys from seven sub-Saharan African countries in which 40% of the region's total population is represented show consistently that students have limited OTL when measured by the fact that they receive just over half the scheduled time, teachers who do not master the curricula, with low basic pedagogical knowledge and rare use of good teaching practices.
In their work, Van der Berg et al. (2016) take a binding constraints approach to prioritise the role of different constraints that impede equal educational opportunities in South Africa. Of these binding constraints, they highlight the role of wasted learning time and insufficient OTL. These authors cite a number of studies to support their argument, including the National School Effectiveness Survey (NSES). In this regard, it is stated (Van der Berg et al. 2016) that:
A number of South African studies have aimed to measure OTL and have frequently found that less than half of the official curriculum is being covered in the year and fewer than half of the officially scheduled lessons are actually taught. The NSES study of 2007-2009 showed that most grade 5 children write in their books only once per week or less. Only 3% of grade 5 students across South Africa wrote in their books every day. In grade 4 and grade 5 exercise books, about half of all exercises in the year were single word exercises. (p. 9)
Most alarmingly, evidence was found that as much as 44% of Grade 4 students had not written a single paragraph in the entire year, a pattern that remains consistent in the higher grades where one would have expected that more opportunities to write would present themselves to students. While these figures differ substantially by province, with higher percentages of curriculum coverage in Gauteng and the Western Cape provinces as opposed to the Eastern Cape and other rural provinces, the issue of wasted OTL remains in evidence provided by other studies. The School Monitoring Survey of 2011 found that only 53% of students nationally had covered the bare minimum number of exercises required for curriculum coverage. Alarmingly, Pretorius and Stoffelsma (2017) confirm that children who start with weak language skills tend to stay weak with little hope of improvement as they progress to higher grades. As indicated by the School Monitoring Survey, these patterns can only be expected to persist if opportunities to exercise writing (and by implication language) do not abound.
Another national study undertaken by the National Education Evaluation and Development Unit (NEEDU) surveyed 218 rural primary schools from across South Africa and conducted an in-depth study in four schools per province (36 schools in total). While the findings from this study were not nationally representative, the results of the 36-school analysis confirm patterns found in other studies, namely, that not only are the frequency and volume of writing generally far too low, but that these are also highly variable across the sample. Students in some schools write, on average, one or two pages a day over the entire year, while the majority write a page twice a week or less frequently. These differences reflect vastly varying opportunities to learn offered to children in schools that are classified as more or less effective and functional. Van der Berg et al. (2016) mention that the NEEDU study found only 23.7% of the set of writing activities prescribed by CAPS was completed in a subsample of 36 schools studied in detail. In five schools, no extended writing was done at all and in another five schools only one or two pieces of writing were completed. It is also worth noting that the researchers also scrutinised the DBE workbooks. These workbooks were distributed to schools in a national effort to ensure that every child in every school had at least access to a workbook. Van der Berg et al. (2016) report the NEEDU findings that in the full sample of 218 schools, more than 80% of children had completed less than one page per day in their mathematics and language workbooks.
Research questions
Based on the PIRLS Literacy 2016 evidence of South African Grade 4 students' poor overall reading literacy achievement, the following questions are asked for purposes of this secondary analysis investigation:
-
To what extent can OTL, as reported by Grade 4 students, Grade 4 language teachers and principals explain the PIRLS Literacy 2016 results when controlling for Socio Economic Status (SES) and teachers' major area of study?
-
Which OTL variables in the South African PIRLS 2016 data predict reading literacy achievement at Grade 4 level?
-
To what extent do cross-sectional, questionnaire data provide credible measures of OTL in a developing context where teacher classroom practice varies greatly?
Consensus on measuring OTL across studies has not been found yet. Some studies suggest that workbooks present the best examples of curriculum coverage (Carnoy, Chisholm & Chilisa 2012; Hoadley & Galant 2016). Tarr et al. (2006) used textbooks and the role of middle school mathematics teachers as indicator of OTL. Schmidt, Cogan and Houang (2011) used teacher preparation learning programme opportunities for mathematics teachers to measure OTL, and Schmidt et al. (2008) highlighted the role of the teacher and their professional competence and preparation in providing their students with OTL.
Given the problems outlined earlier with regard to the use of teacher self-report data, these problems have to be kept in mind for the current study that aims to explore student and teacher reports on a number of items on curriculum coverage to test their possible effect on reading literacy achievement. These data form part of the student and teacher questionnaires that were administered to Grade 4 students and their language teachers who participated in the PIRLS Literacy 2016 study. In doing so, the role of the teacher in providing OTL to the students is quantified to some extent while controlling for background variables that could explain OTL further. Therefore, background data can 'provide a picture of what is being done and how that coincides with what is thought to work best' (Mullis 2002:4). In large-scale assessments, priority is given for identifying instructional practices that relate to high achievement. However, there may be problems with identifying these instructional practices as strategies deemed to be effective might be reported as being used, but in actuality may not be implemented in ways envisioned to enhance learning. Also, what is considered effective may evolve and change over time, and therefore it may be difficult to report timely data about best practices. Nevertheless, it is seen as important for large-scale studies, such as PIRLS, to collect information about instructional practices to help ascertain the extent to which current research recommendations are being implemented and to capture what teachers are actually doing (Mullis 2002). Such reporting can also provide a springboard for further research.
For both the 2006 and 2011 studies, some insights were gleaned from the descriptive statistics related to teachers' reported teaching practices for reading literacy, yet it was difficult to ascertain any major patterns of response distribution or practices that related to higher student achievement. Further secondary analyses of the PIRLS 2006 data by Van Staden (2011) and Zimmerman (2011) using different methodologies shed little light on the impact of teachers' reported teaching practices when utilising the PIRLS teacher questionnaire data. Although the reason for this pattern is not entirely certain, overly positive reporting by teachers for the items or misunderstandings of the meaning of the items is suspected. To illustrate this point, Figure 2 to Figure 5 present some frequencies on reported regularity of activities in classrooms as reported by teachers of Grade 4 students who participated in PIRLS Literacy 2016.
The figures from Figure 2 to Figure 5 indicate the extent to which Grade 4 teachers reported to engage their students in reading activities. Figure 2 indicates overly positive reporting for items related to the teacher reading aloud to students and asking students to read aloud. A strong oral tradition in South African classrooms persists and interestingly, as indicated in Figure 2, the more complex activities become, the less often teachers report to engage in these (e.g. teaching students how to summarise main ideas, or teaching or modelling skimming or scanning strategies).
Figure 3 indicates the reported frequency of teacher reports on the provision of types of reading materials that students are exposed to and associated activities therewith. Activities that require verbal feedback were done more often and teacher reports of allowing students to develop their own understanding of text were overly positively reported. This statement can be interpreted in a number of ways, hence increasing the likelihood that even if a teacher engaged his or her students with the bare minimum in the classroom, it could be regarded as allowing students to develop their own understanding of the text.
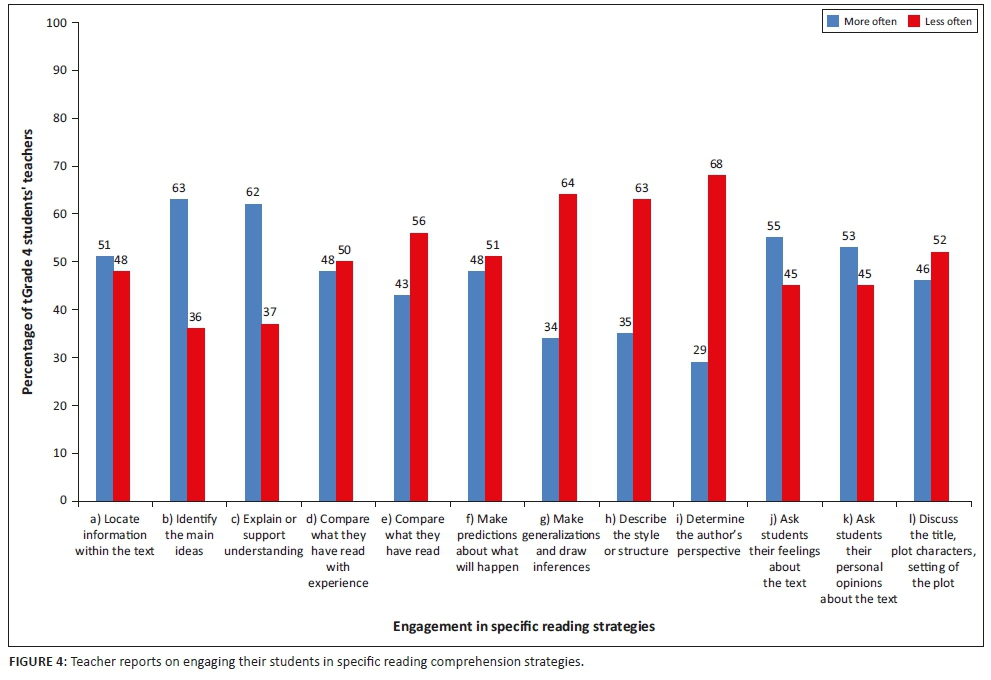
Figure 4 reports the frequency with which teachers engaged in specific reading comprehension strategies and skills. Notably, teachers report positively on engaging in relatively easy strategies, such as locating information in the text, identifying main ideas or asking students to explain or support their understanding of what they read. Again, activities that lean towards verbal feedback occurred more often, such as asking students their feelings or personal opinions about text. More complex strategies, such as making generalisations, predictions and describing the text style and structure, occur reportedly less often.
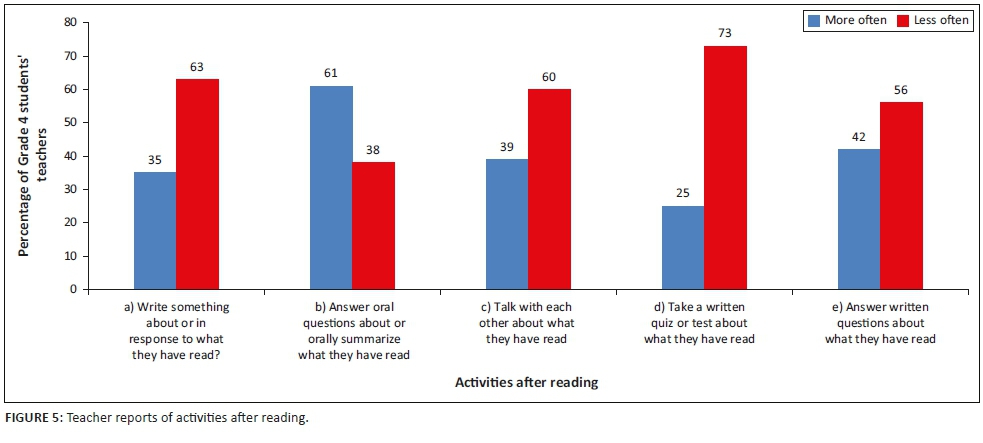
Finally, Figure 5 confirms previous patterns, namely that oral question answering or summarising what was read occurs most often after a text had been read. Answering written questions, tests, quizzes or using cooperative learning methods occurred less often.
Notably, misunderstanding of the meaning of items could point to a problem in pedagogical content knowledge for the teaching of reading literacy, a highly likely scenario in the South African context. In a 2009 report on trends in education macro-indicators from the South African Department of Education (DoE) (2011), it is stated that the percentage of qualified teachers in South Africa increased by 30% between 1994 and 2008. These gains occurred largely amongst African teachers, implying that equity in the distribution of qualifications had increased. However, the DoE (2011) admitted that these figures only reflect formal certification courses, not any measure of teachers' classroom competency or subject knowledge, which was conceded as an issue that remains a serious concern.
Method
Participants
A nationally representative sample of 12 810 Grade 4 students from 293 schools participated in the PIRLS Literacy 2016 study in South Africa (Howie et al. 2017; Mullis et al. 2017). The sample consisted of 48% girls and 52% boys. Students were assessed across all 11 official languages and were assessed in the Language of Learning and Teaching to which they were exposed in Foundation Phase. This means that students were not necessarily tested in their HL, but rather in the language they were exposed to in the school.
Data collection instruments
Achievement tests
The PIRLS Literacy 2016 assessment consisted of a reading literacy test in the form of two types of texts, namely, reading for literary experience (or literary texts) and reading to acquire and use information (or informational texts). Reading texts were followed by a range of multiple-choice questions and open response questions to a maximum of three points. Reporting of reading achievement results in PIRLS Literacy 2016 is presented in terms of achievement above or below the fixed international centrepoint of 500 through the use of five overall plausible values as derived from item response analyses (Mullis et al. 2017).
Background questionnaires
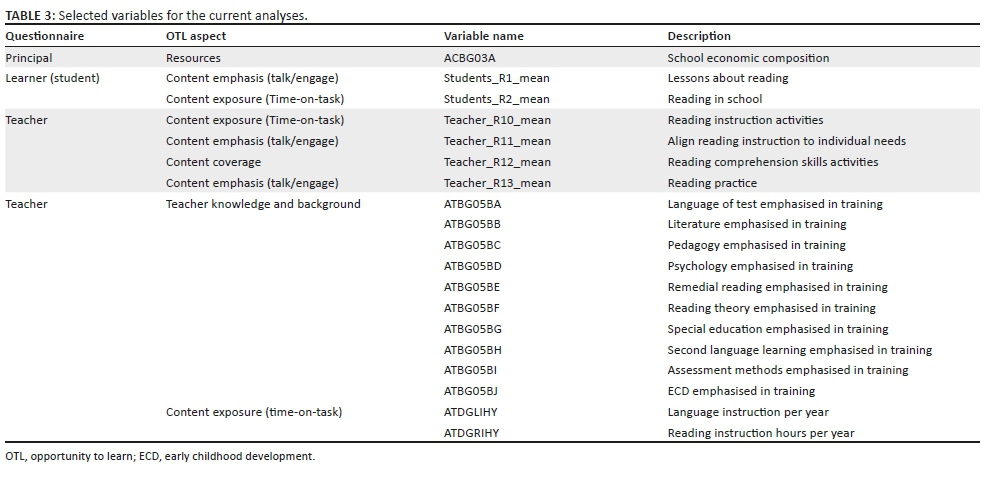
As part of the PIRLS Literacy 2016 study, background questionnaires were administered to school principals, Grade 4 teachers of sampled classrooms, Grade 4 students and their parents. Table 3 presents the variables used for the current analysis.
The current analyses were conducted while controlling for teacher reports on what major areas of study were during their preparation to become teachers. Socio-economic status was also included by means of a quintile indicator.2
Procedure
Descriptive statistics were generated for the selected variables in Table 3 using the International Database (IDB) Analyser, an SPSS plug-in created by the IEA for the use of processing large-scale, weighted data (Foy 2018). Reliability analysis was performed using SPSS, followed by a multiple linear regression of teacher and student questionnaire data using the overall reading literacy performance scores as the dependent variable.
Before analysis was performed variables from the student questionnaire were recoded. In anticipation of overly positive reporting and finding very little difference between categories, variables were dichotomised to indicate attitudes that agree less and agree more, and behaviour to happen more often (everyday or almost everyday) and less often (less than once or twice a week, once or twice a month, or never or almost never). The Cronbach's alpha reliability coefficient for these variables was measured at 0.84.
Results
Descriptive results
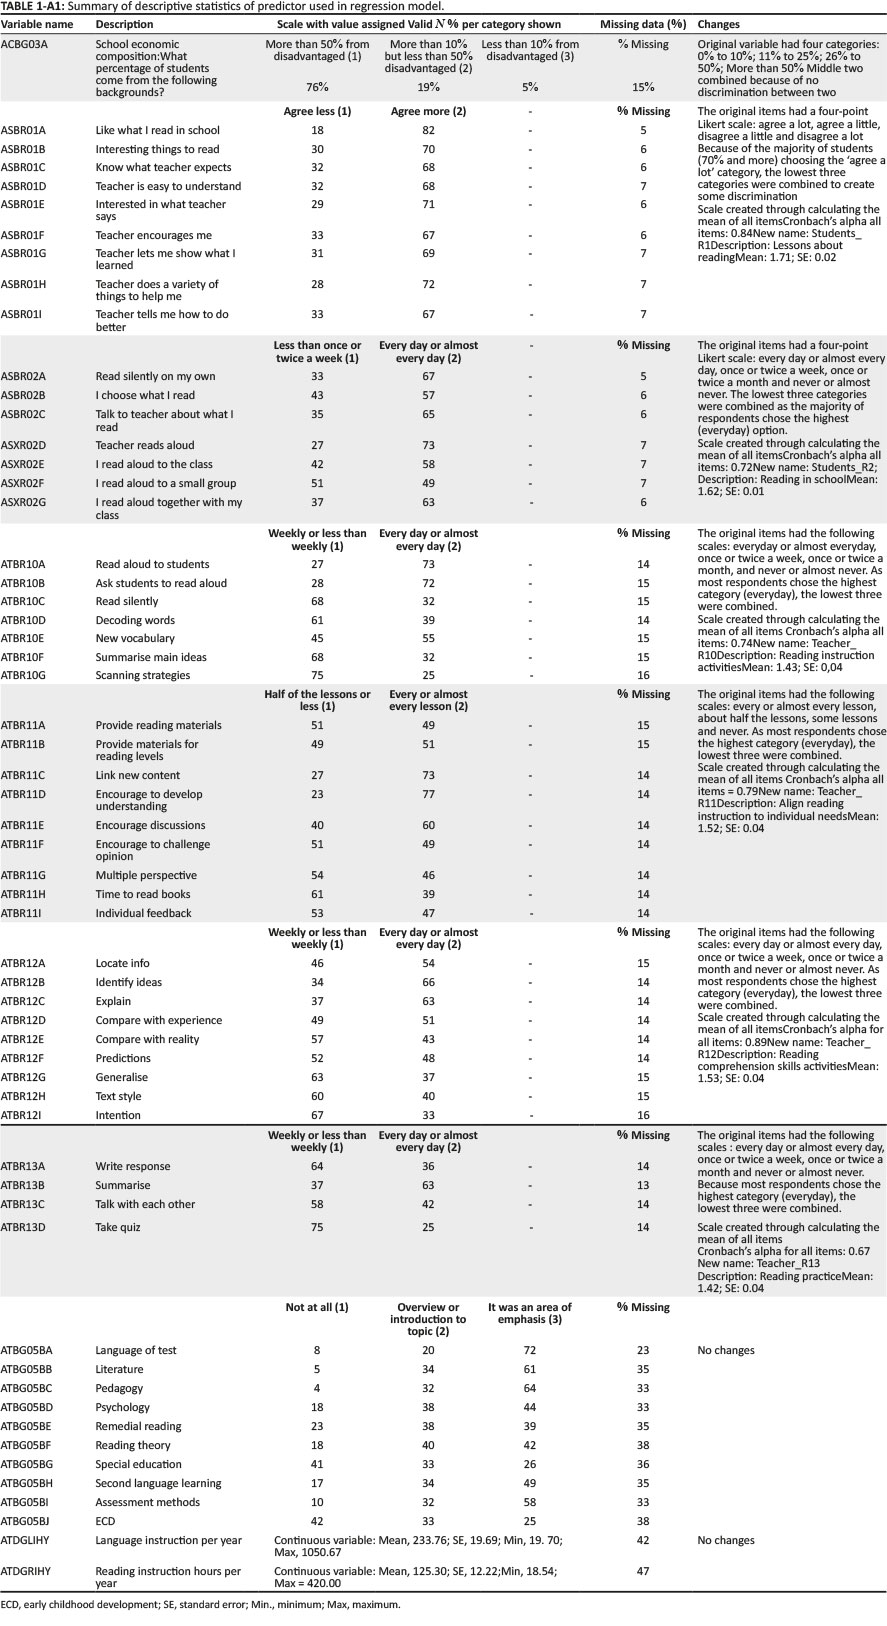
Appendix 1 (Table 1-A1) shows the percentages per category chosen for valid N, percentage of missing data per variable, scales created as well as the variable names and descriptions. A variable from the principal/school questionnaire (ACBG03A) was used to account for socio-economic status of the students and the resulting school composition. Students were asked about their reading lessons (ASBR01A-ASBR0I) and their opportunity to read on their own (ASBR02A-ASBR02G). Because of positive reporting bias, the lowest three categories were combined to create dichotomous variables with less than once or twice a week (coded as 1) and everyday or almost everyday (coded as 2). The means of all the items were calculated for lessons about reading and reading in school, respectively. No further categorisation was applied and the variables were used in their continuous form.
Four scales were also created from the teacher questionnaire based on items: reading instruction activities (ATBR10A-ATBR10G), aligning lessons to individual needs (ATBR11A-ATBR11I), reading comprehension skill activities (ATBR12A-ATBR12I) and reading practice (ATBR13A-ATBR13D). The original items were also on a four-point Likert scale and had to be recoded as dichotomous items to detect discrimination in the variables. Teachers tended to report doing most activities everyday or almost everyday, a potential indication of social desirability responding. The teacher background variables are based on how much emphasis teachers had during their training on aspects such as teaching the language of the test, assessment methods, reading theory and Early Childhood Development (ECD). All scales were created after checking the reliability and all had Cronbach's alpha score of 0.700 and higher, with the exception of teacher reading practice (R13) in the classroom which had only four items but an acceptable alpha score of 0.67. The background variables (ATBG05BA- ATBG05BJ) were not adjusted, nor was a scale created. All the teacher emphasis during teaching was used in the model to potentially find specific areas of study emphasis that could explain student variation in scores. Also included in the model was the number of hours teachers reported engaging in language instruction (ATDGLIHY) and reading instruction (ATDGRIHY). Despite both of these variables having jagged patterns and no linear relationship with reading achievement, they were included in the model as crucial aspects of OTL as defined by various authors (see Schmidt et al. 2008, 2011; Shiel et al. 2009; Stevens 1993).
In this analysis, teacher knowledge, time utilisation or time-on-task, classroom exercises and engaging classwork as defined in a framework for OTL by Walkowiak, Pinter and Berry (2017) were included. The framework of Walkowiak et al. (2017) was linked to the framework of Steven's (1993) in which content coverage, content exposure, content emphasis and quality of instruction are seen as the concepts defining OTL. The two frameworks both include a time element of learning, background of the teacher (indirectly implied in Steven's model) and how the content is conveyed (interactive opportunities to learn and feedback loops). Therefore, variables related to the OTL construct were included in the analysis to explore the potential factors as explanations for reading literacy achievement.
Regression results
Question 1 of the current study asked to what extent OTL, as reported by Grade 4 students, Grade 4 language teachers and principals, explains the PIRLS Literacy 2016 results when controlling for SES and teachers' major area of study. Question 2 asked which OTL variables in the South African PIRLS 2016 data predict reading literacy achievement in Grade 4 level.
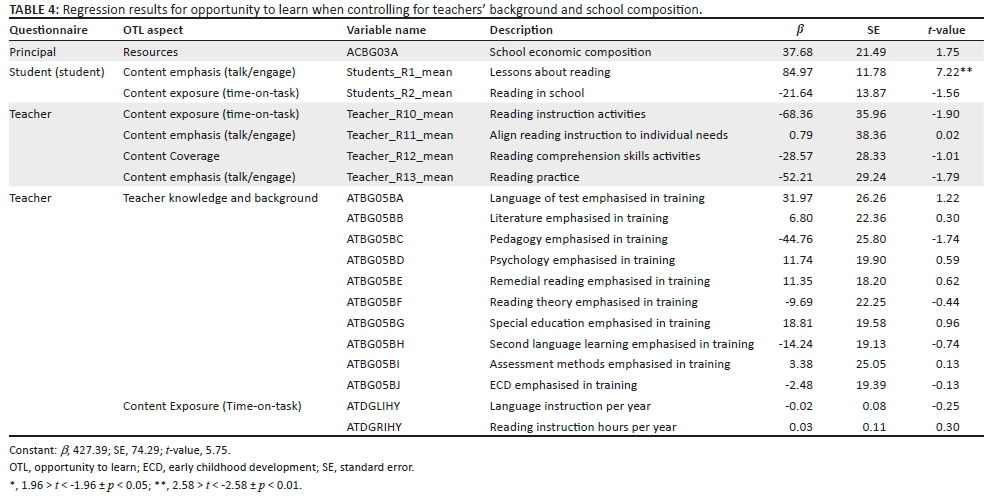
In answer to these questions, Table 4 provides the regression results when all potential OTL variables have been tried in a multiple regression. Socio-economic status and teacher emphasis during training are used as control variables.
Table 4 shows that the only predictor that was significant is the scale based on student reports on lessons about reading. The Students_R1 scale was used as content emphasis (talk/engage) instruction predictor in the model and students can gain as much as 85 score points (t = 7.22 ± p < 0.01) when teachers more frequently give them interesting reading material, clarify what is expected from students, do a variety of activities to assist the students, inform students how to improve when a mistake was made and encourage students to think about what they have read.
As expected, SES makes a substantial contribution, indicating an increase of 38 score points in reading literacy achievement when students are from economically more advantaged backgrounds (but the variable was not significant, t = 1.75). Some variables are negative and functioning in the opposite direction than expected; for example, the teacher scale of reading instruction activities indicates that if the teacher does the activities on a more regular basis, 68 score points can be lost. This is attributed to the lack of discrimination in the variables, the over-reporting of activities and social desirability responding by both teachers and students. For the concept of OTL to be measured in the South African context, new instruments should be designed and ways should be found to assess the missing element: quality of instruction.
The model is not ideal, with many variables that are not statistically significant. As the model was exploratory and informed by literature and definitions of OTL, it was deemed crucial to include all potential variables. It should be noted that the relatively small r2 = 0.20 (or 20% explanatory power) of the variance in student reading literacy achievement is an important step to understand what is associated with reading comprehension development in the classroom, as well as potential ways to measure OTL.
Ethical considerations
Ethical permission to conduct the study was obtained from the ethics committee of the Faculty of Education at the University of Pretoria (reference number UP 06/11/07).
Discussion
This article aimed to reveal the possible value of large-scale assessment data in measuring equal educational opportunity as conceptualised by the OTL. In using the IEA's tripartite model of an intended, implemented and attained curriculum, OTL interprets the attained curriculum beyond overall league table standings. While overall scores are often driven by aptitude, student motivation and class, OTL, as described in this article, should provide a more accurate reflection of the nature of performance and the kinds of opportunities afforded to students across an unequal sector to learn. In the words of Black and Wiliam (2005), the 'black box' of OTL and what happens in the classroom could provide valuable explanations for achievement.
The third research question that guided this study reflects on the extent to which cross-sectional, questionnaire data provide credible measures of OTL in a developing context where teacher classroom practice varies greatly. This article proposed a more effective use of large-scale assessment data from an OTL perspective, specifically in developing contexts, and but recognised that it is still problematic to use teacher and student questionnaire data. Issues of social desirability and overly positive reporting make any claims about the teachers' role in providing opportunities to learn and exposure to the curriculum in the classroom difficult to gauge. In their work, Van Staden and Zimmerman (2017) cited three examples to illustrate the challenges of working with the PIRLS teacher questionnaire data in terms of reported teaching practices for the South African studies. As a first example, evidence of overly positive reporting was gleaned from both PIRLS 2006 and 2011 teacher questionnaire data for one question in particular. Teachers were asked to report the percentage of time spent on a number of activities for reading, totalling 100%. In many instances, teachers indicated having spent 100% of their time on all the available response options, thereby yielding time spent on activities as 600%, a statistical impossibility. Data of this nature are invalid, and the question arises as to whether teachers did not understand the question, or whether their responses point to some aspects of social desirability in an attempts to provide an overly positive image of themselves and the time spent on different activities related to their teaching day. The use of teacher questionnaires in relation to teaching practices in low-performance contexts, such as South Africa, may therefore be problematic as teachers may feel vulnerable and defensive, resulting in unreliable or unrealistic answers. Another possible explanation as pointed out by Shiel and Eivers (2009) in relation to the PIRLS teacher questionnaire data is that:
There is difficulty in establishing associations between frequency of teaching various skills or strategies and student performance. Teachers may emphasise a particular strategy (e.g. daily teaching of decoding, engagement of students in oral reading) because a class is weak and needs additional support, or because it is on the curriculum and must be covered. Hence, many associations between frequency of instruction and achievement in PIRLS are weak, not statistically significant, or counter-intuitive. (p. 35)
As a second example, the pre-PIRLS 2011 teacher questionnaire data specifically provide evidence for the statement made by Shiel and Eivers (2009). Teachers of Grade 4 students were asked to rate how often their students engaged in activities to develop their reading comprehension skills and strategies on a Likert scale that included every day or almost every day, once or twice a week, once or twice a month and never or almost never. Descriptive analysis of this item revealed inconsistencies in the frequencies with which teachers reportedly engaged their students in these activities. Students whose teachers reportedly never engaged them in especially the higher order activities (such as making predictions about the text, making generalisations and drawing inferences) showed higher than expected reading literacy achievement than those percentages of students whose teachers reportedly frequently practised these activities with students in their classrooms. Response patterns like these are counter-intuitive and confirm that associations between reported frequency of activities and achievement tend to be weak. Data presented in this article point to overly positive reporting on easier skills, with fewer opportunities offered to students at the higher end of the cognitive scale.
As a third example also linked to teachers' potential lack of pedagogical insights, in the PIRLS 2006 cycle, teacher reports on students' reading abilities seemed to suggest that they were not aware of the huge reading literacy backlogs of their students. Teachers' lack of ability to judge whether their students were progressing at an acceptable pace is perhaps revealed by the majority of teachers that their Grade 4 students' reading abilities were average or above average, while clearly this was not the case at the low-performing schools. Further analyses of teachers' years of experience in teaching cross-tabulated with judgement of student reading levels did not reveal additional insights, either to suggest that judgement improves with experience. These analyses indicate that as much as half of the teachers with 4 or more than 4 years of teaching experience mostly judge their students to be average readers, a perception that could impact the teaching goals teachers set and the level of cognitive demand placed on students. This cycle in turn could lead to a curriculum implementation lag in instances where teachers misjudged the demands of the curriculum for their students (Zimmerman 2011).
For this reason, students' self-report data were used in an attempt to uncover OTL for purposes of this study, but similar problems with some variables than those found for teacher data were encountered. Positive reporting renders data ineffective in verifying or refuting teacher reports and the measurability of OTL remains an evasive construct in a developing context. A lack of statistically significant coefficients of student reports of reading lessons and little explained variance means that it is perhaps back to the drawing board in attempts to uncover the 'black box' of OTL.
Conclusion
In light of these challenges, the use of PIRLS results beyond league table standings may not always be in the utility of the teacher or student questionnaire data. This lack of utility does not mean that the data are not valuable. Instead, it requires that researchers and policymakers intent on providing feedback use trends where possible and not cross-sectional data, sometimes together with contextual research data from other studies and methods, to reveal insights into the reasons for anomalies and/or counter-intuitive occurrences. To this end, PIRLS 2006, 2011 and 2016 data are available across the three cycles in which South Africa participated. The limitation of cross-sectional data is recognised here, where the value of trend data over time may be more beneficial. Perhaps another opportunity to examine the implemented curriculum, an OTL questionnaire can be administered to the teachers of the students who are assessed in large-scale studies, similar to that conducted by McDonnell in 1995. In this way, it can be ascertained whether the content needed to respond to items on the achievement tests had been taught to students. In instances where the content had not been taught, reasons for this can be explored against curricular expectations. In doing so, it can be ensured that teacher development and training, as is being addressed by the National Policy Framework for Teacher Education and Development, ensure teachers' continuous in-service training for effective teaching.
Acknowledgements
Competing interests
The authors declare that they have no financial or personal relationships that may have inappropriately influenced them in writing this article.
Authors' contributions
S.v.S. conceptualised the article, while C.C. and M.T. assisted with analysis. N.M.P. and K.R. provided feedback on drafts of the manuscript.
Funding information
The PIRLS 2016 study was funded by the National Department of Basic Education.
Data availability statement
Data sharing is not applicable to this article as no new data were created or analysed in this study.
Disclaimer
The views and opinions expressed in this article are those of the authors and do not necessarily reflect the official policy or position of any affiliated agency of the authors.
References
Ananiadou, K. & Claro, M., 2009, 21st century skills and competences for new millennium students in OECD countries, OECD Education Working Papers, No. 41, OECD Publishing, Paris.
Black, P. & Wiliam, D., 2005, Inside the black box: Raising standards through classroom assessment, Granada Learning, London.
Blömeke, S. & Kaiser, G., 2012, 'Homogeneity or heterogeneity? Profiles of opportunities to learn in primary teacher education and their relationship to cultural context and outcomes', in S. Blömeke, F.-J. Hsieh, G. Kaiser & W.H. Schmidt (eds.), International Perspectives on Teacher Knowledge, Beliefs and Opportunities to Learn, pp. 299-325, Springer, Dordrecht.
Bold, T., Filmer, D., Martin, G., Molina, E.C., Stacy, B., Svensson, J. et al., 2017, What do teachers know and do? Does it matter? Evidence from primary schools in Africa, The World Bank, Washington, D.C.
Carnoy, M., Chisholm, L. & Chilisa, B., 2012, The low achievement trap: Comparing schooling in Botswana and South Africa, HSRC Press, Cape Town.
Department of Basic Education, 2011, National Curriculum Statement Grades R-12, viewed 17 January 2018, from https://www.education.gov.za/Curriculum/NationalCurriculumStatementsGradesR-12.aspx.
Du Plessis, E., 2013, Introduction to CAPS, UNISA, Pretoria.
Foy, P., 2018, PIRLS 2016 user guide for the international database, TIMSS & PIRLS International Study Center and the International Association for the Evaluation of Educational Achievement (IEA), Boston, MA.
Heaton, T.B., Amoateng, A.Y. & Dufur, M., 2014, 'Race differences in educational attainment of youth aged 7-18 in post-apartheid South Africa: The role of family structure, resources and school quality', South African Review of Sociology 45(1), 101-121. https://doi.org/10.1080/21528586.2014.887917 [ Links ]
Hoadley, U. & Gallant, J., 2016, 'An Analysis of the grade 3 Department of Basic Education workbooks as curriculum tools', South African Journal of Childhood Education 6(1), 1-28. http://doi.org/10.4102/sajce.v6i1.400 [ Links ]
Howie, S.J., Combrinck, C., Roux, K., Tshele, M., Mokoena, G.M. & McLeod Palane, N., 2017, PIRLS literacy 2016 progress in international reading literacy study 2016: South African children's reading literacy achievement, viewed 14 May 2015, from https://repository.up.ac.za/handle/2263/65780.
Howie, S.J, Van Staden, S., Tshele, M., Dowse, C. & Zimmerman, L., 2012, South African children's reading literacy achievement summary report, Centre for Evaluation and Assessment, Pretoria.
Howie, S.J., Venter, E., Van Staden, S., Zimmerman, L., Long, C., Scherman, V. et al., 2009, PIRLS 2006 Summary Report: South African children's reading literacy achievement, Centre for Evaluation and Assessment, Pretoria.
Lewin, K.M. & Sabates, R., 2012, 'Who gets what? Is improved access to basic education pro-poor in Sub-Saharan Africa?', International Journal of Educational Development 32(4), 517-528. https://doi.org/10.1016/j.ijedudev.2012.02.013 [ Links ]
McDonnell, L.M., 1995, 'Opportunity to learn as a research concept and a policy instrument', Educational Evaluation and Policy Analysis 17(3), 305-322. https://doi.org/10.3102/01623737017003305 [ Links ]
Mullis, I.V.S., 2002, Background questions in TIMSS and PIRLS: An overview, TIMSS and PIRLS International Study Center, Newton, MA.
Mullis, I.V., Kennedy, A.M., Martin, M.O. & Sainsbury, M., 2004, PIRLS 2006 assessment framework and specifications: Progress in international reading literacy study, TIMSS & PIRLS, International Study Center, Newton, MA.
Mullis, I.V., Martin, M.O., Kennedy, A.M. & Foy, P., 2007, PIRLS 2006 international report, TIMSS and PIRLS International Study Center, Newton, MA.
Mullis, I.V.S., Martin, M.O., Foy, P. & Hooper, M., 2017, PIRLS 2016 international results in reading, TIMSS & PIRLS International Study Center, Newton, MA.
Pretorius, E.J. & Klapwijk, N.M., 2016, 'Reading comprehension in South African schools: Are teachers getting it and getting it right?', Per Linguam 32(1), 1-20. https://doi.org/10.5785/32-1-627 [ Links ]
Pretorius, E.J. & Stoffelsma, L., 2017, 'How is their word knowledge growing? Exploring Grade 3 vocabulary in South African township schools', South African Journal of Childhood Education 7(1), 1-13. https://doi.org/10.4102/sajce.v7i1.553 [ Links ]
Reinikainen, P., 2007, Sequential explanatory study of factors connected with science achievement in six countries: Finland, England, Hungary, Japan, Latvia and Russia, study based on TIMSS 1999, University Printing House, Jyvaskyla.
Reeves, C., Carnoy, M. & Addy, N., 2013, 'Comparing opportunity to learn and student achievement gains in southern African primary schools: A new approach', International Journal of Educational Development 33(5), 426-435. http://doi.org/10.1016/j.ijedudev.2012.12.006 [ Links ]
Reynolds, D., 1998, 'Schooling for literacy: A review of research on teacher effectiveness and school effectiveness and its implications for contemporary educational policies', Educational Review 50(2), 147-162. https://doi.org/10.1080/0013191980500206 [ Links ]
Schmidt, W.H., Cogan, L. & Houang, R., 2011, 'The role of opportunity to learn in teacher preparation: An international context', Journal of Teacher Education 62(2), 138-153. https://doi.org/10.1177/0022487110391987 [ Links ]
Schmidt, W.H., Houang, R.T., Cogan, L., Blömeke, S., Tatto, M.T., Hsieh, F.J. et al., 2008, 'Opportunity to learn in the preparation of mathematics teachers: Its structure and how it varies across six countries', Zentralblatt für Didaktik der Mathematik 40(5), 735-747. https://doi.org/10.1007/s11858-008-0115-y [ Links ]
Shiel, G. & Eivers, E., 2009, 'International comparisons of reading literacy: What can they tell us?', Cambridge Journal of Education 39(3), 345-360. https://doi.org/10.1080/03057640903103736 [ Links ]
Shorrocks-Taylor, D. & Jenkins, E.W. (eds.), 2001, Learning from others, Kluwer, Dordrecht.
Stevens, F., 1993, 'Applying an opportunity-to-Learn conceptual framework to the investigation of the effects of teaching practices via secondary analyses of multiple- case-study summary data', The Journal of Negro Education 62(3), 232. https://doi.org/10.2307/2295463 [ Links ]
Tarr, J.E., Chávez, Ó., Reys, R.E. & Reys, B.J., 2006, 'From the written to the enacted curricula: The intermediary role of middle school mathematics teachers in shaping students' opportunity to learn', School Science and Mathematics 106(4), 191-201. https://doi.org/10.1111/j.1949-8594.2006.tb18075 [ Links ]
Taylor, N., 2014, NEEDU National Report 2013: Teaching and learning in rural primary schools, Government Printer, Pretoria.
Van der Berg, S., Spaull, N., Wills, G., Gustafsson, M. & Kotzé, J., 2016, Identifying binding constraints in education, Working papers, University of Stellenbosch, Stellenbosch.
Van Staden, S., 2011, 'Reading between the lines: Contributing factors that affect Grade 5 student reading performance', Unpublished doctoral thesis, University of Pretoria, Pretoria. [ Links ]
Van Staden, S. & Zimmerman, L., 2017, 'Chapter 8: Evidence from the Progress in International Reading Literacy Study (PIRLS) and how teachers and their practice can benefit', in V. Scherman, R.J. Bosker & S.J. Howie (eds.), Monitoring the quality of education in schools: Examples of feedback into systems from developed and emerging economies, Sense Publishers, Rotterdam.
Walkowiak, T.A., Pinter, A.A. & Berry, R.Q., 2017, 'A reconceptualized framework for "opportunity to learn" in school mathematics', Journal of Mathematics Education at Teachers College 8(1), 7-17. [ Links ]
Zimmerman, L., 2011, 'The influence of schooling conditions and teaching practices on curriculum implementation for Grade 4 reading literacy development', Unpublished doctoral thesis, University of Pretoria, Pretoria. [ Links ]
Zimmerman, L. & Smit, B., 2014, 'Profiling classroom reading comprehension development practices from the PIRLS 2006 in South Africa', South African Journal of Education 34(3), 1-9. [ Links ]
 Correspondence:
Surette van Staden
surette.vanstaden@up.ac.za
Received: 28 Sept. 2018
Accepted: 21 Jan. 2019
Published: 10 Sept. 2019
1 . Language structures and conventions and their usage are integrated within the time allocation of the four language skills. There is also time allocated for formal practice. Thinking and reasoning skills are incorporated into the skills and strategies required for listening and speaking, for reading and viewing, and for writing and presenting.
2 . Quintile indicators are used in South African schools to indicate poor schools in the lower quintiles (1, 2 and 3) and more affluent schools in the higher quintiles (4 and 5).

