


Servicios Personalizados
Articulo
 Inglés (pdf)
 Articulo en XML
 Referencias del artículo
Indicadores

Links relacionados
-
 Citado por Google
 -
 Similares en Google
Compartir

 Permalink
South African Journal of Childhood Education
versión On-line ISSN 2223-7682
versión impresa ISSN 2223-7674
SAJCE vol.7 no.1 Johannesburg 2017
http://dx.doi.org/10.4102/sajce.v7i1.412
ORIGINAL RESEARCH
The difficulty level of a national assessment of Grade 9 mathematics: The case of five schools
Sarah Bansilal
Discipline of Mathematics Education, School of Education, University of KwaZulu-Natal, South Africa
ABSTRACT
The introduction of the Annual National Assessment (ANA) programme by the South African education department was met with much resistance from unions with some stating that it is not matched well to the curriculum. In this small-scale study, I compare the differences in outcomes between the internal summative assessment and the ANA for Grade 9 learners from five schools. The results indicate that the learners' results from the final exam were statistically significantly higher than that from the ANA for all five schools. This suggests that the ANA was considerably more difficult than the schools' assessments. However, the learners' scores in each of the two assessments were strongly correlated, suggesting that both tests assessed similar skills. Interviews with the teachers suggested that some of the reasons for the lower results in the ANA were that the test was too long, some instructions were not clear, the timing in September was not ideal and there were too many higher level questions. It is hoped that the results from this study could be used by the education department to improve the functioning of the assessment programme.
Background
At the beginning of each year, the release of the National Senior Certificate (NSC) results is met with consternation. The poor learning outcomes of the education system in South Africa are evidenced by the overall results of the more than half a million Grade 12 learners who write these examinations each year. These poor results show no signs of systemic improvement, particularly in mathematics as indicated by an analysis of the 2015 Grade 12 results by the Department of Basic Education (DBE 2016a, 2016b). According to the 2015 NSC diagnostic report (DBE 2016b:150), 263 903 learners wrote the mathematics examination constituting 40% of the cohort; 388 845 wrote the mathematical literacy examinations. From the mathematics group, there were 58 059 learners (22%) who passed with 50% or higher - these are learners who can progress towards science-related careers. Tracking this cohort back to 2005, when in an ideal situation they would have been in Grade 2, we see that there were 1 094 373 learners enrolled in public schools (Department of Education [DoE] 2006:9). Hence, the number of those who passed with 50% or more (58 059) of this larger Grade 2 cohort form 5% of those who started school in 2004. This analysis shows that the number of learners emerging from the schooling system sufficiently skilled in mathematics is very small. The work by Hanushek et al. (2008) shows that countries with higher test scores in mathematics and science in international assessments experienced far higher growth rates than those with low scores. The importance of producing higher outcomes in mathematics and science has been recognised by the National Development Plan (National Planning Commission [NPC] 2012:276), which recommends that by the year 2030, 450 000 learners should be eligible for a bachelor's programme with mathematics and science. However, current trends suggest that this goal will not be met.
The DBE (2011a) has recognised that the problem starts long before Grade 12 and to its credit has tried to institute policies that could lead to improvements. For example, the introduction of the Annual National Assessments (ANA) in mathematics and literacy was meant to provide information at many levels that could be used to design interventions for sustained improvements (DBE 2011a). The ANA was administered in 2014 to more than 7.3 million learners in Grades 1 to 6 and Grade 9, constituting a massive administration exercise (DBE 2014a:8). The results from the ANA can provide information about an individual learner's understanding at the classroom or school level as well as information on broad trends in learner performance at a national level. The ANA could also indicate problems with respect to the extent and quality of learning opportunities provided to learners, which may need to be investigated further. Furthermore, the data provided by these annual assessments provide useful information to policymakers and other stakeholders (DBE 2014a, 2014b). Some studies (Fleisch 2008; Spaull 2013; Van der Berg 2015) show that the performance of South African children is already below that of international benchmarks as early as Grade 3 or Grade 4. Van der Berg (2015) comments that remedying these deficits requires major interventions in these early grades.
Implementation of the ANA is designed to allow teachers to participate in the marking process, thereby offering important benefits to teachers. Research indicates that many teachers need help to develop their assessment skills (Bansilal 2012; Moodaly 2010; Van der Berg & Shepherd 2015; Vandeyar & Killen 2003). As part of the marking process, teachers are required to mark the ANA scripts, and a sample of these is sent for moderation to the provincial authorities (DBE 2014a). When the scripts are returned to the schools, the mathematics departments can interrogate the changes, thus offering learning opportunities for the mathematics teachers. Further learning opportunities for the teachers are possible at the cluster level where groups of schools talk about the responses to the assessments. Furthermore, the subject advisor can use the ANA results as a common reference point within the district and provide further learning opportunities for the teachers (DBE 2014b). Hence, the ways in which teachers engage with the national assessment tool can improve teachers' assessment skills. A comprehensive discussion of learners' errors and misunderstandings and how these can be used for professional development opportunities for teachers was also provided in the 2014 ANA diagnostic reports (DBE 2014b). Thus, teachers are able to engage with the reports on an individual basis as well.
Some studies (Bansilal 2012; Moodaly 2010; Van der Berg & Shepherd 2015; Vandeyar & Killen 2003) indicate that many teachers have limited skills in conducting learner assessments. Van der Berg and Shepherd's (2015) study found that the continuous assessment marks provided by many schools were higher than the marks obtained in the matriculation examination. In particular, continuous assessment marks from Quintile 1, 2 and 3 schools were far less accurate when compared to the final examinations than those for Quintiles 4 and 5. The authors found that continuous assessment marks were often inflated even though there may have been a correlation between the two sets of marks in some schools. However, for many underperforming schools, the marks were not correlated, indicating that the schools provided unreliable assessment (Van der Berg & Shepherd 2015). Moodaly (2010) studied assessment tasks designed by 32 mathematical literacy teachers teaching in Quintile 1, 2 and 3 schools and found that 84% of the activities required competencies from below the grade level specified. There were 29% that had incorrect solutions to their tasks, while 12% had irrelevant answers. One of the most important functions of assessment is the feedback that it provides to learners about the extent of their understanding of the subject matter (Bansilal, Naidoo & James 2010). Feedback 'is most effective if it focuses students' attention on their progress in mastering educational tasks' and relates to what their instruction is focused on (Crooks 1988:468). Hence, if assessment is not closely aligned to what the learners were taught and if it is not targeted well enough to distinguish between proficiencies of the learners for whom the assessment is designed, it does not help the learner. Hence, studies such as Van der Berg and Shepherd (2015) as well as Moodaly (2010) suggest that many schools struggle to conduct basic assessments of learners.
Research suggests that only about 25% of the schools in South Africa are functioning well (Spaull 2013). Schools that are struggling may find it hard to perform simple tasks such as planning joint assessments that form an integral part of well-managed schools (National Education Evaluation & Development Unit [NEEDU] 2013). Planning the teaching so that the timing fits in with the ANA schedules can be done on an internal basis by such schools. However, in schools with fragile organisational structures, teachers are more likely to work in isolation and will struggle to put such measures in place. Ironically, it is these struggling schools that could benefit the most from discussions about assessment issues associated with the ANA. Some of the pertinent issues include the performance of their learners, the design of the assessment items, the departmental marking memorandum guidelines as well as distribution of the items according to the departmental guidelines. Thus, with proper planning, participation in the ANA could contribute to improvements in teaching, learning and assessment practices in such fragile schools (NEEDU 2013).
Teacher unions have not welcomed the ANA introduction, and they disrupted administration of the test in 2015. The unions questioned the validity of the assessments, as well as their usefulness in improving the educational outcomes (Monama 2015). Looking at the notion of assessment, Nitko (2001:4) describes it as 'a process for obtaining information that is used for making decisions about students, curricula and programs'. In terms of validity of assessments, Messick (1989:6) emphasises that 'validity always refers to the degree to which empirical evidence and theoretical rationales support the adequacy and appropriateness of interpretations and actions based on test scores'. Similarly, Cronbach (1971:443) defined validity as 'the soundness of all the interpretations of a test'. Kane (2000) supports these definitions by Cronbach (1971) and Messick (1989) by noting that they relate validity to the appropriateness of the inferences included in test-score interpretations. Hence, the concept of validity applies to the ways in which we interpret and use the assessment results; Nitko (2001) cautions that the uses one makes of the assessment results are valid only to the degree to which one can point to evidence that supports their correctness and appropriateness.
Noting that the Grade 12 national matric examination has been in existence for over 150 years (DBE 2010:1), the DBE is confident that the NSC examination is a robust assessment tool. The DBE notes that this exit examination 'is a well-established, internal indicator of the quality of education and of learning achievement, particularly at secondary-school level' (DoE 2008:34). Further support for the matric examinations is provided by international comparisons, which produced favourable reports of the NSC examination (DBE 2010). The education department notes that 17 of the NSC examination question papers were benchmarked by three reputable assessment bodies from the UK, Scotland and Australia (DBE 2010):
The report produced by the three assessment bodies indicated that the standard of the question papers set by the Department of Basic Education (DBE) in South Africa is comparable to that of the three countries. (p. 11)
In contrast to the matric examination, which has become an established component within the education landscape, the ANA is a new assessment tool that has not yet had time to mature into an established assessment indicator. Much research and development is required so that the programme can be optimised. Van der Berg (2015) notes concerns about the quality and the calibration of the ANA tests. One of the issues raised is the very poor results in the Grade 9 mathematics ANA. In 2014, only 3% of learners achieved 50% or more, whereas the national average was 11% (DBE 2014a). Van der Berg (2015:33) raises a concern that 'the very low marks in Mathematics may lead to a situation where Grade 9 Maths marks in ANA contain little signal and much noise'. Graven and Venkat (2014) conducted a study with 54 teachers from 21 schools about their experiences with the ANA. The teachers reported that their learners found the experience of writing the national assessments very stressful. Concerns were also articulated by the teachers about the length, language and timing of the tests. The authors call for more research that should investigate the unintended consequences of ANA on learner experiences and on teacher practices (Graven & Venkat 2014). Pournara, Mpofu and Sanders (2015) present a content analysis of the Grade 9 mathematics ANA across three years, using the DBE assessment taxonomy that classifies items according to four levels of cognitive demand (Knowledge, Routine Procedures, Complex Procedures, Problem Solving). The content analysis by Pournara et al. shows that the representation of knowledge level items was 13% as compared to the DBE recommended percentage of 25%. Knowledge level questions have a low cognitive demand; hence, the analysis suggests that the assessment instruments contained fewer questions with a low level of cognitive demand than expected according to the guidelines of the education department. For example, the authors found it notable that in the question based on solving equations, none of the items as simple linear equations. All the items required some manipulation and transformation before they could be solved using familiar procedures. The authors also raised a concern about the level of Euclidean geometry, which has just been reintroduced into the core of Further Education and Training (FET) band of mathematics. Although it is important that Euclidean geometry be treated seriously, the authors suggest that the 'generalised formal reasoning' evident in the ANA items across the three years appears to be beyond what the curriculum intended. Learners at Grade 9 level may not be ready to deal with such formal proof (Pournara et al. 2015:39).
This study aims to contribute findings that could be used to improve the functioning of the ANA as an assessment tool, so that the results can be interpreted and used with more confidence. In this small-scale study, I focus on the results obtained by learners in the Grade 9 mathematics ANA and compare these to the results obtained by the same learners in their final mathematics examination in five well-functioning schools. This can provide indications as to which of the two assessment instruments proved more difficult to the participants.
Methods
I investigated the ways in which the ANA was being taken up in schools in 2013, and I observed that in one school (School B in this study), the set of learner scores from the internal examination were strongly correlated with the ANA results per learner; however, the marks were much higher for the internal examination. Then, I probed this issue further in 2014 using five schools from two districts in KwaZulu-Natal. Thus, the study design can be described as a multiple case study using a replication logic (Yin 2009:54).
Fifteen schools from the various quintiles were approached for access to data, five of whom submitted sufficiently detailed information that formed the basis of this analysis. Of these five schools, four were classified as Quintile 5 and one was classified as a Quintile 4 school. Data comprising the ANA marks and the final examination marks of 1020 learners across the five schools were used to calculate the Pearson's correlation coefficient. Teachers from schools A, B and C also agreed to participate in focus group interviews that probed them about their opinions and experiences of the 2014 Grade 9 mathematics ANA, which was written in September 2014. In order to contextualise the schools in terms of their own effectiveness, details of matric pass rates, mathematics results and ANA ranking in the district are also provided; these details show that the five schools are among the top performing schools in the districts.
The research questions that guide this study are the following: (1) What are the differences in outcomes between the two assessments (ANA; schools' summative Grade 9 assessment) as indicated by the scores of the learners? (2) What are Grade 9 mathematics teachers' views about the 2014 mathematics ANA?
Results
Table 1 shows that the average results obtained by learners in each of the schools for ANA are much higher than the national average (11%). As shown by their rankings, they are amongst the high-performing schools in the two districts. An analysis of school matric examination results also indicates that they performed excellently. Three participant schools obtained 100% matric pass rates and the remaining two achieved pass rates of over 94% in 2015, well over the provincial pass rate of 60.7% (DBE 2016c). These schools also achieved much higher pass rates in mathematics than the national pass rate (Datafirst 2013). On average, the mathematics Grade 12 results for the participant schools (80.3%) were more than double that of the national pass rate of 40% in 2013 (latest available per school, pass taken as achieving 40% and above) (Datafirst 2013; DBE 2016a). It is evident that all five schools are performing much higher than the average school and, consequently, their internal systems are more robust than most schools in the country. We can hence consider their internal assessment results as more reliable than the majority of schools in South Africa. Hence, the scores from the schools' internal examinations can form a basis for comparison with results from other tests, such as the ANA. I briefly consider the comparison per school of the internal final examination and the ANA before focusing on the teachers' views about the ANA.
Comparing the difficulty levels of the ANA with the schools final examination
An assumption of the Rasch model was used to interpret the terms 'item' or 'test difficulty' in order to compare scores. The first step to develop an approximation of the relative item difficulty in a Rasch analysis is to calculate the ratio of correct responses to incorrect responses. Thereafter, the log of the odds ratio is calculated that forms the calibration basis of item difficulty (Bond & Fox 2007:23-25). If Item A has a higher percentage of correct responses than Item B, it indicates that Item B was experienced as more difficult than Item A. Hence, comparison of the learner scores in two tests can be used to compare the difficulty of the tests experienced by the learners. The assumption underlying this study is that the test in which learners achieved lower scores shows that the test was experienced as more difficult than the test in which they achieved higher scores.
In this section, I first examine the correlations between the two sets of scores before examining the difference between the means; thereafter, I focus on difference in performance at the achievement levels. Each of these schools provided a list of the Grade 9 learners' results for the schools' formal summative assessment (final examination), because it covers work performed throughout the year. I used the final examination raw scores instead of the final scores, because some schools included a portion of the ANA mark in the calculation of the continuous assessment mark.
Correlation between the results from the two assessments
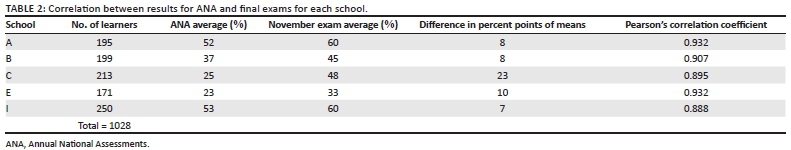
The correlation between the two sets of individual learner scores for each of the schools is provided in Table 2.
Column 6 of Table 2 shows that for each school, the scores from the final exams and that of the ANA are strongly correlated using the Pearson's product-moment correlation coefficient where p < 0.001 in each case. This means that the ranking of the learners according to the two assessments were aligned. The very strong correlations provide evidence that the rankings of the learners according to the two assessments are similar, and we can conclude that the two assessments were more or less assessing the same underlying trait or skills (Van der Berg 2015:32). This interpretation by Van der Berg (2015) was made with respect to the correlations observed between the ANA tests and the systemic evaluations. Further, the difference between the means is now analysed.
Difference between the means
The analysis of the means of the two tests across each school appears in the fifth column of Table 2 and shows that the difference of percentage points ranged from 7 points up to 23 points. Furthermore, across all five schools, the differences between the means were found to be statistically significant. The results of the paired sample t-test for only one school (A) are presented in Figure 1 as well as a diagram showing the 95% confidence intervals of the means.
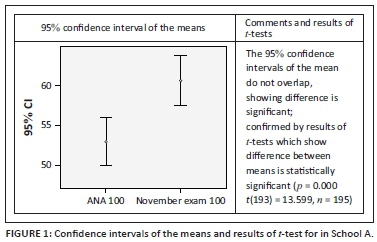
Figure 1 presents a visual representation of the differences between the means of the two assessments for School A. For each of the schools, irrespective of the value of the mean for each assessment, the confidence intervals of the means do not overlap. The paired sample t-tests carried out for each school provide further evidence that the final examination results were significantly higher than the ANA results (School B: p = 0.000 t(197) = −12.64; School C: p = 0.000, t(212) = 38.57; School E: p = 0.000, t(170) = 3.245; School I: p = 0.000 t(249) = −10.865).
The final quantitative analysis concerns specific levels where the differences are more apparent.
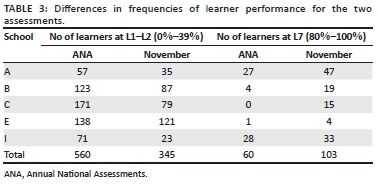
Differences at particular levels of performance
Table 3 shows the number of learners who performed at the various levels where Level 1 (L1), Level 2 (L2), Level 3 (L3), Level 4 (L4), Level 5 (L5), Level 6 (L6) and Level 7 (L7) refer to achievement in the range of 0%-29% (not achieved), 30%-39% (elementary achievement), 40%-49% (moderate achievement), 50%-59% (adequate achievement), 60%-69% (substantial achievement), 70%-79% (meritorious achievement) and 80%-100% (outstanding achievement), respectively (DBE 2011b:56). The levels of achievement are used to distinguish between the proficiencies of learners in the various subjects at school level. The number of learners who performed at Level of L1-L2 (0%-39%) in the ANA was 560 as compared to 345 in the final exam. Hence, the number in the two lowest levels increased by 63% in the ANA as compared to the schools' final examinations. This suggests that the test was not as sensitive in distinguishing between differences in mathematics proficiency at the lower levels as compared to the schools' examinations. In terms of performance in the 80%-100% band, 60 learners obtained distinctions in ANA, while 103 achieved distinctions in their internal examination. The number in the highest level based on the internal exam decreased by 42% under the ANAs. The difference in the distribution of the performance in terms of levels for the two tests is very marked and shows that the ANA test was more difficult than each of the individual schools final examination.
I now look at the teachers' own perspectives of the ANA.
Grade 9 mathematics teachers' views about the ANA
The teachers raised issues about the Grade 9 curriculum, using ANA to work out their teaching plan and the length, timing and instructions of the 2014 mathematics ANA. These issues are discussed in further detail, using teachers' comments (the letter next to each comment refers to the teacher's school).
The curriculum and ANA are not designed for the average learner
Many teachers complained that the curriculum included too many topics for the time available in Grade 9:
'I think the big factor is there is not enough time for the syllabus because by the time you get to the end of the section and you have a test and you find there are certain problems we don't have time to go back and fix it. We have to move on to the next section. That is a big problem. There is no time for that in the programme.' (Teacher C)
'If you look at the Grade 9 syllabus there are so many topics you can virtually teach a new topic nearly every other day if you have to keep up with the recommended pace.' (Teacher E)
These teachers felt that the lengthy curriculum left little time for practice before the ANA, which was written in September. The timing meant that the test was conducted long before the end of the year, which put pressure on the teachers in terms of content coverage. Some teachers felt strongly that the new Curriculum and Assessment Policy Statement was targeted for the above average learner because of the pace that the curriculum had to be delivered, so the ordinary learner was left behind:
'My honest feeling is that the pace is for the bright student. It's not for the average student. The bright student can keep up. We have got 80s and 90s students. … The pace of the Grade 9 syllabus is for the top students it is not for the below average they can't keep up. They fall by the wayside and give you 25%.' (Teacher C)
Teachers felt that the ANA was similarly targeted towards the above-average learner. There were too few questions that were accessible to those learners who were barely coping:
'[if] you are going to find out at that point what the learner knows at that point in time. What is he meant to know? What does he need to know? For example, I need to know to be able to times that two brackets or add so many like terms, if I can make an example. There is no point in [most items] challenging to level 4 and that is actually what the paper did.' (Teacher B)
The above excerpt illustrates that the teachers were frustrated because the ANA did not contain sufficient simple, uncomplicated examples that could assess learners' procedural algebraic skills.
One school designed their teaching plan around the ANA
In contrast to the views of the other schools, School A (which achieved the highest average in district 1) reported that the pace of the curriculum was adequate for their practices. The curriculum coverage was planned by taking into account the fact that the ANA assessment would be written in September:
'We found it quite beneficial because we had some time to do revision focusing on ANA and we were then able to revise all that had to be covered from beginning of the year so we revised and then they had written a full exam on it. We then covered in term 4 two more sections that was not part of ANA and we had time to go back and revise again.' (School A)
It is of interest that this school used ANA optimally in their Grade 9 calendar, so that they could extract the most benefit for their own learners. However, it is important to note that such an approach requires effort and integrated planning by the whole school.
The ANA test was too long
All the teachers complained that the test was too long at 2.5 hours. One teacher (B) again, 'In my opinion it should be cut down in time up to an hour or hour and a half.' The Association of Mathematics Educators in South Africa report (AMESA 2015) concurred that the ANA was too long and noted that a Grade 12 mathematics learner is given 3 hours to write an exam consisting of 150 marks, so it is inconsistent to expect a Grade 9 learner to write for 2.5 hours for 140 marks. The teachers also noted a concern that the geometry appeared towards the end when learners' concentration was lower. The language used by the teachers conveyed frustration and sometimes even anger. For example, one teacher (B) expressed his view: 'In my opinion, I think that it is a waste of money from the government point of view.'
The timing of the ANA was not ideal
Some teachers were unhappy with the timing and felt that the learners were not ready to take a full examination in September. One teacher (C) commented, 'I think it should be regarded as a final exam, not as something that should be written in September.' The impression was that learners had not reached the mental maturity or developed the conceptual understanding required to solve some of the problems. Children need time to develop conceptual understanding of some mathematics concepts. As learners practised, they could progress in working different kinds of examples - conceptual understanding is not something that could just happen:
'You have to take into account the maturity level of the child at the time. Even for the Grade 12's you can't ask them some questions in February, they can't do it, but later on they can… Let's just say for geometry, let's focus on the calculation part and then towards the end you can do the proof part. Then they are sort of more mature to deal with that kind of thing.' (Teacher B)
The teachers were concerned that the questions were biased towards formal mathematics skills such as geometry proofs. Developing the necessary conceptual understanding to handle formal proofs takes a long time. When concepts are taught, teachers usually start with simple examples based on calculations. As learners' understanding of the concepts develops, they can work with more formal examples that may include proofs or sophisticated algebraic manipulation. The concern was that, with the geometry example, only one question was based on calculations (question 9.2); then the question was made harder because the values of the given angles were written in the instruction instead of being placed on the diagram. All the other geometry items required formal reasoning.
On the contrary, as noted earlier, a teacher from school A was pleased with the timing of the assessment and felt that because it was distributed before the final school examination, it helped the learners prepare for the final.
Teachers also pointed out technical problems with the use of fonts and unclear instructions. For example, one question asked whether a given relationship was a direct or indirect proportion when it was neither of those. A question that asked for the cube root of an expression was not clear because the '3', denoting the fact that it was a cube root, was blurred. Teachers also pointed out that the font used in naming angles caused the writing to appear blurred.
Discussion
The comparison has shown that the results produced by the ANA and the school examinations were strongly correlated, which implies that the ranking produced by the two assessments were similar. Note that a strong correlation between two sets of score does not imply that the scores have the same range. Two sets of data can be strongly correlated, but students may have achieved higher scores on one of them. To see this, consider the following set of scores for tests A, B and C: Set A (mean = 50.5; SD = 11.1); Set B (mean = 51.4, SD = 11.3); Set C (mean = 45; SD = 11.4).
Suppose that the correlation between A and B is 0.9 and that the correlation between A and C is 0.9. The equation of the regression line predicting the relationship between A and B can be written as y = 1.01x + 0.4 (where X: scores for test A and Y: test scores for B). Thus, a person with a score of 60 in test A is likely to have obtained a score of 61 in test B. Although the scores for A and B are highly correlated, learners performed better in test B than in test A. In contrast although test C scores are highly correlated with that of test A scores, the results for C are much lower than that of test A. The corresponding equation of the regression line is y = 1.02x -6.51 (where X: set of scores for A and Y: set of scores for C). Hence, a person with a score of 60 in test A is likely to have obtained a score of 54 in test C. The presence of a strong correlation between two sets of scores does not imply that the scores are the same - the levels in one can be higher than in the other, as is the case of the ANA and the schools' final examinations.
Notably, both assessments are based on the same curriculum content; the strong correlations indicate that the two assessments were more or less assessing a similar construct and hence the correlations are more likely to be attributed to skills in mathematics rather than something unrelated to mathematics. However, the results from the ANA were statistically significantly lower than those produced by each of the schools' final examination. Although the internal assessments differed in difficulty levels among the participant schools (e.g. School C had a lower ANA average than School B but a higher school exam average), across all these schools, their school assessment results were higher than the ANA. The findings indicate that the ANA categorised 63% more learners as performing on the L1 and L2 levels (0%-39%) compared to their final examination. At the other end of the scale, the ANA results classified far fewer learners with outstanding achievement, when compared to the examination. The differences between the two sets of results mean that each one presents a different picture of some of the learners' proficiencies. For example, some learners would be categorised as struggling with mathematics if they are categorised as L1 or L2 according to the ANA results, but will be categorised as coping with mathematics if they are categorised as L3 according to the school examination results. Hence, the categorisation of learners' levels of proficiency based on the ANA results only should be treated with caution. The ANA has under-reported the proficiency of Grade 9 learners when compared to the examination results reported by all of these five well-functioning schools. However, it must be noted that these differences are based on learner scores only, and more research focused on the actual content of the assessments will need to be conducted.
The differences in performance of the learners according to the levels point to differences in the difficulty level experienced by the learners. One of the main contributors to differences in difficulty is the level at which the content is tested, a concern that was articulated by the teachers. The teachers' views were that there were too many higher level questions catering to the brighter learner only. The teachers suggested that the test should include more questions that were uncomplicated and tested routine skills that could enable average learners to display their competence. Pournara et al. (2015) note a similar concern with respect to simple linear equations, questions of which did not appear in the ANA. Furthermore, the teachers felt that the learners were not yet ready for the type of reasoning asked in the geometry questions and suggested that the test should include more calculations in geometry and fewer proofs. This burden of proof was also identified by Pournara et al. (2015) who argued that the geometry items were dominated by formal proof requirements that seem to be beyond the curriculum specifications.
The issues identified by the teachers are related to assessment targeting. A test where most items are beyond the proficiency of the target group will not make any meaningful improvement to learners' understanding. Similarly, the feedback benefits offered by a test are limited if all the items are answered correctly by the target group. Rasch measurement theory, for example, is often used to improve the targeting of the test by identifying items that are not well targeted (i.e. experienced as either too easy or too difficult) (Bond & Fox 2007). Tests set by class teachers will certainly be better targeted to their class, as the purpose would include diagnosis of difficulties and a check on the teaching of particular topics. In contrast, the designers of the ANA can only work with an imagined cohort and, hence, the setting of the items may have missed the mark.
A further contributor to the differences in difficulty levels as experienced by the learners was the timing of the ANA test. Most teachers in this study felt that writing the test in September was not ideal, because some learners were not ready to handle questions that demanded more conceptual understanding. The learners would have been better prepared two months later when they wrote their November examination.
The teachers raised further concerns about technical issues related to the clarity of information, an issue that was also raised in the report compiled by the AMESA (2015). The DBE needs to ensure that sound moderating systems are put in place so such problems could be minimised. Other issues raised by the teachers were the length of the tests, an issue identified by the primary school teachers in the Graven and Venkat (2014) study. Some teachers felt that the curriculum itself was overloaded at the Grade 9 level. If these schools with sound internal support and management systems are struggling to keep pace with the Grade 9 mathematics curriculum, then it is likely that other schools with poorer functioning systems must be struggling even more. As teachers focus on covering topics, they may not be focused on the need to develop sound conceptual understanding of those concepts.
However, it is important to note that the curriculum overload view was not shared by the teachers from the school with the highest average in one district. School A has shown that learners can obtain good results if the grade teaching plan is organised around the ANA. School A made use of the ANA as an opportunity for their learners to have the experience of a full-length examination before their school's final examination. The learners were then given feedback about their learning and this was used to strengthen their performance in their final examination. Hence, problems were identified and remedied before they wrote their own school examination. However, even with such a well-managed system, the ANA results were statistically significantly lower than the school's internal results.
Conclusion
The results of this small-scale study indicate that the scores from the two assessments were highly correlated; therefore, the rankings of the learners were similar. However, the learners' results from the final exam were statistically significantly higher than those from the ANA for all five schools. These trends suggest that the ANA assessment was not sufficiently sensitive to distinguish performance at the lower end where 63% more learners were categorised as not having attained a moderate achievement. Hence, the ANA was experienced as more difficult than the schools' final examinations. The interviews revealed that many teachers felt that the test could be improved by including some items that are accessible to below average learners. Further recommendations were that the timing of the ANA should be reconsidered, and the test should be shortened. As noted earlier, the ANA is a new assessment tool in contrast to the matric examination that has been in existence for over 150 years. It is expected that the DBE will use feedback from teachers, researchers and other stakeholders to refine and improve the programme. The findings from this study are offered as a contribution to this end. The DBE is to be commended for the availability of information provided in the reports on the Internet, as well as the involvement of teachers in the marking process; however, they need to ensure that the test is of the highest quality so that the items are sound assessment exemplars that teachers could use in their classrooms for assessment of learning by their learners.
Acknowledgements
Funding for this study was provided by the programme to support pro-poor development (PSPPD II) in collaboration with the EU (contract number EuropeAid/134258/M/ACT/ZA PSPPD2/CfP2/2014).
Competing interests
The author declares that she has no financial or personal relationships which may have inappropriately influenced her in writing this article.
References
Association of Mathematics Educators in South Africa (AMESA), 2015, 'AMESA report on the Annual National Assessment (ANA) for mathematics (Grades 3, 6 & 9)', AMESA News 56, 29-45. [ Links ]
Bansilal, S., 2012, 'Arriving at the starting point? Exploring a teachers' use of circular reasoning in a mathematics classroom', Education as Change 16(1), 35-49. https://doi.org/10.1080/16823206.2012.691706 [ Links ]
Bansilal, S., James, A. & Naidoo, M., 2010, 'Whose voice matters? Learners', South African Journal of Education 30(1), 153-165. [ Links ]
Bond, T.G. & Fox, C.M., 2007, Applying the Rasch model: Fundamental measurement in the human sciences, 2nd edn., Routledge, London.
Cronbach, L.J., 1971, 'Test validation', in R.L. Thorndike (ed.), Educational measurement, 2nd edn., pp. 443-507, American Council on Education, Washington, DC.
Crooks, T.J., 1988, 'The impact of classroom evaluation on students', Review of Educational Research 58, 438-481. https://doi.org/10.3102/00346543058004438 [ Links ]
Datafirst, 2013, Data portal, viewed 10 November 2015, from https://www.datafirst.uct.ac.za/dataportal/index.php/catalog
Department of Basic Education (DBE), 2010, National examinations and assessment. Report on the National Senior Certificate Examination results, 2009 Part 2, DBE, Pretoria.
Department of Basic Education (DBE), 2011a, Report on the Annual National Assessment of 2011, DBE, Pretoria.
Department of Basic Education (DBE), 2011b, Curriculum and assessment policy statement (CAPS). Mathematics grades 10-12, DBE, Pretoria.
Department of Basic Education (DBE), 2014a, Report on the Annual National Assessments of 2014, DBE, Pretoria.
Department of Basic Education (DBE), 2014b, The Annual National Assessments of 2015. Diagnostic report intermediate and senior phases. Mathematics, DBE, Pretoria.
Department of Basic Education (DBE), 2016a, 2015 National Senior Certificate Examination. Examination report, DBE, Pretoria.
Department of Basic Education (DBE), 2016b, 2015 National Senior Certificate Examination. Diagnostic report, DBE, Pretoria.
Department of Basic Education (DBE), 2016c, 2015 National Senior Certificate Examination. Schools performance report, DBE, Pretoria.
Department of Education (DoE), 2006, Education statistics in South Africa at a glance in 2005, DoE, Pretoria.
Department of Education (DoE), 2008, Education for all (EFA) country report: South Africa, DoE, Pretoria.
Fleisch, B., 2008, Primary education in crisis: Why South African schoolchildren underachieve in reading and mathematics, Juta & Co, Cape Town.
Graven, M. & Venkat, H., 2014., 'Primary teachers' experiences relating to the administration processes of high stakes testing: The case of Mathematics Annual National Assessments', African Journal of Research in Mathematics, Science, and Technology Education 18(3), 299-310. https://doi.org/10.1080/10288457.2014.965406 [ Links ]
Hanushek, E.A., Woessmann, L., Jamison, E.A. & Jamison, D.T., 2008, 'Education and economic growth', Education Next 8(2), 62-70. [ Links ]
Kane, M.T., 2000, An argument-based approach to validation, Association of College Testing (ACT), Iowa City, IA.
Messick, S., 1989, 'Meaning and values in test validation: The science and ethics of assessment', Educational Researcher 18(2), 5-11. https://doi.org/10.3102/0013189X018002005 [ Links ]
Monama, T., 2015, 'Sadtu to boycott ANA's', Pretoria News, 4 September, viewed 10 November 2015, from www.iol.co.za/news/south-africa/gauteng/sadtu-to-boycott-anas-1.1910787#.VkHgPLcrLIU
Moodaly, S., 2010, 'An exploration of mathematical literacy teachers' design of ML assessment tasks', Unpublished BEd (Hons) research report, University of KwaZulu-Natal, Durban.
National Education Evaluation & Development Unit (NEEDU), 2013, NEEDU national report 2012. Summary, DBE, Pretoria.
National Planning Commission (NPC), 2012, National development plan 2030: Our future: Make it happen, The Presidency (SA), Pretoria.
Nitko, A.J., 2001, Educational assessment of students, Merrill Prentice-Hall, Upper Saddle River, NJ.
Pournara, C., Mpofu, S. & Sanders, Y., 2015, 'The grade 9 maths ANA - What can we see after three years?', Learning and Teaching Mathematics 18, 34-41. [ Links ]
Spaull, N., 2013, 'Poverty and privilege', International Journal of Educational Development 33(5), 436-447. https://doi.org/10.1016/j.ijedudev.2012.09.009 [ Links ]
Van der Berg, S., 2015, 'What the Annual National Assessments can tell us about learning deficits over the education system and the school career', South African Journal of Childhood Education 5(2), 28-43. https://doi.org/10.4102/sajce.v5i2.389 [ Links ]
Van der Berg, S. & Shepherd, D., 2015, 'Continuous assessment and matriculation examination marks - An empirical examination', South African Journal of Childhood Education 5(2), 78-94. https://doi.org/10.4102/sajce.v5i2.391 [ Links ]
Vandeyar, S. & Killen, R., 2003, 'Has curriculum reform in South Africa really changed assessment practices, and what promise does the revised National Curriculum Statement hold?', Perspectives in Education 21(1), 119-132. [ Links ]
Yin, R.K., 2009, Case study research: Design and methods, Sage, Beverley Hills, CA.
 Correspondence:
Sarah Bansilal
Bansilals@ukzn.ac.za
Received: 20 Mar. 2016
Accepted: 03 Jan. 2017
Published: 30 Mar. 2017

