


Serviços Personalizados
Artigo
 Inglês (pdf)
 Artigo em XML
 Referências do artigo
Indicadores

Links relacionados
-
 Citado por Google
 -
 Similares em Google
Compartilhar

 Permalink
South African Journal of Childhood Education
versão On-line ISSN 2223-7682
versão impressa ISSN 2223-7674
SAJCE vol.5 no.2 Johannesburg Dez. 2015
Continuous assessment and matriculation examination marks - an empirical examination1
Debra Shepherd & Servaas van der Berg
University of Stellenbosch
ABSTRACT
This study analyses information and feedback from matriculation-level continuous assessment in the South African education system in 2005. Continuous assessment (CASS) at the time carried a 25% weight in the final matriculation (Grade 12) mark, and it provided feedback that affected examination preparation and effort. Weak assessment in schools sends wrong signals to learners, which may have important consequences for the way in which they approach the final examination. Moreover, similarly wrong signals earlier in the learners' school careers may also have affected their subject choice and career planning. This study compares CASS data to the externally assessed matric exam marks for a number of subjects. There are two signalling dimensions to inaccurate assessments: (i) inflated CASS marks can give learners a false sense of security and lead to diminished exam effort; and (ii) a weak correlation between CASS and exam marks could mean poor signalling in another dimension: relatively good learners may get relatively low CASS marks. Such low correlations indicate poor assessment reliability, as the examination and continuous assessment should both be testing mastery of the same national curriculum. The paper analyses the prevalence and magnitude of each of these dimensions of weak signalling in South African schools and draws disturbing conclusions for a large part of the school system.
Keywords: Economics of Education, assessment, asymmetric information, signalling, South Africa
To be technically sound, assessments must be both valid and reliable. An assessment is valid when it is used for the purposes for which it is designed [...] A reliable assessment provides test scores that consistently measure a learner's knowledge of what is being tested. Assessments used in standards-based systems should meet a third criteria [sic], alignment, or the degree to which the assessment adequately reflects the standards on which it is based.
Pearson Education n.d. (emphasis added)
Introduction
Continuous assessment (CASS) is an important part of the evaluation of South African learners at matriculation level and, during the period referred to in this study (around 2005), carried a 25% weight in the final matriculation mark. Matriculation results determine options for university entry, bursaries and career choice, as well as labour market prospects; hence this examination is an extremely high-stakes one. As CASS provides feedback to learners regarding their performance during the matric year, it is likely to influence their examination preparation and effort.
Continuous assessment provides learners with feedback about how well they have mastered the material (Nicol & Macfarlane-Dick 2006). In this article our concern is not with how CASS is used in teaching, but rather with demonstrating that weak CASS assessment can lead to undesirable consequences by sending wrong signals. Also, this paper makes clear that the information CASS provides about teacher assessment skills is of obvious importance for policy and for school leaders wishing to improve learning in schools. Perverse consequences arise when the feedback from continuous assessment does not correspond with the desired learning outcomes. Thus, for instance, CASS tasks set by a teacher may not support the outcomes set by the national curriculum standards. Weak assessment gives learners wrong signals that influence their learning strategies, examination effort and career planning. Moreover, weak assessment quality is likely to be even more common in lower grades, where it may already have exerted an influence on subject choice, career planning and even the decision of whether to persevere to matric.
This study evaluates the quality of school-based CASS compared to that of the externally moderated matriculation examination (which for present purposes will be regarded as the 'correct' assessment of learner performance)2 using data for a number of subjects for 2005. Unfortunately, later data sets containing both matriculation results and CASS have thus far not become available, but it is likely that patterns of assessment have not changed in any fundamental way. Alternative measures of assessment accuracy were used to determine to what extent CASS marks gave poor signals to learners as to their likely matriculation performance. Assessment accuracy refers to the exactness or precision of the measure; that is, how close it gets us to a true or known value of, for example, learner knowledge and performance. Whilst an assessment that is reliable may be useful for precise measurement of learner knowledge, validity is necessary for accurate measurement. Furthermore, a lack of reliability in an assessment limits the overall validity such that a wholly unreliable assessment tool can in no way be valid, and will therefore measure inaccurately.
Such an analysis illuminates two important questions. The first relates to the subject knowledge of teachers. Teachers with poor subject knowledge are likely to assess less accurately. Thus such an analysis could help the Department of Basic Education and provincial education departments to identify teachers who do not teach to the curriculum standard, whether due to poor subject knowledge or other reasons, and to take corrective action. Secondly, assessment marks inform matriculants of how well they are prepared for the examination in different subjects. Thus, a low signal-to-noise ratio (that is, high inaccuracy) in assessment can give learners inaccurate information about how to prepare, contributing to weak examination results.
The paper proceeds as follows: the next section shows how assessment accuracy is measured, what data were used, and discusses the methodology. The subsequent section compares marks nationally and then measures assessment accuracy at the school level, while the final section concludes the paper and offers some policy suggestions.
Measuring assessment accuracy
CASS marks are determined at school level, based on tasks that vary by teacher in terms of number, level of difficulty and marking accuracy. Thus such marks are less consistent than the externally set, marked and moderated matric exams, even though CASS marks are discussed by the teachers involved in educational clusters. Given the explicit standards and content set by the national curriculum, it should be possible to attain a fair degree of consistency in the assessments for each subject. In well-functioning schools, one would expect, in the terms of the opening quote of this paper, validity (tests being well designed to test curriculum knowledge); reliability (consistently measuring learner knowledge); and alignment of the CASS marks with the national standards.
There are two types of assessment inaccuracies, with different signalling dimensions:
- Assessment leniency (where CASS marks are much higher than exam marks): An inflated CASS mark gives learners a false sense of security.
- Low assessment reliability (where CASS and examination marks are weakly correlated): A poor correlation between the CASS and examination mark indicates that the former is also an unreliable indicator of the individual's relative ability compared to classmates in a particular subject. In such cases, signalling to learners is weak in another dimension: CASS marks do not act as a good predictor of relative examination marks.
Poor assessment performance in the CASS in either or both of these two dimensions (gaps or correlations) will be referred to as 'weak', 'poor' or 'inaccurate' assessment. The extent of each of these two dimensions of inaccurate signalling will be analysed by subject.
Reliability refers to the consistency of assessment scores (Moskal & Leydens 2000), which means "that the same person should get roughly the same score across multiple test administrations" (North Central Regional Technology in Education Consortium 2002). Differences in the averages (levels) between assessments are related to the alignment, or "degree to which the assessment accurately reflects the standard being measured" (Burger n.d.). Alignment in the standards of the examination and the CASS should ensure minimal gaps between these marks, as both should measure mastery of the same curriculum.
Umalusi moderation imposed a limit of a 10-percentage-point deviation between CASS and examination marks: where the average CASS mark for a subject in a school deviated by more than 10 marks from the exam mark, all CASS marks were adjusted to reduce the average gap to only 10 marks. This means that, on average, learners in leniently assessing schools gained at most 2.5 percentage points in the final matric mark in a subject relative to accurately assessing schools. However, poor reliability of continuous assessment may also benefit some candidates much more than others. To illustrate, even in a school where the average CASS and exam marks are perfectly aligned, lack of reliability in the CASS may lead to two candidates of similar ability and who perform similarly in the examination having a 20-percentage-point difference in CASS marks, a situation which is quite common in weakly assessing schools. If this 20% advantage was purely the result of lack of reliability of CASS assessment, the candidate with the better CASS mark would end up with a matric mark 5 percentage points higher than his or her equally deserving classmate. Where this affects passing or failing, or university entry, such differences have major consequences, but - unlike in the case of leniency - Umalusi is not in a position to correct for such unreliability.
The total data set consisted of all data for matric learners for 2005. At the learner level there was information on the raw scores (before adjustment) on school continuous assessment and the matric examinations of learners for each subject offered. At the school level, information regarding the province, quintile and sector (public or independent schools) was available. Learners for whom no information was available on either or both sets of marks (assessment and matric examination) were excluded, and school-level analysis based on fewer than fifteen pairs of observations were dropped. The final data set consisted of 5 968 schools, with on average eighty-seven candidates per school.
Correlations between assessment and matric examination marks were calculated for each of seven subjects (English First and Second Language, Mathematics, History, Biology, Geography and Physical Science), distinguishing where appropriate when subjects were taken at higher grade (HG) or standard grade (SG), as was still possible at the time. The correlation coefficient measures the strength and direction of the linear relationship between two variables and can take a value ranging between +1 (a positive linear relationship) and -1 (a negative linear relationship). A large and positive correlation between the CASS and exam marks of matriculants in a school indicates a close association between the two. Note that correlation in no way implies causation: a linear relationship between X and Y does not mean that X causes Y, or vice versa. A weak correlation suggests poor reliability of assessment, in the sense that the school's continuous assessment marks poorly match the matric examination marks.
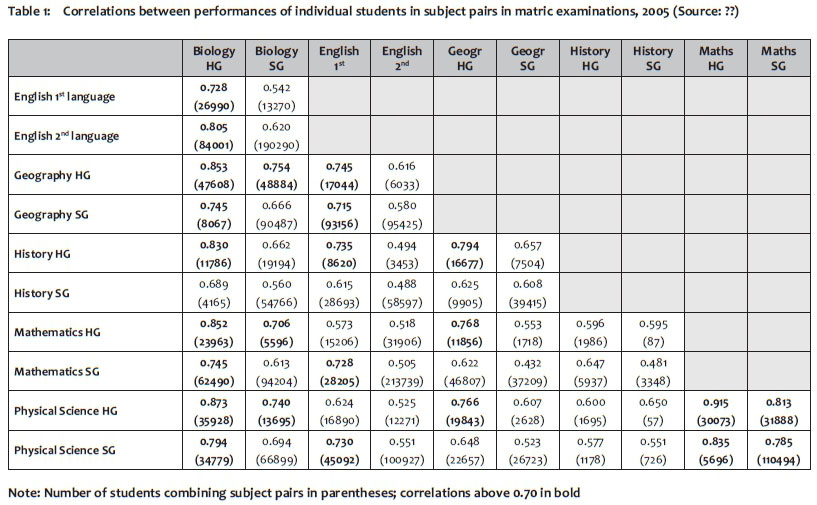
The literature offers no guidance as to what correlation value constitutes a strong, positive relationship between a school's CASS and examination marks. Cohen (1988) views a correlation of above 0.50 as strong in psychological research. For the minimum number of candidates considered per school (fifteen), a correlation of +0.513 implies 99% confidence that there is a significant relationship between the two sets of marks; that is, there is only a 1% probability that this correlation would occur by chance if CASS marks were generated randomly. Learner performance across different subjects offers another clue as to what an adequate correlation may be. The same latent trait -general cognitive ability - underlies both continuous assessment and the examination mark, and the two types of tests should test mastery of the same curriculum. One would thus expect a higher correlation for CASS and exam marks in the same subject than for assessments between unrelated subjects. Table 1 shows pair-wise correlations for learners combining different subjects. Even between such seemingly unrelated subjects as English Second Language and Mathematics SG, the correlation was 0.505. One would expect a far higher correlation between the CASS and the examination mark for the same subject, where knowledge of the same curriculum is tested.
In the light of the above, using a correlation coefficient as low as 0.60 to separate 'strong' from 'weaker' correlations, as will be done in part of this paper, is a relatively lax yardstick for assessment reliability. Far higher correlations should hold in a system that assesses well. Correlations between marks in the Annual National Assessment and the Western Cape Systemic Tests for 2012 generally show much higher correlations (see Van der Berg 2015 in this volume): these were 0.80, 0.85 and 0.90 for Mathematics, and 0.65, 0.74 and 0.75 for Language.
Individual CASS and examination marks
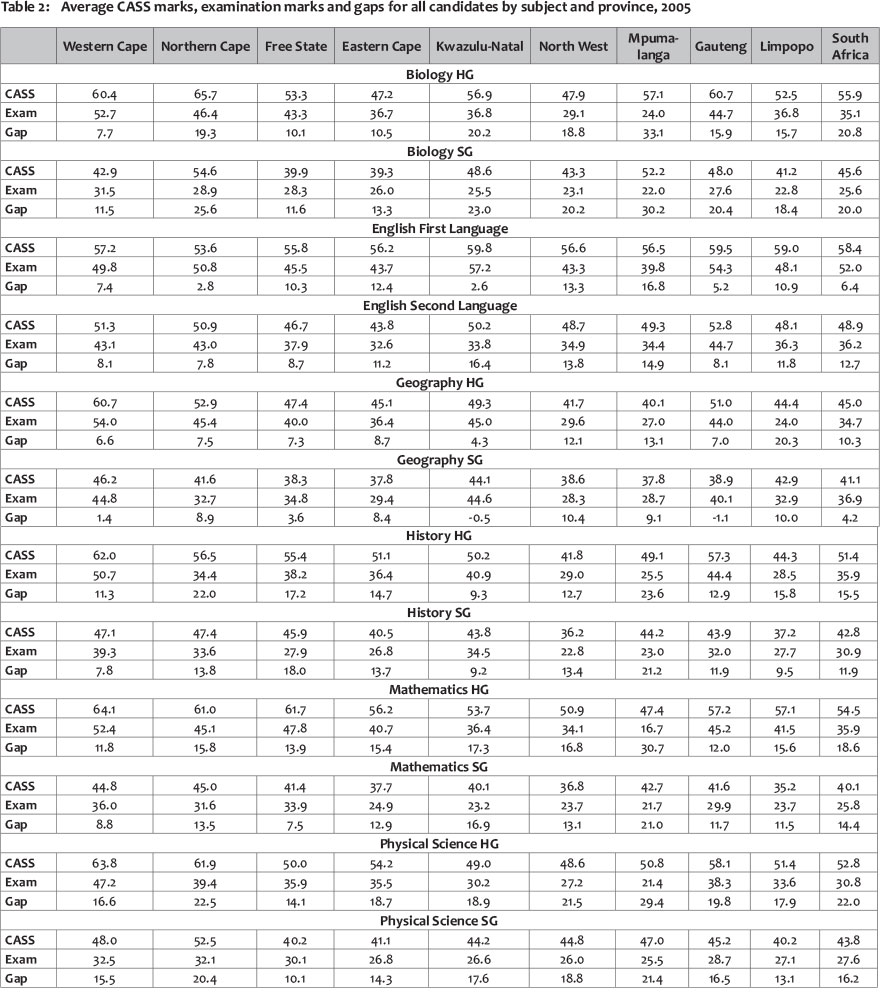
Table 2 summarises the CASS and examination marks of all matriculants. For every subject and in all provinces, the average CASS mark was consistently and substantially higher than the examination mark. The fact that the standard deviations of the examination marks (not shown) were usually larger than those of the CASS marks suggests that many teachers may have been 'playing it safe' - that is, giving similar marks to both high and low performances, perhaps to conceal uncertainty resulting from poor subject knowledge.
Gaps in most subjects were larger than 10 percentage points. In Mpumalanga, many subject gaps were in excess of 20 percentage points. The most extreme case was Mathematics HG in Mpumalanga, where the average CASS mark was 47% and the exam mark only 17%, leaving a gap of more than 30 percentage points. Considerable gaps were observed for most provinces in Biology and Physical Science, whereas gaps for Geography and English were smaller.
Over time one would expect the gap between the CASS and examination marks to close gradually, as teachers use feedback from previous exams to bring their continuous assessment more closely in line with the curriculum standards. However, between 2003 and 2005 gaps generally widened, providing evidence of an increasing disparity between what was being taught and assessed within the schools and what was being tested in the examinations. Moreover, given the restrictions applied where CASS marks deviate considerably from examination marks, the gaps are generally larger than could simply be explained by teachers 'gaming' the system to ensure their learners an advantage in the final matric mark.
Surprisingly, the gap for English (Second Language and especially First Language), traditionally regarded as a 'less exact discipline', was smaller and showed less variance than for Mathematics, usually regarded a 'more exact discipline'. This may reflect a higher level of consensus amongst English teachers about the standards to which learners should perform, or a more precisely specified curriculum. The large standard deviations in CASS for most other subjects point to an inconsistent understanding amongst teachers of the level of performance required of learners in these subjects: almost a quarter of candidates who had achieved 50% or above for a subject in CASS achieved less than 30% in the examination.
Table 3 shows that there were few subjects with both high correlations and a small gap between CASS and examination marks. One exception was English First Language, with a gap of only 6.4 percentage points and a high correlation (0.78). This could perhaps be attributed to the fact that this subject was taken by only a relatively small group of learners. However, English Second Language, taken by many learners, many of whom were from poor backgrounds, also had both a high correlation (0.69) and a small average gap (12.7 percentage points). It is not surprising that correlations for an exact discipline like Maths were very high in both Higher Grade and Standard Grade -but then, the gaps between the CASS and examination marks were unexpectedly wide. The weakest continuous assessments amongst the subjects investigated were in Biology (particularly SG) and Physical Science SG, although there were also serious problems of assessment in History SG, perhaps because the subject involves more interpretation, which weak teachers may not be able to assess well.

School level assessment
Thus far, analysis was confined to data at the individual level. In order to determine how good assessments were in individual schools and classrooms, it is necessary to aggregate within schools.3 The analysis in this section is at the level of the individual school, taking a simple average across schools; that is, not weighted by the number of candidates in each school. Essentially, the intention is to ascertain how accurately teachers assess. More than one teacher may have been involved in assessment in a school, but assessment across classes within the same school was likely to be relatively consistent compared to assessments across different schools. To derive meaningful data, the analysis is confined to cases where more than fifteen candidates from a school entered for examination in a subject.
Figure 1 shows that the smallest gaps between CASS and examination marks within schools were in Geography SG, followed by English First Language, which was also the subject with the highest average examination mark across schools. Large gaps occurred for some higher grade subjects (Science, Biology and Mathematics) and for Biology SG.
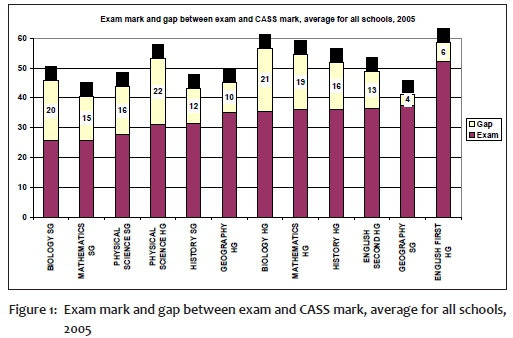
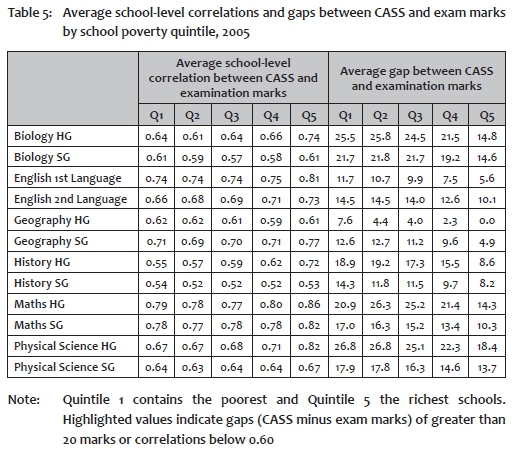
Table 4 shows average school-level correlations and gaps by subject and grade for 2005 by province, and Table 5 by school quintile (Q). Poor assessment values by either criterion (average gap above 20, or average school level correlation below 0.60) are highlighted.
There was a major problem in assessment in Mpumalanga, and the Northern Cape also showed relatively poor assessment in terms of these two criteria. This analysis also confirms that there were widespread problems in assessing accurately in Biology SG, and to an even greater extent with History SG across provinces: the very weak average correlations encountered here across schools in all provinces, implying poor reliability between CASS and examination marks, raise the suspicion that teacher subject knowledge may have been deficient in schools offering these two subjects, that the curriculum may have been under-specified, or that teachers may not have set assessment tasks that could serve as good preparation for the examination. Geography HG also bore further investigation.
Given clear divergences in the assessment accuracy of schools by province and by subject, it is interesting to know whether accuracy (both reliability and leniency) also differed by school poverty quintile. Table 5 shows that in most subjects, assessment accuracy differed little by either criterion (reliability and leniency) in the bottom three quintiles for all subjects, but was better by both criteria in the fourth and especially fifth quintiles, that is, in schools serving richer communities.
Provincial differentials in assessment reliability in English Second Language (as it was called at the time; now English First Additional Language) and Mathematics SG - the subjects with the highest enrolment of learners, and hence most assessed - were further investigated and the results are presented in Table 6. Again, in terms of reliability of assessment in English Second Language, Limpopo and Kwazulu-Natal schools fared the worst. The Northern Cape had a mere 4% of schools assessing unreliably in English Second Language. Two provinces were responsible for a substantial share of low assessment reliability: Kwazulu-Natal and Mpumalanga together accounted for more than half of the unreliably assessing schools in both subjects, with the Eastern Cape also comprising a substantial share at 18% in Maths SG. The share of these three provinces in poor assessment may be ascribed to both their relative sizes and the frequency of weak assessment.

The average assessment marks were extraordinarily high in some schools, even where assessment marks did correlate with exam marks. For example, for Biology SG, more than 200 schools out of 5 300 had assessment marks more than 40 percentage points above the examination mark. Yet even in these schools, more than a third had a correlation of 0.60 or higher between these two marks. Similar figures applied to other subjects. So it appeared that the tendency to give high assessment marks (leniency) was not necessarily always closely related to poor correlation with the examination mark (reliability). It appeared as if most teachers could rank learner performance moderately well, but gave extremely lenient assessment marks. This may point to a culture of setting marks too high in earlier grades in order to reduce failures or deflect parent protests.
Conclusion
Assessment provides important signals to learners that should assist them to prepare for examinations and make informed choices about career options, further studies and subject choice. Two measures of accuracy of continuous assessment were used and applied across a number of subjects, namely leniency in awarding CASS marks compared to examination marks and measured as the gap between these marks, and the reliability of CASS marks in terms of their correlation with examination marks.
Continuous assessment accuracy was weakest in terms of the great leniency of assessment in many schools (inflated CASS marks), although unreliable assessment was also a cause for concern in some cases. This requires targeted interventions. There was also evidence of a clear provincial hierarchy in terms of assessment accuracy. The bulk of inaccurately assessing schools were in Mpumalanga and Kwazulu-Natal, with the Eastern Cape also being a large contributor. The Western Cape and schools in the top and even the second quintiles of the socio-economic distribution assessed much better. Mathematics HG and SG were the best assessed subjects, with English First and Second Language following close behind. There was a larger share of poorly assessing schools in History than in any other subject.
Apart from the fact that weak continuous assessment in matric (and presumably also in earlier grades) sends wrong signals to learners and parents, resulting in inappropriate subject choices, career planning and examination preparation, there is a further issue that the authorities should take note of. With the 25% weighting given to CASS marks in matriculation at the time (2005) and the limit imposed by Umalusi of an average deviation of 10% either way between examination and CASS marks, differences in strategic behaviour between teachers or schools could have important consequences. Schools setting high standards in CASS in order to induce more intensive learning in preparation for the examination may place their candidates at a considerable disadvantage (of up to 5 percentage points) in the final matric mark relative to schools who persist with lenient assessment. In addition, candidates who are disadvantaged through poor reliability of assessment within a school also face a considerable disadvantage in the final matric mark.
However, thereis also a broader consideration. Differentials between CASS and exam marks did not result in feedback and improved assessment the following year (2006). It is disturbing to note that for most subjects these gaps had increased between 2003 and 2005, in some cases substantially so, yet teachers did not appear to be seriously re-evaluating their own assessment standards on the basis of feedback from the examinations, and thus the link between CASS and curriculum standards remained weak. Information from the examinations was not systematically used, nor in many cases even made available to schools by the education authorities, and thus no corrective feedback occurred. Information about weak signalling by teachers to learners can, ironically, also serve as feedback to teachers to improve their assessment practices. Moreover, this paper provides ample evidence that the information for such improved signalling to matric teachers exists within the education system. It simply needs to be used by policy makers.
From a policy perspective, what one would expect from the education authorities in response to the findings of this paper is that they systematically use the information obtained from CASS and examinations as a source of information in discussions with teachers and school leaders. In a system where there is very little opportunity to engage with teachers about the quality of their work, this offers an obvious opportunity. For school leaders, such information provides an indication of the quality of the work that teachers are doing that can be productively used in interaction with them. However, the discrepancy between CASS and exam marks also provides an indication that there is much that is not well in terms of teachers' assessment skills -and matric is likely to be only the tip of the iceberg.
Acknowledgements
The authors wish to thank Tim Dunn and Emmanuel Sibanda for advice on the quantitative methodologies used in the study described here; Derek Yu for assistance with data analysis; and various members of Umalusi's Research Committee for useful comments.
References
Burger, D. n.d. Using standards-led policy to align assessment and accountability systems. Pacific Resources for Education and Learning. Retrieved from http://www.prel.org/products/re_/standards-led.htm (accessed 12 February 2008).
Cohen, J. 1988. Statistical power analysis for the behavioral sciences. 2nd Edition. Hillsdale, NJ: Lawrence Erlbaum Associates. [ Links ]
Moskal, B.M. & Leydens, J.A. 2000. Scoring rubric development: validity and reliability. Practical Assessment, Research & Evaluation, 7(10). Retrieved from http://findarticles.com/p/articles/mi_qa3886/is_200207/ai_n9121811/pg_1 (accessed 11 February 2008). [ Links ]
Nicol, D. & Macfarlane-Dick, D. 2006. Formative assessment and self-regulated learning: a model and seven principles of good feedback practice. Studies in Higher Education, 31(2):199-216. [ Links ]
North Central Regional Technology in Education Consortium. 2002. Glossary of Education Terms and Acronyms. Retrieved from http://www.ncrel.org/sdrs/areas/misc/glossary.htm (accessed 12 February 2008).
Pearson Education. n.d. Assessment: Reliability/Validity. Retrieved from http://www.ecs.org/html/issue.asp?issueid=12&subIssueID=123 (accessed 12 February 2008).
Van der Berg, S. & Shepherd, D. 2008. Signalling performance: An analysis of continuous assessment and matriculation examination marks in South African schools. Pretoria: Umalusi. [ Links ]
Van der Berg, S. & Shepherd, D. 2010. Signalling performance: Continuous assessment and matriculation examination marks in South African schools. Stellenbosch Working Paper Series No 28/2010. Stellenbosch: University of Stellenbosch. [ Links ]
Van der Berg, S. 2015. What the Annual National Assessments can tell us about learning deficits over the education system and the school career year. South African Journal of Childhood Education, 5(2). [ Links ]
* Email address: svdb@sun.ac.za
1 This paper is based on a report to Umalusi (Van der Berg & Shepherd 2008) and a slightly amended Working Paper version (Van der Berg & Shepherd 2010). An earlier version was presented to the 5Conference of the Association of Commonwealth Examinations and Accreditation Bodies, March 2008, Pretoria.
2 This ignores the possibility of inconsistent examination marks or that the examination marks may in part be determined by responses to assessment marks. Learners' performance can also fluctuate around their 'correct' level when they perform better or worse than their usual performance on a particular test or examination. Such 'noise' (or stochastic variation) is normal in data of this nature; it is the systematic component of deviations from 'normal' levels that concern us here.
3 Strictly speaking, this analysis is at the level of examination centres, which may also have contained some private candidates. However, only a small percentage of all candidates were private candidates, thus it is not very problematic to equate exam centres with schools.

