


Servicios Personalizados
Articulo
 Inglés (pdf)
 Articulo en XML
 Referencias del artículo
Indicadores

Links relacionados
-
 Citado por Google
 -
 Similares en Google
Compartir

 Permalink
South African Journal of Childhood Education
versión On-line ISSN 2223-7682
versión impresa ISSN 2223-7674
SAJCE vol.5 no.2 Johannesburg dic. 2015
What the Annual National Assessments can tell us about learning deficits over the education system and the school career
Servaas van der Berg*
University of Stellenbosch
ABSTRACT
Much hope is placed on education systems to reduce socio-economic learning gaps. However, in South Africa, uneven functioning of the school system widens learning gaps. This paper analyses education performance using ANA data. Weak calibration and inter-temporal or inter-grade comparability of ANA test scores limit their usefulness for measuring learning gains. However, relative performance provides meaningful information on learning gaps and deficits. A reference group that is roughly on track to achieve the TIMSS average is used to estimate the performance required in each grade to perform at TIMSS' low international benchmark. By Grade 4, patterns across quintiles of on-track performance approximate matric exemption patterns. Viewed differently, academic and labour market prospects may be bleak for children who are no longer on track. Improvement in outcomes requires greater emphasis on the Foundation Phase or earlier, before learning deficits have grown to the extreme levels observed by the middle of primary school. This statement is true whether deficits arise from weak early instruction, or simply because a disadvantaged home environment requires early remedial action. The emphasis on the early grades that this analysis of the ANAs suggests is contrary to the conclusions drawn from the ANA results by policy makers that weak test scores in Mathematics in Grade 9 require major interventions in that grade.
Keywords: socio-economic gaps, learning gaps, Annual National Assessments
Introduction
It is well known that socio-economic gaps in cognitive outcomes are established, widen and become more intractable even before children enter school. Throughout the world, much hope is often placed on the school system to reduce learning gaps and develop the potential of all children irrespective of their home background. However, even in many developed countries such an expectation is often not realised, and Feinstein and Duckworth (2006:1) suggest that
[...] a failure of family and school contexts to build on the early cognitive development of bright children from low SES groups [...] may be a crucial and under-recognised difference between children from disadvantaged and advantaged backgrounds and a key reason for social immobility.
In South Africa, the uneven functioning of the school system further acts to widen learning gaps (Spaull & Kotzé 2015).
The Annual National Assessments (ANAs),introduced nationally from 2011 (although full data were only captured from 2012), offers the possibility to assess student performance across the grades tested. Problems related to the calibration and inter-temporal and inter-grade comparability of ANA test scores limit their usefulness for measuring learning gains. However, relative performance in these tests provides meaningful information on the evolution of learning gaps between children. In this paper, ANA data are used to analyse learning gaps between learners in poor schools and those in less poor schools, and between learners in different parts of the school system. ANA data should make it possible to track the performance of a substantial number of learners in the primary grades between 2012 and 2014 (that is, in three assessments), though for practical reasons this tracking could only be done for two assessments (2012 and 2013) in this paper. Using the fact that different cohorts of children can be tracked (for example, the progression between any two adjacent grades can be analysed for different cohorts), the analysis can be extended and is less sensitive to weak assessment instruments that may have been used in a particular year.
The results of the analysis of performance across grades show a clear learning gap between children from advantaged and non-advantaged backgrounds that is already exceedingly wide by Grade 4. By this grade, the pattern of performance across different parts of the school system appears quite similar to that for university exemptions in Grade 12, intimating that potential access to university, with all the advantages that such access confers in the labour market, is already largely predetermined by Grade 4. This learning gap has immense implications for where the learning effort should be focused: dealing with poor performance in Mathematics in Grade 9, as policy interventions informed by ANA currently attempt to do, is taking the wrong message from ANA.
Background: What we know about learning deficits in South Africa
The past decade and more has seen a rapid expansion of our knowledge of learning performance in South African schools. Thorough analyses of international evaluation data from the Southern and Eastern Africa Consortium for Monitoring Educational Quality (SACMEQ); the Trends in International Mathematics and Science Study (TIMSS); and the Progress in International Reading Literacy Study (PIRLS and prePIRLS) have contributed greatly to this knowledge expansion. So too have systemic evaluations that have been undertaken from time to time, as well as some major school-based evaluations, in particular the National School Effectiveness Study (Taylor, Van der Berg & Mabogoane 2013). Analyses at a system level of the existing evidence had already given a stark indication of the deficits of our school system a decade ago (Taylor, Muller & Vinjevold 2003), while microevidence has started to build around classroom practices in which low levels of curriculum coverage, slow microand macropacing, and low levels of cognitive demand are prominent features (see, for example, Reeves 2005). Evaluations of school interventions showed little signs of success (Schollar 2015).
The introduction of ANA was a new feature in this landscape, potentially offering the possibility of information on student performance in all the grades covered, namely grades 1 to 6 and grade 9. ANA was administered to all students in Mathematics and Reading. The main part of the ANA tests, referred to as Universal ANA, was administered by schools themselves.
There has been some controversy about the ANA tests, for differing reasons. Some educationists object to such testing on various grounds. In the abstract to an unpublished paper, Hoadley & Muller (2014:1) state that
[t]ests and testing have come under almost universal attack recently from critical educational analysts of a sociological persuasion. The journals on educational policy teem with papers that put tests and testing in the dock for carrying managerialist ideologies, fostering unhealthy competition, and inadvertently promoting deformative pedagogies like 'teaching to the test'. The impression created by some of this work is that tests are a form of audit and control thought up by regulatory agencies that work on education from the outside, mould it in a particular way, and leave the participants - teachers, learners and their parents - worse off than they were before.
Hoadley and Muller (2014) then set about providing an excellent argument as to the deficiencies of such views and why such testing is potentially useful and in the interests of children and education.
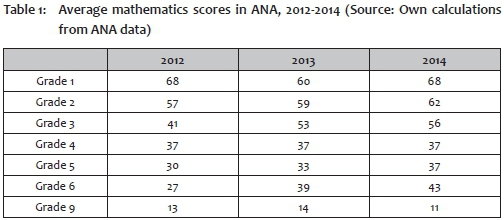
Still others have serious reservations about the quality of the tests themselves, or about how well they are calibrated. Test results vary alarmingly across time. Table 1 sets out the average national performance in the ANA tests in Mathematics for 2012 to 2014 by grade. Such large fluctuations in scores reduce the usefulness of the ANA tests, as they are too large to say anything about improved learning. Examples are the fluctuations across the three years in Grade 1 (68%, 60%, 68%), or the strong rises in performance in Grade 3 (from 41% to 56%) and Grade 6 (27% to 43%) in only two years.
Further analysis of the results by the national Department of Basic Education (DBE) (RSA DBE 2014:9; not shown in this table) shows that the proportion of learners achieving 50% or more in Grade 3 ANA mathematics tests jumped from 36% in 2012 to 59% the next year and 65% in 2014; in Grade 6 the jump was from 11% to 27% and then to 35%. Such increases simply cannot credibly be regarded as improvements in performance and speak to a lower test standard being introduced in later years. The DBE has at least acknowledged this problem, euphemistically stating that "the results may not be perfectly comparable across years as the difficulty and composition of the tests may not be identical from year to year" (ibid:36). More importantly, the DBE has also initiated some work on developing anchor items, to be used in improving the calibration of test difficulty over years:
In 2014, after completion of the ANA tests, sets of anchor items were administered to a small sample of learners in each province. In Grades 6 and 9, in 10 schools per province, items were administered to 25 sampled learners after they wrote the regular ANA test. These confidential tests and items will be used to provide valid comparisons across years. The findings of this pilot study will be considered when developing systemic assessment instruments.
RSA DBE 2014:36
Clearly it will take some time before these measures will lead to substantial strengthening of comparability, but at least there is gradual improvement being made to the system.
The problems of calibration of the ANA tests apply not only across years, but also across grades. Whereas good technical work using anchor items and Item Response Theory can in principle be used to fix calibration across years, no similar technique applies for setting tests to be of equal difficulty relative to curriculum standards across different grades. Again, Table 1 provides some information about the type of problems concerned: the drop in performance in Mathematics between Grades 3 and 4 - from 56% to 37% in 2014 - probably says little about how learners are keeping pace with curriculum standards over the different grades. The same probably applies to the rise in the average to 43% in Grade 6 and then the sharp fall to 11% in Grade 9. It is this last figure that led the Minister and the DBE to institute some drastic measures to deal with what is regarded as the weak quality of teaching Mathematics in Grade 9; however, it is far more likely that the problems in Grade 9 simply reflect what has happened earlier in the system.
Some fear that ANA results may be manipulated, because in some provinces they have been used, or at least are perceived to be used, for accountability purposes. According to Figlio (2003:16), in the American context,
[a]ccountability systems, no matter how well designed, will have many incentives embedded within them for schools to 'game the system'. The successful design of accountability systems hinges on the identification and closure of as many of these loopholes as possible. However, the likelihood that schools will find other mechanisms through which they can inflate their observed test performance for the purposes of accountability suggests that all aggregate test scores should be taken with a grain of salt, and not viewed as perfect indicators of school productivity. Other indicators of school productivity, such as gain scores, that are harder to 'game' may provide fewer incentives for schools to influence test scores through methods other than bona fide school improvement.
Evidence gathered within the DBE indicates that manipulation may be worryingly high, yet it is not yet widespread enough to discredit the marks generally. However, this problem may grow if ANA testing is perceived to be about holding schools and teachers accountable, rather than using them for diagnostic purposes.
One way of determining how pervasive cheating is in the ANAs is to compare ANA with the Systemic Evaluations in the Western Cape, which are externally administered and moderated in Grades 3, 6 and 9. It was possible to match a substantial number of students in these two tests in Grades 3 and 6, and Table 2 shows very high correlations in marks between the two tests for Reading (correlation coefficient of 0.74 for Grade 6 and 0.75 for Grade 8) and exceedingly high correlations for Mathematics (correlations 0.87 and 0.91). These high correlations do indicate that the ANAs, at least in these two grades, are measuring the same underlying trait as the Systemic Evaluation. It would also seem that there cannot be much manipulation of marks and that students are taking both tests seriously, otherwise such high correlations would have been impossible. If the externally administered Systemic Evaluations are more often used in the Western Cape for accountability purposes, it is of course possible that this province may experience less manipulation of ANA tests than some others.
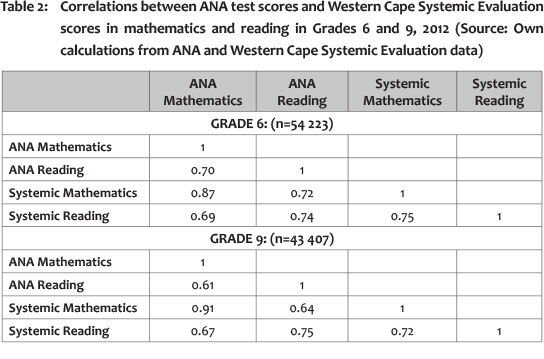
The correlations between the Mathematics and Reading scores of learners in Grades 3 and 6 in the Systemic Evaluation (0.75 and 0.72) are somewhat lower in ANA (at 0.70 and 0.61). Table 3 provides a similar perspective, but this time for all the ANA data that could be matched. Again, at a national level, and except for Grade 9, cross-subject correlations range between 0.66 and 0.74 in 2012, and 0.65 and 0.71 in 2013. The lower correlations at Grade 9 level may be the result of children's aptitudes for or specialisation in particular subjects becoming more pronounced in higher grades, thus reducing inter-subject correlations. On the other hand, it may also be that the very low marks in Mathematics may lead to a situation where Grade 9 Maths marks in ANA contain little signal and much noise. If the latter were the case, however, one would have expected a far lower correlation between the ANA and Systemic marks in Grade 9 Mathematics than is reflected in Table 2.
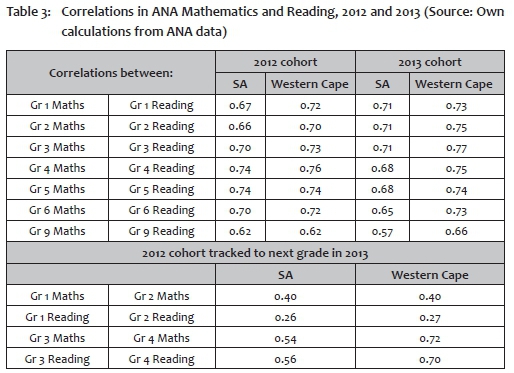
We return to the bottom panel of Table 3 later in the paper.
Methodology
If the ANA tests are poorly calibrated across grades, it makes it difficult to use them directly to compare performance in different grades. Yet then it should still be possible to use the ANA results to analyse the performance of students relative to others. Relative performance in these tests provides meaningful information on the level and potentially also the evolution over grades of learning gaps between children.
A first look at relative performance is found in Table 4. It shows the distribution across quintiles of the top 20% of performers in each grade. A slightly lower proportion than 20% of the entering cohort eventually obtain university exemption (now formally referred to as Bachelor's passes) in the matric examination; that distribution is also shown in the table, as is the distribution of the population of students that participated in the ANA tests in Grade 1 and 9.1 The population share of the top two quintiles (Quintiles 4 and 5) is around 30%, yet their share of the university exemptions achieved is 51%, showing how skewed the distribution of learning outcomes is across the socioeconomic spectrum. In contrast, Quintile 1 schools contain a quarter of students, yet achieve only 13% of university exemptions.
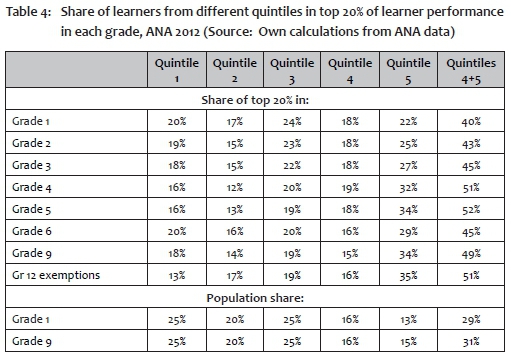
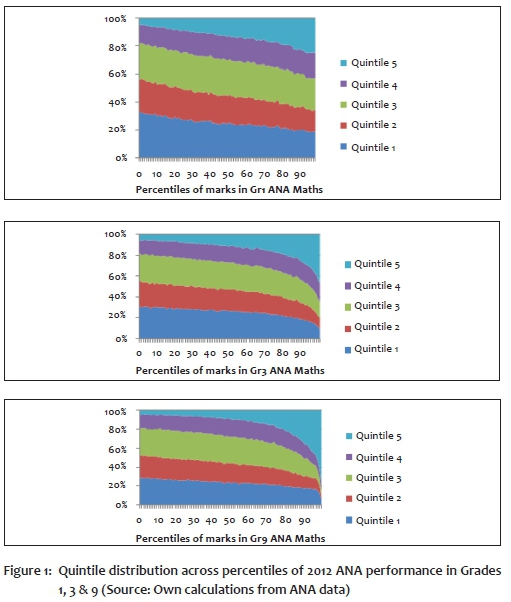
It is instructive to investigate how the shares of quintiles vary across the grades. Table 4 presents one perspective, but a fuller picture is presented in the three panels of Figure 1. Figure 1a shows the distribution across the percentiles of student performance in Grade 1, Figure 1b the distribution in Grade 3, and Figure 1c the distribution in Grade 6. It is already apparent in Grade 3 that the quintile distribution across performance percentiles appears more similar to the distribution in Grade 9 than the one in Grade 1: the bulk of the very high performers in Grade 3 and beyond are concentrated in Quintile 4 and especially Quintile 5 schools, as Table 4 also showed.
However, these distributions do not yet fully reflect the extent of the socio-economic differentials in outcomes in the school system. There are also large numbers of repeaters in the system, many of whom start dropping out in Grade 9 and especially Grade 10. In Grade 1, only 15% of students who wrote the ANA tests were one or more years overaged; by Grade 6 that number had risen to 41% (and 51% in Quintile 1 schools), and by Grade 9 to 54% for all quintiles (64%, 61% and 56% in the lowest three quintiles, and a surprisingly high 49% in Quintile 4 and 31% in Quintile 5). It is an indictment of the system that, despite the fact that by Grade 9 more than half the learners are overaged (largely due to repetition, rather than starting late), the levels of cognitive performance are still as weak as international tests tell. So it would be useful to measure performance in a way that also is sensitive to how many have fallen behind.
The methodology used here to deal with this matter makes use of a reference group within the South African student body that can be tracked over time to reflect how many learners in a particular grade are on track relative to that reference group in terms of both their ANA performance and not being overaged. In order to determine the reference group, results from the TIMSS Grade 9 assessment are considered.
Using as a reference group the performance of white and Indian children in the school system that are of the appropriate age for their grade, it is possible to get a broad assessment of the level of performance of all students writing the tests. Children from these two groups perform roughly at the TIMSS average in mathematics (adjusting for the fact that this test is administered in South Africa at the Grade 9 rather than the Grade 8 level, as in other testing countries).2 The implication is that the reference group is at about the same performance level as countries such the United Kingdom, Denmark, Australia and New Zealand, to name a few. The low international benchmark in TIMSS is about one standard deviation below the performance of this South African reference group. Thus it is possible to use a level of one standard deviation below the performance of the reference group as an approximation of performance at the low international benchmark level, even in earlier grades. It then becomes possible to utilise the cross-section results in ANA 2012 as a reflection of learning trajectories. All learners who are not overaged and who perform at or above the low international benchmark are classified as being on track. To put this benchmark in perspective, for the Grade 8 tests, «learners at the low international benchmark [...] have a basic knowledge of whole numbers, decimals, operations and basic graphs" (Reddy, Zuze, Visser et al 2015:4-5). This is thus not an onerous benchmark.
The results are instructive (Figure 2). Using the national school quintiles as a broad reflection of performance by SES group, one can see that the proportion of learners that are on track decreases sharply across the grades, especially for those in the lower quintiles (that is, attending poorer schools). By Grade 4, most learners are no longer on track, and the deficit grows only a little more in subsequent grades. It appears that by Grade 4, the damage has been done.
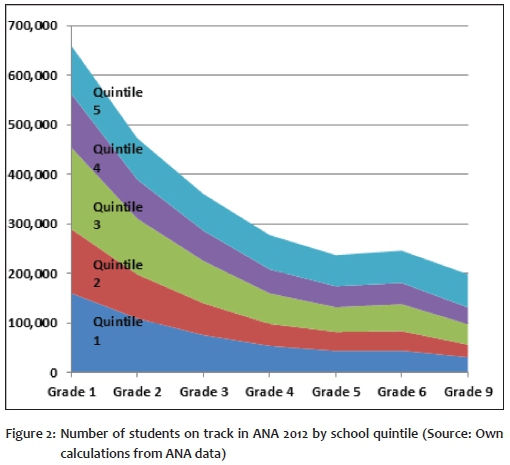
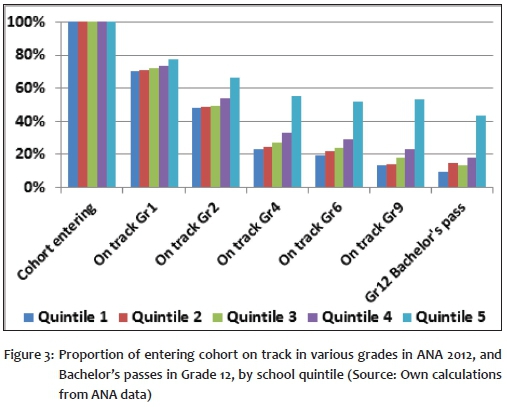
Figure 3 shows the same results in a slightly different format, but also shows on the same scale the proportion of the cohort achieving a Bachelor's pass in matric (or university exemption, as it was earlier known) - that is, those who perform well enough to be able to enter university. By Grade 4, the pattern of performance across different parts of the school system appears quite similar to that for university exemptions in Grade 12, intimating that potential access to university, with all the advantages that such access confers in the labour market, is already largely predetermined by Grade 4. It appears that the flat learning trajectories experienced by children attending poor schools doom their chances of success in matric (at least at the Bachelor's level) and therefore also dim their prospects for university studies and success in the labour market.
Are these results consistent across years?
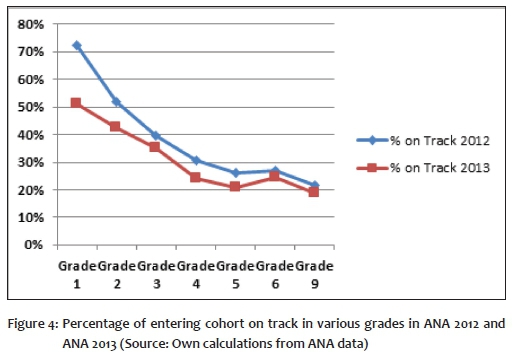
Due to data limitations it has only been possible to undertake the analysis for 2012 and 2013. Yet there are interesting and important differences between the results from these two years. Figure 4 shows the proportion of the entering cohort in Grade 1 that is on track at different grades in ANA 2012 and ANA 2013. Clearly, at least, the pattern of performance across the years has become flatter, with a slower drop over the early grades (see Figure 4), and a slight evening out in Grade 5. The former is consistent with a view that the early grade deficit in Grade 1 was under-captured in 2012. What is clear, though, is that both lines in Figure 2 point to large learning deficits that have left their mark by the middle of the primary school years. And for most children, catching up to again get on track is not a realistic prospect.
Concerns about ANA tests at lower grades
It is well known that South African schools tend to be relatively homogeneous in terms of educational outcomes, and that outcomes vary greatly across schools. One measure that reflects this pattern is the intra-class correlation coefficient, or rho value, which reflects the proportion of overall variance in scores; that is, variance between schools rather than variance within schools. This value ranges between 0 and 1: if all schools were completely homogeneous and all variance was between schools, this ratio would be 1; if all the variance was within schools and schools performed on average exactly the same, the value would be 0. To put such numbers in perspective, in SACMEQ II rho values for mathematics scores ranged between 0.08 for the Seychelles to 0.65 for Uganda, with South Africa's 0.64 at the high end (Van der Berg 2006:23-4; Table 1). Zopluoglu (2012) ranks countries in broad groupings according to the rho values for Grade 8 tests based on Pisa and TIMSS, and places South Africa in the highest group, namely that with values above 0.50.
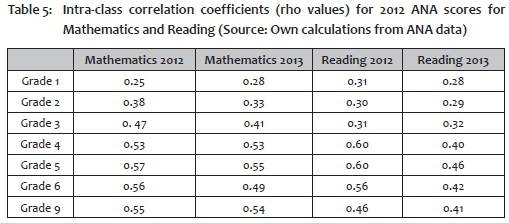
If weak quality of schooling is a major factor in many schools and affects the growth of learning gaps, one would expect the intra-class correlation coefficient to increase across the grades. Such growth is indeed what one sees in Table 5, which shows the rho values for 2012 and 2013. These values are very low for Grade 1 (between 0.25 and 0.31), but then rise to quite high levels by Grade 5. Generally speaking, the values seem to be lower in reading than in mathematics, perhaps because this latter subject reflects the learning differentials between good and weak schools even more so than does reading, though the jump in the reading differentials in Grade 4 are not surprising, given the changes in language of learning and teaching taking place in most schools at this level.
Yet it is possible that what the low intra-class correlation coefficients in Grade 1 - and to some extent also in Grade 2 - show are not caused by smaller learning gaps between schools, but by a test that is less able to differentiate at this level. One of the concerns about ANA is the quality of the tests, particularly in lower grades. Though some of these concerns relate to the use of these tests for diagnostic purposes and would not necessarily be equally important in distinguishing relative performance differentials as is done in this paper, it would be worrying if the test was not really able to differentiate between good and weak performance.
There is no way to tell from the information thus far provided whether the weak ability of the Grade 1 assessment to differentiate might be a particular concern; hence we turn to other ways of investigating this. One possibility is to track the same students across years to investigate their performance in two consecutive ANA tests for successive grades. Such tracking requires linking students in ANA across these grades. This linking first allows one to investigate whether those who failed Grade 1 performed significantly worse in ANA than those who passed. This is indeed the case, and a kernel density distribution of those who passed and those who failed shows two very distinct curves (not shown in this paper). Such dualism provides some support for the view that the ANA tests measure the same factors considered by teachers and schools when deciding to hold children back in Grade 1. Next, it is possible to consider the correlation between children's scores in Grade 1 and Grade 2, for those who could be matched and who passed Grade 1 in 2012. The second panel of Table 3 shows this correlation. Interestingly, the correlation is higher, though not substantially so, for mathematics (0.40) than for reading (0.26), with the Western Cape value, provided for comparison purposes, almost identical. However, these values rise considerably when we investigate progression from Grade 3 to Grade 4. This rise provides some evidence that the ANA measures in Grade 1 (and perhaps also Grade 2) should be used circumspectly, and will therefore also influence our interpretations of the findings from this research.
From the data at our disposal it is not possible to ascertain whether the Grade 1 test results of 2013 were more closely correlated with subsequent performance in Grade 2 than that of the previous year. Thus it is not possible to tell whether the flatter graph in Figure 4 for 2013 also coincided with a better Grade 1 test. We have too little evidence to choose between the 2012 and 2013 on-track lines in Figure 4. It is possible, though, that the steeper one of the two, that for 2012, could be the result of inflating Grade 1 performance due to a test that differentiated too poorly between better and weaker performers, thus exaggerating the numbers on track in Grade 1 as well as the steepness of the drop in on-track proportions at higher grades.
The fact that the two graphs tend to converge towards the mid-primary school ages increases the confidence that the main phenomenon that we observe in the ANA data - small numbers on track at higher grades - is a reality.
Some tentative conclusions and policy implications
The analysis of the ANA data confirms the findings of many international and indeed also domestic assessments which have been undertaken, namely that South African school children perform weakly in terms of cognitive outcomes. In particular, the ANA data have been used to show that the performance of children is already below an approximation of the low international benchmark of TIMSS as early as Grade 3 or Grade 4. The pattern across quintiles of students who are on track (above the low international benchmark and not overaged) is remarkably similar in shape, and similar in magnitude, to that of students who achieve a university exemption (Bachelor's pass) in Grade 12. This similarity provides suggestive evidence that for most students academic success in terms of passing matric well and potentially obtaining a university degree - and the benefits that such a degree confers in the labour market - is already largely unattainable by the time they reach the end of the Foundation Phase. Given weaknesses in the ANA as a measurement device in the earliest grades, it is not clear whether a large part of the learning deficit may already exist in the earliest grades, or whether it grows quickly in these early grades.
The policy message is simple and stark: for most children, learning deficits are already so substantial by the middle of primary school that many doors have already closed for them. Whilst efforts to ameliorate these deficits at higher levels are important and must continue for the sake of those who may still benefit from them, the greatest effort is required in the early school years, if not before. That is where the greatest policy challenge lies in terms of reducing the deficits that mainly children from poorer communities face in our schooling system. This holds true whether deficits arise from weak early instruction or simply because a disadvantaged home environment requires early remedial action. The conclusion that the emphasis should fall on the early grades is contrary to the conclusions drawn from the ANA results by policy makers, namely that weak test scores in mathematics in Grade 9 require major interventions mainly in that grade.
What is also clearly required is betterinformation on the performance and learning trajectories of young children. ANA has been successful in a number of ways - not least as a massive logistical exercise undertaken relatively successfully - and it is important to build on those successes and further develop ANA as a measuring instrument. However, another instrument is also needed, such as a panel survey of children in the Foundation Phase, with good retrospective questions about early childhood development and careful monitoring and assessment of learning outcomes, to track children's cognitive development during the first few years of school (and preferably even starting before children enter school). Such an instrument would offer greater insight into the roles of school and home during those crucial early years, something that ANA could only begin to suggest.
References
Feinstein, L. & Duckworth, K. 2006. Development in the early years: Its importance for school performance and adult outcomes. Wider Benefits of Learning Research Report 20. London, UK: Institute of Education. [ Links ]
Figlio, D.N. 2003. Testing, crime and punishment. University of Florida and the National Bureau of Economic Research (NBER). Retrieved from http://bear.warrington.ufl.edu/figlio/crime.pdf (accessed 1 January 2014).
Hoadley, U. & Muller, J. 2014. Testing, testing: Investigating the epistemic potential of systemic tests. Mimeograph. Cape Town: University of Cape Town. [ Links ]
HSRC (Human Sciences Research Council). 2014. Towards equity and excellence: Highlights from TIMSS 2011: The South African perspective. Pretoria: HSRC [ Links ]
Reddy, V., Zuze, T.L., Visser, M., Winnaar, L., Juan, A., Prinsloo, C.H., Arends, F. & Rogers, S. 2015. Beyond benchmarks: What twenty years of TIMSS data tell us about South African education. Pretoria: HSRC [ Links ]
Reeves, C. 2005. The effect of 'Opportunity to Learn' and classroom pedagogy on mathematics achievement in schools serving low socio-economic status communities in the Cape Peninsula. Unpublished PhD thesis. Cape Town: University of Cape Town. [ Links ]
RSA DBE (Republic of South Africa. Department of Basic Education). 2014. Annual National Assessment 2014: Report on the ANA of 2013. Pretoria: Department of Basic Education. [ Links ]
RSA DBE. 2015. South African Schools Act, 1996 (Act No 84 of 1996): Amended National Norms and Standards for school funding. Government Notice 17/2015, 16 January. Retrieved from http://www.gov.za/sites/www.gov.za/files/38397_gon17.pdf (accessed 15 November 2015).
Schollar, E. 2015. The Primary Mathematics Research Project: 2004-2012. An evidence-based programme of research into understanding and improving the outcomes of mathematical education in South African primary schools. Unpublished PhD Thesis. Cape Town: University of Cape Town. [ Links ]
Spaull, N. & Kotzé, J. 2015. Starting behind and staying behind in South Africa: The case of insurmountable learning deficits in Mathematics. International Journal of Educational Development, 14:13-24. [ Links ]
Spaull, N. 2011. A preliminary analysis of SACMEQ III. Stellenbosch Economic Working Paper Series No WP11/2011. Stellenbosch: Department of Economics, Stellenbosch University. [ Links ]
Taylor, N., Muller, J. & Vinjevold, P. 2003. Getting schools working. Cape Town: Pearson. [ Links ]
Taylor, N., Van der Berg, S. & Mabogoane, T. 2013. Creating effective schools. Cape Town: Pearson. [ Links ]
Van der Berg, S. 2006. How effective are poor schools? Poverty and educational outcomes in South Africa. Stellenbosch Economic Working Paper Series No WP06/2006. Stellenbosch: Department of Economics, Stellenbosch University. [ Links ]
Zopluoglu, C. 2012. A cross-national comparison of intra-class correlation coefficient in educational achievement outcomes. Journal of Measurement and Evaluation in Education and Psychology, 3(1):242-278. [ Links ]
* Email address: svdb@sun.ac.za
1 Quintiles are usually equal-sized groups, each one-fifth of the population. However, the school 'quintiles' are not really quintiles, as they vary in size, with Quintile 5 containing the fewest learners. In resource allocation (the Norms and Standards [RSA DBE 2015]), poorer schools are favoured, thus schools clamour to be classified in lower quintiles. Despite this, and some misclassification of schools due to weak information, the quintile groupings are still useful, as they broadly reflect socio-economic status and are well correlated with student SES and learning outcomes, as will become apparent to some degree in this paper.
2 South African white and Indian students in Grade 9 perform at about the international TIMSS average for Grade 8 (HSRC 2014:9; personal communication with Vijay Reddy). However, if one only considers those students in this reference group that are not overaged, their performance (based on the ANA results) is about 30% of a standard deviation higher; that is, approximately one year of schooling. This means that this demographic reference group, if taken to be only those students from these two population groups that are of appropriate age, performs roughly at the same level as the TIMSS set point.

