


Services on Demand
Article
 English (pdf)
 Article in xml format
 Article references
Indicators

Related links
-
 Cited by Google
 -
 Similars in Google
Share

 Permalink
South African Journal of Childhood Education
On-line version ISSN 2223-7682
Print version ISSN 2223-7674
SAJCE vol.4 n.3 Johannesburg 2014
ARTICLES
'Minding the gap?' A national foundation phase teacher supply and demand analysis: 2012-2020
Whitfield Green*; Michael Adendorff; Bongekile Mathebula
Department of Higher Education and Training
ABSTRACT
This paper explores the extent to which foundation phase teacher supply meets demand in South Africa, against a backdrop of considerable change in an education system endeavouring to fulfil the needs of a 21st century society while still battling with significant inequalities in the distribution of skills. The primary purpose of the paper is to use recently sourced teacher education data from a range of national databases to determine to what extent state-led interventions are assisting to meet the foundation phase teacher supply and demand challenge. The data, as well as the more qualitative aspects of their context, are analysed at the macro (national) level to present a more nuanced picture of foundation phase teacher supply and demand. The study attempts to move beyond simply basing an analysis of supply and demand on teacher attrition, and takes into account multiple variables that should be considered in supply and demand planning. It also goes beyond simply matching supply to demand in the most recent year for which data is available, to forecasting a future scenario which will need to be planned for. The paper concludes by suggesting steps that should be taken to ensure a better match between supply and demand.
Keywords: teacher supply and demand, foundation phase, multivariate model, mother tongue instruction, recruitment planning
Introduction: A brief history of South African teacher education provisioning post-1994: Waves of change
The unavailability of adequate numbers of appropriately qualified teachers for the country's schools compromises the quality of basic education, and has knock-on effects on all other education sectors, as inadequate numbers of learners are available to take up post-school learning opportunities, and those who are able to do so are often inadequately prepared to make a success of further opportunities. This has obvious implications for the country's economy (RSA DHET 2012:2).
Any study of foundation phase teacher supply and demand has to be located in the historical context of teacher education in South Africa. A review of the last fifty years of teacher education in South Africa highlights at least four distinct waves of change. We begin with an overview of the period just after the National Party took office in 1948.
The period of proliferation and fragmentation
The introduction of apartheid education in the 1950s was accompanied over the subsequent three decades by the establishment of over 100 teachers' colleges across the country, including in the "Bantu homelands". It was these, and a smaller number of earlier established teachers' training colleges (or "colleges of education", as they all came to be called), which supplied the vast majority of primary school teachers, including foundation phase teachers, in South Africa. The teachers' colleges were both an expression of the discriminatory policy of separate ethnic "development" and a source of prestige and political patronage for homeland political leaders (RSA DBE & DHET 2011:19). Under apartheid the teacher education sector as a whole was characterised by deep racial and regional inequality. Significant disparities were evident among the approximately 120 colleges of education, between the majority of these colleges and the more advantaged higher education institutions, and among the universities themselves.
At the outset of the democratic era in South Africa, the governing party's 1994 Policy Framework for Education and Training recognised that,
[...] given the lack of uniformity and the absence of planning across the teacher education sector, coupled with the uneven quality of inputs and outputs, the underutilization of many college facilities, undemocratic governance, and a stifling and uncritical ethos, the entire system of teacher preparation and development needed to be reconstructed (African National Congress 1994, cited in RSA DBE & DHET 2011:19).
The African National Congress' (ANC) Policy Framework also followed the growing international trend of seeing the higher education sector as the rightful domain of teacher education (Kruss 2008). The 1995 National Teacher Education Audit found that although there were some "centres of excellence", the teacher education sector in general was inefficient and of poor quality; that teacher training at most of the colleges of education was deemed to be "authoritarian and content-based" and "the most expensive form of tertiary education" (to the state); and that the failure rate was, despite the financial input, unacceptably high (Hofmeyr & Hall 1995:52).
The period of rationalisation and consolidation
In 1996 the National Commission on Higher Education recommended that colleges of education should be incorporated into existing higher education institutions. Only twenty-five of the 100-plus colleges of education were identified for incorporation into various universities and technikons (hence a national responsibility); however, in the end fewer than half of these were utilised in this way, the remainder becoming Further Education and Training (FET, now Technical and Vocational Education and Training, or TVET) college campuses or other educational institutions. During the early years of the new millennium, a much larger process of merging and restructuring occurred among the thirty-two universities and technikons (the majority of which had taken over responsibility for teacher education from the colleges), resulting, by 2004, in a reduced total of twenty-three universities.
Declining teacher education enrolments
Between 1994 and 2000, enrolment in initial teacher education (ITE) contact programmes declined from 70 731 to 10 153 (Vinjevold & Associates 2001:8, citing a Committee of College of Education Rectors of South Africa report of 2000). When the colleges of education closed, there was hardly any flow of students into the higher education system (Paterson & Arends 2008). A number of factors contributed to this declining enrolment:
• Though university fees were far higher than those at the former colleges, state teacher education bursaries ceased. Furthermore, because universities were more centralised, they were less accessible to many young people, especially those from rural areas.
• Because most college of education staff remained provincial employees, the provincial college of education salary and maintenance funding was not transferred to the universities, which were faced with having to carry out additional functions without additional funds.
• Many college lecturers did not have the necessary qualifications to teach in higher education. This impacted on lecturer availability, particularly for foundation phase and intermediate phase teacher education, leading to the relative neglect of these sectors.
• An increasing variety of alternative career possibilities was beginning to open up at the time for Africans, both males and females (Paterson & Arends 2008).
• The more stringent entrance requirements at universities meant that many students who would formerly have been able to study at teacher colleges were unable to qualify for admission to universities (Mda & Erasmus 2008).
Renewed expansion
In 2005 a Ministerial Committee on Teacher Education indicated that universities were finding it increasingly difficult to recruit ITE students and losing the capacity to offer quality ITE programmes (RSA DoE 2005). It also warned that an "unmanaged" situation, in which the supply of teachers was a national responsibility, while "demand" was essentially a provincial matter, made it very difficult to forecast teacher demand and to plan for supply and utilisation (ibid:i8). Following the release of the National Policy Framework for Teacher Education and Development in South Africa (NPFTED) (RSA DoE 2007), a teacher recruitment campaign was instituted and the full-cost national Funza Lushaka bursary scheme for teacher education was established to enable academically capable students to become teachers in priority areas of need.
The Integrated Strategic Planning Framework for Teacher Education and Development in South Africa, 2011-2025 (ISPFTED) (RSA DBE & DHET 2011) currently guides the collective efforts of the Department of Basic Education (DBE), the Department of Higher Education and Training (DHET), the provincial education departments and the universities to address teacher education and development challenges in South Africa, including mismatches between teacher supply and demand in certain provinces, in specific school phases and in certain subjects. Specifically, Output 4 of the ISPFTED indicates that "an expanded and accessible formal teacher education system that both develops practising teachers and produces sufficient numbers of new, quality teachers with the specialised and differentiated competences that are required by the schooling system will be established" (ibid:15).
Recent growth in foundation phase teacher education
Strategies linked to the NPFTED (for example, the Funza Lushaka bursary scheme) and ISPFTED (for example, the Strengthening Foundation Phase Teacher Education Programme, or SFPTEP) are likely to be the main drivers behind the recent growth that has been observed in the production of new foundation phase teachers. Moreover, additional foundation phase programmes were established at some universities where there had not been such programmes before.
As at the end of 2013, some of the tangible results of these initiatives included the following:
• The number of universities involved in foundation phase teacher education had grown from thirteen to twenty-one universities.
• The headcount enrolments in foundation phase ITE programmes had grown from 10 073 students in 2009 to 19 987 in 2012 - a 98% increase.
• The number of new foundation phase graduates (headcounts1) had increased from 1343 in 2009 to 2651 in 2012 - a 97.4% increase.
At a more qualitative level, the Strengthening Foundation Phase Teacher Education Programme (SFPTEP), which focuses on research, programme development and material development, supports the development of a strong early childhood education research community, with a strong identity and increasing status within the higher education system. The South African Research Association for Early Childhood Education (SARAECE) was founded in 2014 by the participants in the DHET-led SFPTEP. This community is increasingly able to play a stronger leadership role regarding childhood education issues in South Africa. There is also an increased focus on the preparation of foundation phase teachers who are able to teach in African language mother tongue contexts (RSA DBE & DHET in press).
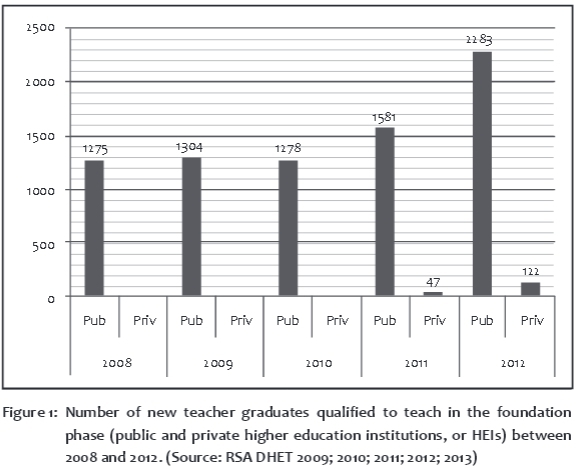
The graph in Figure 1 illustrates the recent growth in foundation phase teacher education by showing how the number of new foundation phase teacher graduates has increased from 2008 to 2012. The graph also indicates how the output of new teachers has been augmented since 2011 by a small number of private providers entering into the domain of ITE. It is expected that the contribution of private providers will increase substantially in future years.
While it is encouraging to see that foundation phase teacher education is growing in the country, two questions must be asked: Is it growing enough; and is it growing in suitable directions? A case in point is illustrated in Table 1:
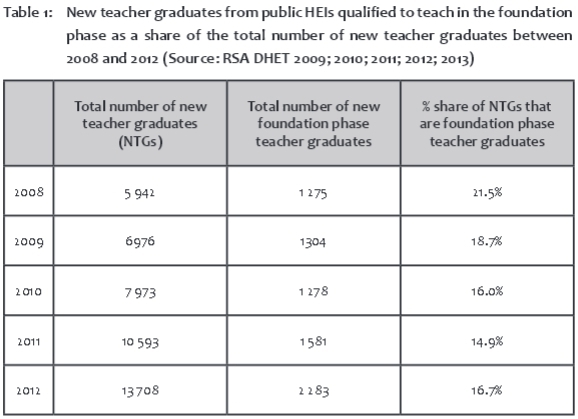
The table shows that the growth in the numbers of foundation phase teacher graduates is in line with the general growth in the overall number of new teachers graduating from public universities in the country each year. However, the share of foundation phase graduates of the total is not growing, and has in fact declined when compared with the 2008 share. The average percentage share of foundation phase teacher graduates over the five years is 17.55%. This may not be sufficient, given that 32.34% of the learners in ordinary schools in 2012 were foundation phase learners (RSA DBE 2012).
A detailed analysis is needed to develop a deeper understanding of the foundation phase teacher supply and demand context, which in turn requires the use of a workable supply and demand model in which the various determining factors are taken into account. This will assist in informing coherent planning for future foundation phase teacher supply.
A conceptual framework to underpin teacher supply and demand analyses
A multivariate approach (Marchant & Lautenbach 2011) is needed to understand teacher supply and demand more accurately. The full range of variables that have a bearing on supply and demand needs to be identified and quantified as accurately as possible. All the variables that can be quantified must be factored into the supply and demand model. Where quantification is not possible for specific variables, or where there may be questions about the accuracy of the data, reasons for this should be given and the impact on the analysis be made explicit. Likewise, all assumptions underpinning the quantification of variables must be explicitly stated and their impact on the analysis explained.
A teacher supply and demand model must take into account demand variables, which determine the number of teachers needed in the system, and supply variables, which determine the number of teachers available for employment in the system. Figure 2 provides an overview of a teacher supply and demand model that takes account of a range of supply and demand variables:
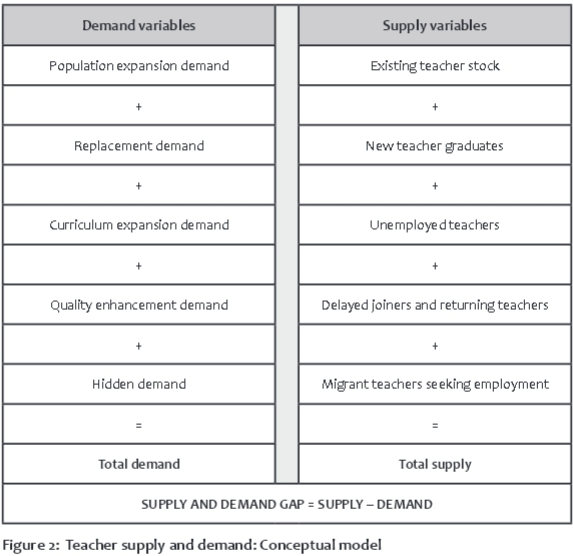
The model is:
• multivariate, in that it takes account of as many of the variables as possible that have an impact on supply and demand;
• predictive, in that it predicts what the supply demand gap would be at some point in the future; and
• cumulative,in that it considers the combined effect of the variable under consideration over the number of years leading up to the projected year.
Adding the determined values for the demand variables together provides an indication of the total demand for teachers, and adding the values determined for the supply variables together provides an indication of the total supply of teachers for the period under consideration. Subtracting total demand from total supply provides an indication of the supply and demand gap (positive or negative) that is likely to exist at the end of the period under consideration. A positive gap indicates that more teachers will be available than are needed; a negative gap means that fewer teachers will be available than are needed.
Demand variables include:
• Population expansion demand, which is created by changes in the school-age population; hence the need for more or fewer teachers. A standard method for calculating this demand (see Peltzer, Shisana, Udjo & Wilson 2005:14; Santiago 2002:36) is to divide the number of learners enrolled in schools by the learner-educator ratio (LER) in operation in the system, to give the number of teachers that the system needs to employ.
• Replacement demand refers to the number of employed teachers lost to the system as a result of in-service attrition, through resignation, retirement, death and other forms of termination. Simkins (2010:7) reminds us of the distinction between stocks and flows; he characterises teacher attrition as an "outflow" (from the supply of existing teachers) that allows us to estimate the number of new teachers required each year to replace teachers that are lost (that is, the demand) (ibid:1).
• Curriculum expansion demand refers to policy-led demand created by changes made to the official curriculum.
• Quality enhancement demand is demand that may be created by interventions aimed more generally at improving quality in schooling; for example, decreasing class sizes would lead to a greater demand for teachers.
• Hidden demand: Marchant & Lautenbach (2011) argue that out-of-field teaching and the employment of unqualified, under-qualified, or inappropriately qualified teachers actually mask teacher shortages, and should be considered as part of teacher demand.
Supply variables include:
• The existing teacher stock, which is the total number of teachers employed in the chosen baseline year.
• New teacher graduates (NTGs): the number of newly qualified teachers that become available for employment each year.
• Unemployed teachers that are actively seeking employment as teachers, who may be considered as forming part of the potential supply of teachers for the system.
• Delayed joiners and returning teachers include the pool of qualified teachers who may initially have opted to follow non-education career paths or to teach in another country, and subsequently chose to take up a teaching position in this country, or who taught, then left for an extended period of time, and then returned.
• Immigrant teachers are teachers from other countries who seek, and are eligible for, employment as teachers in South Africa.
From the conceptual to the pragmatic: Applying the supply and demand model to the foundation phase teacher supply and demand context
The analysis of foundation phase teacher supply and demand presented here takes into account the impact of the range of variables for the years 2012-2020. The year 2012 is chosen as the baseline year as it is the most recent year for which reliable, audited data is available, and 2020 is chosen as the projection year as new teacher graduate projections have been set up to 2019 as part of the process of finalising the Ministerial Statement on Universities Enrolment Planning 2015-2019 (RSA DHET 2014), and these are the teachers who will be available for employment in 2020.
Other data are drawn from the following data sources:2
• initial teacher education enrolment and graduation data of the twenty-one public universities or universities of technology that currently offer initial teacher education (ITE) programmes in South Africa, drawn directly from the DHET's Higher Education Management Information System (HEMIS), and from HEMIS officers at the public universities in South Africa;
• South African schooling system statistics, drawn from the DBE's Education Management Information System (EMIS);
• the National Treasury's personnel salary (PERSAL) database; and
• South African population statistics obtained from Stats SA (Statistics South Africa 2014a).
Determining values for the demand-side variables
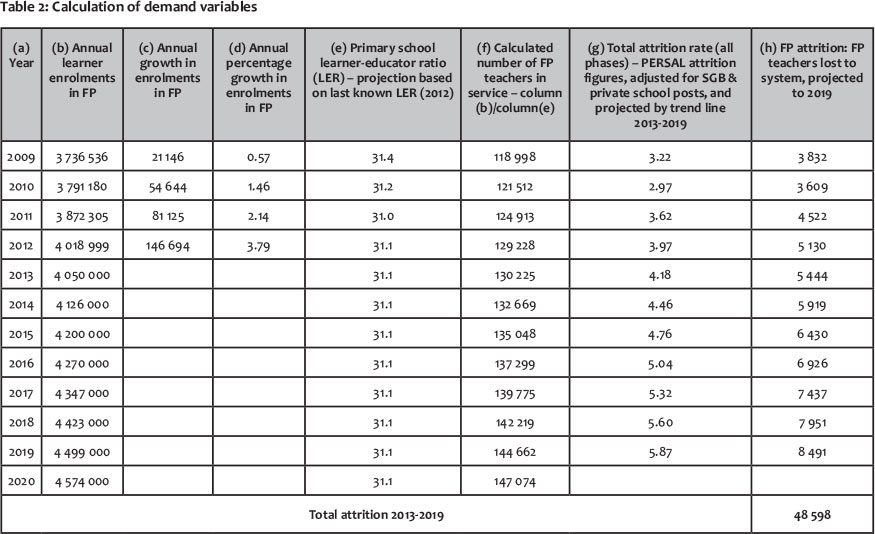
Table 2 was generated to provide information that will enable the calculation of the demand-side variables which will be taken into account in the analysis.
Notes:
• Column (b): Actual learner enrolments are provided for the years 2008-2012 (RSA DoE/DBE 2008; 2009; 2010; 2011; 2012). A regression analysis was used to provide projected learner enrolments from 2013 to 2019.
• Column (e): Calculated primary school LERs are provided for the years 2008-2012 (Simkins 2010; RSA DoE/DBE 2008; 2009; 2010; 2011; 2012). The last known LER (31.1) is projected for the years 2013-2020.
• Column (g): An attrition rate based on PERSAL attrition figures from 2005, and adjusted to include school governing body posts and private school posts, is projected by trend line from 2013 to 2019. The increasing retirement rate is thus factored in. This attrition rate is applied to the projected teacher numbers for these years to provide an indication of the number of teachers that will be lost over these years.
Determining population expansion demand
Table 2 also illustrates that the national learner-educator ratio (LER) has tended to flatten out in recent years. Nor is it likely to decrease substantially over the next few years, given fiscal constraints and the State's call to keep the public sector salary bill in check (South Africa. National Treasury Department 2014). An LER of 31.1 has therefore been applied for the years 2013-2020 in this study.
A regression analysis, based on the years 2008-2012, projects that learner enrolment in the foundation phase should reach approximately 4 574 000 by 2020.
Population expansion demand is therefore calculated as follows:
Projected learner enrolment in foundation phase in 2020/LER
= 4 574 000 / 31.1
= 147 074 foundation phase teachers needed in 2020 to accommodate population expansion from 2012 to 2020.
Determining replacement demand
A study by Gustafsson (2009), based on the National Treasury's personnel salary (PERSAL) database, indicated that the actual attrition rate for teachers in the public school system is in the region of 3%, after taking into account the recurring practice of many teachers in the system to join and leave over short spaces of time, which has the effect of artificially inflating attrition rates, possibly explaining the higher attrition rates reported in some other studies (for example, Crouch & Lewin 2000; Hall 2008; Mda 2009; Peltzer et al 2005). However, this does not take into account the impact of the currently increasing (but probably temporary) rate of retirement and early retirement. A calculated attrition rate based on actual PERSAL attrition figures from 2005, and adjusted proportionately to include school governing body posts and private school posts, was projected by trend line from 2013 to 2019. Retirement numbers were calculated separately from other forms of post termination, thus the increasing retirement rate is factored in. This attrition rate is applied to the projected teacher numbers for these years to provide an indication of the number of teachers that will be lost over these years.
Teachers expected to be lost from 2012 to 2019 = 48 598
= Replacement demand (teachers needed to replace those lost through attrition)
Determining curriculum expansion demand
The state's policy decision to incorporate Grade R (reception year) into the formal school system in South Africa is a curriculum expansion decision that requires the employment of additional teachers to cater for the newly incorporated Grade R learners. In 2001, the Education White Paper 5 on Early Childhood Education introduced the goal of enrolling all learners in Grade R as policy (RSA DoE 2001), with 2019 being the target year for complete incorporation of Grade R in schools (Samuels 2011).
Foundation phase learner enrolment growth is shown in columns (c) and (d) in Table 2. The rapid growth in enrolments (0.57% in 2009; 1.44% in 2010; 2.10% in 2011; and 3.65% in 2012) are some way above what Statistics South Africa (2014a) has projected for the age group 6 to 18 years between 2013 and 2020 (0.91%). This larger growth is most likely due to the uptake of Grade R learners into the schooling system. The projected enrolments up to 2019 are based on the historical trend over the years 2008-2012 and thus already take account of the contribution to the growth in enrolments resulting from the inclusion of Grade R. A numerical figure for this factor is therefore not included in this analysis.
Determining quality enhancement demand
There are no state plans or policies to address quality imperatives through strategies such as reduced class sizes. As indicated earlier in this paper, LERs have decreased and then flattened out over recent years. A numerical figure for this demand factor is therefore not included in this analysis.
Determining hidden demand
In the South African context, the issue of unqualified, under-qualified, or inappropriately qualified teachers is a significant challenge. There are anecdotal reports that large numbers of foundation phase teachers may fall into these categories, although this needs to be confirmed through research. What is clear, however, is that this challenge cannot be addressed through the employment of new teachers, including new teacher graduates. The development needs of teachers already occupying posts have to be addressed through the provision of appropriate continuous professional development opportunities. A numerical figure for this demand factor is therefore not included in this analysis.
Determining the supply-side variables
Determining the existing teacher stock
Unlike learner enrolment data per phase, figures on teachers per phase are not provided by the DBE's Education Management Information System (EMIS). The reason for this is the difficulty of establishing actual phase data when a significant proportion of teachers in practice teach across more than one phase. Thus, this analysis uses the method illustrated in Table 2 to determine the number of teachers expected to be teaching in the foundation phase by dividing the learner enrolment number (4 018 999) by the prevailing LER (31.1). This provides an existing teacher stock number of 129 228 in 2012.
Determining the new teacher graduate (NTG) supply
In South Africa, most new teacher graduates are produced by twenty-one public universities. A small number of new teacher graduates are produced by private higher education institutions.
The DHET's HEMIS database provides audited NTG figures for the public higher education institutions for 2012 and 2013. There is also an agreed NTG target for 2014. In addition, the DHET has finalised an enrolment plan for public universities that sets graduate targets from 2015 to 2019. For 2012 and 2013, since these teachers had already graduated, their phase specialisations could be gathered directly from the universities' returns. For 2014 to 2019, only the total number of projected NTGs is given in the enrolment planning targets, with no breakdown for phase specialisation. To overcome this difficulty, the latest ratio of new foundation phase teacher graduates that is based on fully audited figures (that is, the 2012 ratio) is applied to each year's projection from 2014 to 2019 to estimate what the foundation phase teacher proportion of the new graduates is likely to be.
Information on NTG output from the few private higher education institutions currently involved in initial teacher education in South Africa was collected directly from those institutions.
The graduate numbers (actual and projected) gathered from these sources are shown in Table 3.
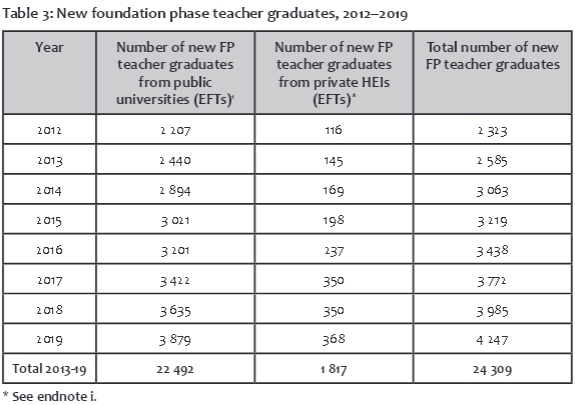
The figures for 2012 and 2013 are the actual graduate numbers, with the EFT principle applied (see endnote i). Figures from 2014 to 2019 are institutional projections. In the case of universities, they are based on university enrolment targets finalised during the DHET/university enrolment planning process.
Determining the supply of unemployed teachers
This variable represents the number of qualified teachers in the country who are currently unemployed, but who have signalled their willingness to be employed as teachers by submitting their details for inclusion on the DBE's National Recruitment Database of Professionally Qualified South African Educators (NRDPQSAE). Since it is not possible to extrapolate predictions from the historic data for this source, which has only existed on a reliable, managed basis since early 2013, the total number of individual teachers using the service over the last twelve months (in other words, since the database stabilised following its initial growth) is multiplied by seven (for the years 2013-2019), on the assumption that this supply will remain more or less constant. Because the numbers are relatively small, especially when disaggregated to the school phase level, there is no likelihood of significant distortion of the overall teacher supply figure. The total number of unemployed FP teachers using the database over the twelve months up to September 2014 was 550 (repeats appearing for more than one month were eliminated), and the cumulative total of unemployed FP teachers thus estimated to be available over the years 2013-2019 is 3850.
Determining the supply of delayed joiners and returning teachers
The personnel salary (PERSAL) database was analysed to obtain the number of teachers with relative education qualification value (REQV) 13 or above who were appointed to state-paid posts in the years 2007-2012, and who had been out of the system for at least four years prior to their appointment. (The latter precaution is necessary to eliminate teachers who, for a variety of reasons, repeatedly leave and rejoin the system, whose numbers tend to inflate attrition figures based on all exits from the system.)
The figures for delayed or returning joiners in all phases for the years 2007 to 2012 are shown in Table 4.
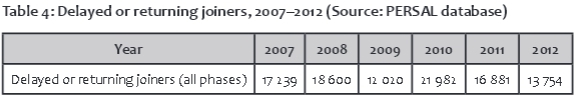
For the six years for which data is available, the lowest number of delayed or returning joiners (12 020 teachers) joined in 2009. To err on the side of caution, that year's low figure was used to estimate what the yearly supply from this source could be for the years from 2013 to 2019. As this figure represents all types of teachers, the proportion of FP teachers in the schooling system in 2012 was used to estimate what the number of FP teachers in this pool could be in that year (2 007 teachers). This figure was then multiplied by seven to estimate the number of teachers that could be available from this source from 2013 to 2019. This figure works out to 21 385 teachers.
Determining the number of immigrant teachers
Unfortunately, there is no data available on the number of immigrant teachers currently serving, or available to serve, in the foundation phase in the ordinary school system. A recent South African Qualifications Authority (SAQA) publication (Keevy, Green & Manik 2014) estimates that around 2 500 eligible immigrant teachers make themselves available for employment as teachers in South Africa on an annual basis. The study draws on the databases of the three organisations that evaluate immigrant teachers' qualifications or applications for professional registration, namely SAQA (which evaluates qualifications for comparability with South African qualifications); the DHET (which evaluates qualifications for recognition for employment in education); and the South African Council for Educators (SACE) (which professionally registers all teachers who wish to teach in South African schools). This annual estimate is multiplied by seven (the number of years up to 2019), to give an estimated total of 17 500 immigrant teachers over the period. According to the SAQA publication (ibid), the proportion of immigrant teachers employed in primary schools in 2010, as against those employed in secondary schools, was 19.2%. If about half of these are assumed to have taught in the foundation phase (Grades R-3 rather than Grades 4-7), it could be roughly estimated that 9.6% of the estimated total of 17 500 immigrant teachers available for employment from 2013 to 2019 (1 680) might be available to teach in the foundation phase over that time.
Applying the model to the foundation phase teacher supply and demand context
The values for the variables as calculated above was inserted into the model (Figure 2) to generate a projected 2020 foundation phase teacher supply and demand gap (Table 5).
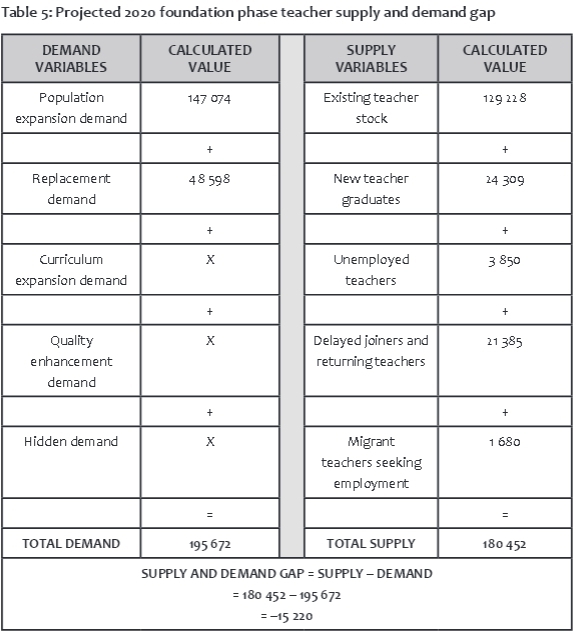
The model projects a negative gap of 15 220 by 2020, accumulating over the years from 2013 to 2019, meaning that fewer teachers will be available than are needed.
However, while there is some degree of certainty regarding the first two demand variables (population expansion demand and replacement demand) and the first two supply variables (existing teacher stock and new teacher graduates), there is a high degree of uncertainty and conjecture regarding the other three supply variables (unemployed teachers, delayed joiners and returners, and immigrant teachers) and the extent to which they will contribute to the supply of teachers over the coming years. For example, there is no way of knowing the extent or stability of the pool of delayed and late joiners, and whether or when it will run out. These variables are best regarded as together providing a relatively unpredictable and possibly temporary 'cushion' on the supply side. If the values for these variables are 'bracketed out' of the supply and demand calculation, the pragmatic supply and demand model projects a large negative supply and demand gap, as shown in Table 6.
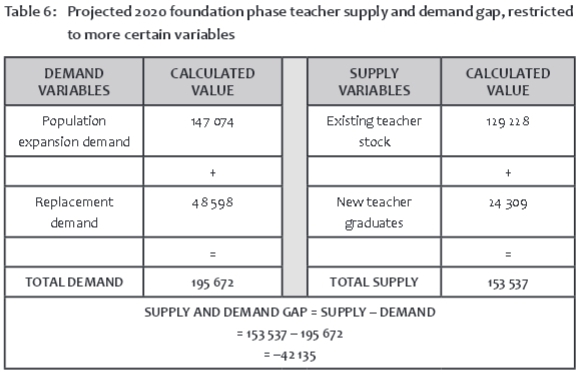
The pragmatic version of the model projects a severe negative gap (undersupply) of 42 135 foundation phase teachers accumulated from 2013 and 2020, meaning that substantially fewer teachers than needed will be available.
Mother tongue instruction in the foundation phase
The DBE encourages the use of mother tongue education (where learners learn in their home language) in the foundation phase (South Africa. National Assembly 2012).
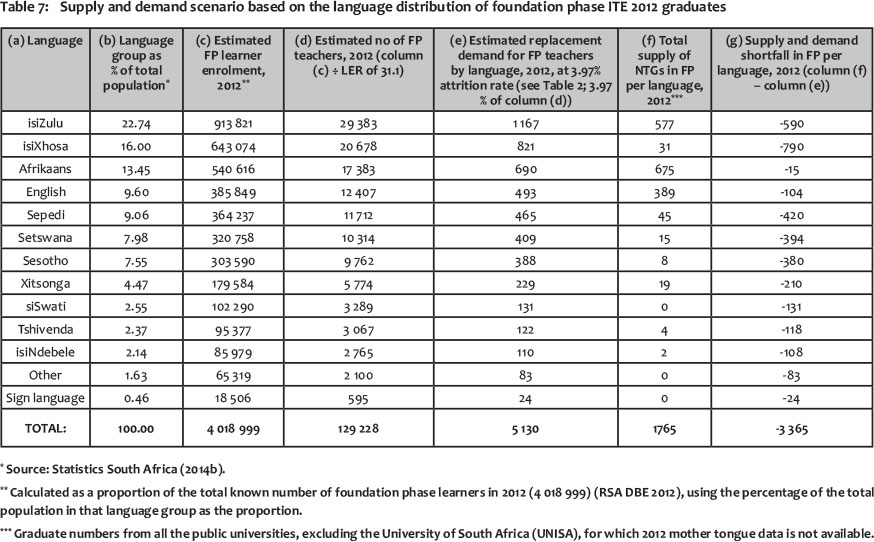
Table 7 illustrates a supply and demand scenario for mother tongue instruction in the foundation phase based on the language indicated by the 2012 ITE graduates as their home language.
Table 7 illustrates that, across the board, the teacher education system is not producing sufficient numbers of foundation phase teachers in any of the language groups (estimated negative gap of 3 365 in 2012). This is in keeping with the previous data pointing to a general undersupply of foundation phase teachers. However, the deficit in African language-speaking foundation phase teachers stands out (Figure 3 and Table 7), with isiXhosa being the most underrepresented in terms of sheer numbers.
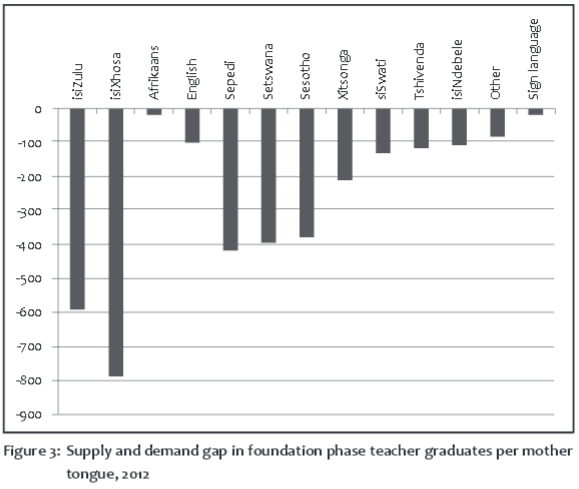
The current reality is that a small number of students who have an indigenous African language as home language graduate as newly qualified foundation phase teachers. Since very few universities actually prepare students as African language teachers, most of these graduates are not qualified to teach a particular African language, nor are they able to use such a language as a language of learning and teaching.
Conclusion: From an emphasis on numbers to a reflection on patterns
This paper has attempted to show that balancing the demand for foundation phase teachers in South Africa with an adequate supply of appropriately qualified teachers is not a simple equation. A multivariate, predictive analysis was employed to take account of the range of variables that determine or influence teacher supply and demand in South Africa. Those variables that can be quantified were factored into the supply and demand model presented, in order to achieve a more nuanced understanding of the challenges involved in matching demand with an appropriate supply of teachers. However, the main relevance of the numbers that have been generated and presented through this analysis does not lie in their actual values, but the overall patterns that they illuminate. The main patterns are:
• The number of new foundation phase teacher graduates increased steadily between 2008 and 2012. However, this increase is mostly due to the overall increase in the number of new teacher graduates over this period. The share of foundation phase graduates, when compared to 2008, has actually declined.
• South Africa is not producing enough new foundation phase teachers, and a 2012-2020 pragmatic supply and demand projection indicates that even by 2020, demand for foundation phase teachers will still largely outstrip supply.
• The biggest challenge continues to be the adequate production of new foundation phase teachers who are able to use indigenous African languages as languages of instruction, and in particular, foundation phase teachers who are able to teach the indigenous African languages as school (academic) subjects.
These patterns point to the need for South Africa to implement direct interventions to grow the number of new foundation phase teacher graduates if it is serious about addressing the obvious challenges in schooling in the early years. Such interventions should include:
• Encourage universities to grow the proportion in teacher education enrolments of students who will study to become foundation phase teachers.
• Encourage and intentionally recruit, and provide bursary funding for, greater numbers of African language students to become foundation phase teachers.
• Ensure that the language practices at universities move beyond simply recruiting African language foundation phase students to having programmes in place that develop students' capacity (i) to use the African languages as languages of instruction; and (ii) to teach the African languages as academic subjects. This will necessarily require that the universities' own foundation phase teacher education language practices are reformed to enable this to happen.
References
Crouch, L. & Lewin, K. 2000. Turbulence or orderly change? Teacher supply and demand in South Africa - current status, future needs and the impact of HIV/Aids. Institute of Education Multi-Site Teacher Education Research Project. Brighton and Hove: University of Sussex Centre for International Education. [ Links ]
Gustafsson, M. 2009. Teacher supply patterns in the payroll data. Unpublished research paper for the Department of Basic Education (DBE). Pretoria: DBE. [ Links ]
Hall, G. 2008. Issues in planning nationally for supply of a sufficient number of newly trained teachers. Presentation delivered at SACE Teacher Supply and Demand Seminar, Johannesburg, November 2008.
Hofmeyr, J. & Hall, G. 1995. The National Teacher Education Audit: Synthesis Report. Johannesburg: Edupol, National Business Initiative. [ Links ]
Keevy, J., Green, W. & Manik, S. 2014. The status of migrant teachers in South Africa: Implications for policy, research and practice. Pretoria: South African Qualifications Authority (SAQA). [ Links ]
Kruss, G. 2008. Trajectories of restructuring: The changing context for initial teacher education in South Africa. Proceedings of the Teacher Education and Development Programme (TEP) Concluding Conference. Cape Town: HSRC Press. [ Links ]
Marchant, G. & Lautenbach, G. 2011. An interactive, multivariate projection model for the alignment of teacher demand and supply for schools in the Gauteng Province of South Africa: A disaggregated approach. Education as Change, 15(1):143-156. [ Links ]
Mda, T. & Erasmus, J. 2008. Educators: Scarce and Critical Skills Research Project. Human Sciences Research Council (HSRC), Development Policy Research Unit (DPRU), University of Cape Town Sociology of Work Unit, Research Consortium.
Mda, T. 2009. Educators. In J. Erasmus & M. Breier (Eds.), Skills shortages in South Africa: Case studies of key professions. Cape Town: HSRC Press and Department of Labour. 199-218. [ Links ]
Paterson, A. & Arends, F. 2008. Who are we missing? Teacher graduate production in South Africa, 1995-2006. Proceedings of the Teacher Education and Development Programme (TEP) Concluding Conference. Cape Town: HSRC Press. [ Links ]
Peltzer, K., Shisana, O., Udjo & Wilson, D. 2005. Educator supply and demand in the South African public education system: Integrated report. Cape Town: HSRC Press/ELRC. [ Links ]
RSA DBE & DHET (Republic of South Africa. Department of Basic Education & Department of Higher Education and Training). 2011. Integrated Strategic Planning Framework for Teacher Education and Development in South Africa, 2011-2025. Pretoria: Government Printers. [ Links ]
RSA DBE & DHET (Republic of South Africa. Department of Basic Education & Department of Higher Education and Training). In press. First Progress Reporton the Integrated Strategic Planning Framework for Teacher Education and Development in South Africa. Pretoria: Government Printers. [ Links ]
RSA DBE (Republic ofSouthAfrica. Department of BasicEducation).NationalRecruitment Database of Professionally Qualified South African Educators. Retrieved from http://www.education.gov.za/Educators/EducatorRecruitmentDatabase/tabid/844/Default.as (accessed 10 October 2014).
RSA DHET (Republic of South Africa. Department of Higher Education and Training). 2012. Expansion of Teacher Education. Unpublished addendum to discussion document on national colleges. Pretoria: DHET. [ Links ]
RSA DHET (Republic of South Africa. Department of Higher Education and Training). 2009; 2010; 2011; 1012; 2013. Trends in Teacher Education Reports: 2008; 2009; 2010; 2011; 2012. Pretoria: Department of Higher Education and Training. [ Links ]
RSA DHET (Republic of South Africa. Department of Higher Education and Training). 2014. Ministerial Statement on Universities' Enrolment Planning 2015-2019. Pretoria: Department of Higher Education and Training. [ Links ]
RSA DoE (Republic of South Africa. Department of Education). 2000. Norms and Standards for Educators. Government Gazette, Vol 415, No 20844. Pretoria: Government Printers. [ Links ]
RSA DoE (Republic of South Africa. Department of Education). 2001. Education White Paper 5 on Early Childhood Education: Meeting the Challenge of Early Childhood Development in South Africa. Pretoria: Government Printers. [ Links ]
RSA DoE (Republic of South Africa. Department of Education). 2005. A National Framework for Teacher Education in South Africa (NFTED). Report of the Ministerial Committee on Teacher Education. Pretoria: Government Printers. [ Links ]
RSA DoE (Republic of South Africa. Department of Education). 2007. National Education Policy Act (27/1996): The National Policy Framework for Teacher Education and Development in South Africa. Government Gazette Vol 502, No 29832. Pretoria: Government Printers. [ Links ]
RSA DoE/DBE (Republic of South Africa. Department of Education/Department of Basic Education). 2008, 2009, 2010, 2011, 2012. Education Statistics in South Africa. Pretoria: DBE. [ Links ]
Samuels, M. 2011. Personal communication.
Santiago, P. 2002. Teacher demand and supply: Improving teaching quality and addressing teacher shortages. Paris: OECD. [ Links ]
Simkins, C. 2010. Demand for and supply of teachers: 2010 to 2050. Paper commissioned by the Centre for Development and Enterprise (CDE). Johannesburg: CDE. [ Links ]
South Africa. National Assembly. 2012. Minister of Basic Education's oral reply to Oral Question 68. Retrieved from http://www.education.gov.za/Newsroom/ParliamentaryQuestions/2012ParliamentaryQuestions/tabid/709/ ctl/Details/mid/1991 /ItemID/3312/Default.aspx (accessed 5 September 2014).
South Africa. National Treasury Department. 2014. Medium-Term Budget Policy Statement Speech by Minister of Finance, Nhlanhla Nene, 22 October 2014. Retrieved from http://www.treasury.gov.za/documents/mtbps/2014/mtbps/speech.pdf (accessed 10 November 2014).
Statistics South Africa. 2014a. Population growth estimates provided on request from the authors.
Statistics South Africa. 2014b. Language group as percentage of total population, based on Census 2011, provided on request from the authors.
Vinjevold, P. & Associates. 2001. Initial and in-service teacher education: Skills training in relation to national needs and interests. Report commissioned by ETDP SETA. HSRC/Joint Education Services.
* Email address: whitfield.green@gmail.com
1. A headcount graduate is any initial teacher education graduate who specialised in teaching in the foundation phase of schooling. However, some of these graduates may also have specialised to teach in the intermediate phase, as teacher education qualifications policy previously allowed dual phase specialisation (RSA DoE 2000). There is no way of predicting whether a graduate with both phase specialisations will end up teaching in the foundation phase or the intermediate phase, or both. To deal with this dilemma, the notion of Equivalent Full Teacher (EFT) is introduced. If a graduate has only specialised to teach in the foundation phase, then the graduate is 1 EFT. If the graduate has specialised to teach both phases, the graduate is counted as ½ EFT for each phase. This means that quoted figures for headcount graduates will differ from quoted figures for EFT graduates.
2. Access to the DHET's Higher Education Management Information System database (HEMIS), the DBE's Education Management Information System database (EMIS), and the National Treasury's Personnel Salary (PERSAL) database is restricted. The authors were able to draw on this information due to their affiliation with the Department of Higher Education and Training.

