


Servicios Personalizados
Articulo
 Inglés (pdf)
 Articulo en XML
 Referencias del artículo
Indicadores

Links relacionados
-
 Citado por Google
 -
 Similares en Google
Compartir

 Permalink
South African Journal of Childhood Education
versión On-line ISSN 2223-7682
versión impresa ISSN 2223-7674
SAJCE vol.4 no.2 Johannesburg 2014
ARTICLES
The readability of two Grade 4 natural sciences textbooks for South African schools
Lucy Sibanda
Rhodes University. Email: icysbnd@gmaii.com
ABSTRACT
This paper, deriving from a larger study, evaluates the readability of two Grade 4 natural sciences textbooks used by learners who speak English as an additional language in two South African schools. The study is set within the context of the reading-related transitional challenges faced by English second language learners when they move from the foundation phase to the intermediate phase. Text readability is critical for educational achievement during this transition. The case study was conducted by means of a qualitative content analysis of factors that are not accommodated in the readability formulae which were used to investigate the textbooks. While the findings from the two instruments were ambivalent for Book 1, with the content analysis showing the book to be largely readable, but the readability calculator indicating it to be beyond the learners' reading level, both instruments indicated poor readability for Book 2. The study recommends a close consideration of text readability by both authors and teachers.
Keywords: readability, readability formulae, reading levels, content analysis, graphics
Introduction
An understanding of mathematics, science and technology is a prerequisite to meaningful participation in the modern technology-oriented world (Lederman 2008; Lisichkin 2007; RSA DoE 2001). Mji and Makgato reiterate the importance of science and technology for economic growth, but assert that South Africa is lagging in terms of the required "scientific and technological advancement":
In order to provide employment for all, either through job creation or employment in the labour market, a level of scientific and technological advancement that will enable growth and expansion of the economy is needed, and South Africa is far from this ideal situation.
(Mji & Makgato 2006:254)
Notwithstanding the acknowledged determinateness of scientific and technological knowledge, South African learners persistently underachieve in science, as in numeracy and literacy (Conzales, Guzman, Partelow, Pahlke, Jocelyn, Kastberg & Williams 2004). Although a myriad of factors may account for such underperformance, the pivotal role of the monolithic textbook in teaching and learning necessitates a consideration of whether current textbooks are sufficiently readable to allow for the mediation of learning. Research testifies to the significant contribution that high quality, readable textbooks make to the learning process (Mikki 2000; Taylor 2008b; Singer & Tuomi 2003).
Despite the initial discouragement of reliance on textbooks and the endorsement of teacher-produced materials in the Outcomes-Based Education (OBE) curriculum (RSA DoE 2001) and the policies subsequent to this first curriculum reform, the textbook has made a comeback, with the Department of Basic Education (DBE) acknowledging the indispensability of the textbook in ensuring consistency, coverage, appropriate pacing, and better quality content teaching (Motshekga 2009). The need for textbooks is even greater in science education, where complex classification systems, taxonomies and graphics are used extensively to represent conceptual relationships (Lee & Spratley 2010). To represent of all this on charts or the chalkboard would be a daunting task. The extent of textbooks' usefulness, however, is determined by how readable and understandable they are to learners (Allington 2002). Textbooks that are beyond learners' reading competence, including their comprehension and vocabulary, only result in frustration and will not lead to learning, because active processing is unlikely to take place. Textbooks therefore have to be pitched at the right level of reading competence. This paper reports on an assessment of the readability of two Grade 4 natural sciences textbooks that are currently used as core texts in two schools. The study also tested the learners' comprehension of the texts, which, though not presented in this paper, explains the choice of these two schools, which differ in many regards, as research sites. The rationale for the study becomes apparent from an understanding of the context in which it was conducted.
The context of Grade 3 to 4 transitional challenges
The study is set within the context of reading to learn by English second language learners at a transitional point from the foundation phase to the intermediate phase of primary school - a period marked by significant reading-related hurdles in the South African context. Firstly, it represents the transition from 'learning to read' (acquiring the mechanics of reading) to 'reading to learn' (using the reading skill acquired to unlock informational texts). Secondly, for 80% of South African learners (Howie, Venter, Van Staden, Zimmerman, Long, Sherman & Archer 2008), it is a transition from the use of their home language, which is most often an African language (isiXhosa in the present study), to the use of another language, which in the South African context is known as a first additional language (usually English), as the medium of learning and of instruction. Thirdly, it marks a shift from the reading of predominantly narrative texts to the reading of dense informational or expository texts. Moreover, the volume and amount of reading also increases, because the subject areas increase. All these transitions make reading in Grade 4 both qualitatively and quantitatively difficult. Unreadable texts at this level would only add to these challenges and account, in part, for the underperformance of learners in international or cross-national comparative assessments. A lack of books in most children's homes was identified by the (then) Department of Education (RSA DoE 2008) as one of the many factors militating against improved performance. This poor home reading infrastructure leaves the school textbook as the main, if not sole, source of printed language input for the majority of learners. Such challenges highlight the need to determine the readability of textbooks used in schools. The categories and nature of the readability assessment were informed by the literature on the subject.
Readability and reading levels of texts
The study refers to literature that conceptualises readability in terms of diverse variables that render texts readable. It explores the origin of readability formulae, their use in determining text readability, and their attendant limitations. It also includes literature related to the reading levels of texts.
The concept 'readability'
This study considers Dale and Chall's definition, although dated, as the most comprehensive among several definitions. They define readability as:
The sum total (including all the interactions) of all those elements within a given piece of printed material that affect the success a group of readers have with it. The success is the extent to which they understand it, read it at an optimal speed, and find it interesting.
(Dale & Chall 1949:148)
Readability results from the interplay between various factors that render a text comprehensible. Some of these factors are discussed next.
Factors affecting the readability of texts
According to Graves & Graves (2003), factors affecting the readability of texts include vocabulary complexity; sentence and text structure; text length and elaboration; coherence and unity; familiarity of content and background knowledge required; audience appropriateness; quality and verve of writing; and interestingness. An elaborate explanation of each is beyond the scope of the present article. For Langhan (1993), the number of difficult words in a text determines its readability. However, the question of what constitutes the difficulty of a word is itself neither simple nor consentaneous. The length and complexity of sentences may also contribute to text difficulty, with shorter, simpler sentences being more readable. Again, it is not a question of just counting the number of words per sentence. Short, choppy sentences may detract more from text readability than longer sentences with examples and illustrations meant to enhance comprehensibility. Elaborated text is easier to understand (Graves & Graves 2003).
Textual coherence relates to topic, subtopics and paragraph links in sentences that add to text readability. In terms of the nature of texts, narrative, story-like texts with language that closely approximates the ordinary language of everyday social interaction are easier to read than expository texts, which have more content dense vocabulary and are generally more challenging (Graves & Graves 2003). Content familiarity can also enhance text readability; however, there must of course be some unfamiliar material to extend the reader's knowledge. Again, familiarity is relative, which explains the difficulty in determining the readability of a text. Related to familiarity as a measure of readability is the extent to which textual material coincides with the readers' needs and interests.
The history of readability measures and readability formulae
Readability as an object of study dates back to the 1920s, when learners, teachers and librarians evaluated the readability of texts (Zamanian & Heydari 2012) for purposes congruent with their roles. This saw the development of readability formulae, which provided an objective, analytical way of predicting text readability in the absence of readers and estimated the number of years of education one would need to have in order to understand a particular text, with a view to developing and selecting texts that are accessible to the intended audience or readership (Kondur 2006).
In these readability formulae, word difficulty and sentence length were identified as major determinants of text readability (Zamanian & Heydari 2012). Word difficulty was determined by the number of syllables in a word, where the more the syllables, the more difficult the word was deemed to be (ibid). Sentence length was measured by the number of words in a sentence, the assumption being that short sentences ease the reading and understanding of texts (DuBay 2004). Despite the determination of these twin variables not being foolproof, their amenability to quantification and objectivity of analysis favoured their use in readability formulae such as Flesch Reading Ease, the Dale-Chall Formula, the Fry Readability formula, and several others. According to DuBay (ibid), over 200 readability formulae have been created.
Technological advancement has allowed for the use of a free online tool, the Text Readability Consensus Calculator (Readability Formulas nd), which uses seven popular readability formulae to calculate the average grade level, reading age, and text difficulty of text samples, based on the number of syllables, words and sentences in a sample text. The formulae used by the Text Readability Consensus Calculator are the Flesch Reading Ease, Gunning Fog, Flesch-Kincaid Grade Level, Smog Index, Coleman-Liau Index, Automated Readability Index, and Linsear Write formulae. The Text Readability Consensus Calculator was used to assess the readability of two Grade 4 natural sciences textbooks used in two South African schools.
Although readability formulae provide an independent and objective assessment of the readability of a text and have been shown to have predictive validity, they, like any other instrument, have limitations of their own. Yet these limitations have not detracted from the extensive use of readability formulae to determine the grade level of reading material, including graded reading schemes. An exposition of these limitations is beyond the scope of the study reported in this article, but an acknowledgement of their presence necessitates the use of readability formulae in conjunction with other methods. Therefore, in this study, readability formulae are used in conjunction with qualitative analysis of the readability of text using criteria developed from the research literature (Mikki 2000; Graves & Graves 2003).
Reading levels of texts
Burns, Roe and Ross (1988) identify three levels of text readability, namely independent, instructional and frustration levels. If a reader is able to read and understand a book on their own, the book is said to be at their independent reading level. For a text to be at this level, there should be 98-100% word recognition in the text (Waring & Nation 2004). Reading should proceed fluently, without hesitations of more than five seconds. A book at the instructional reading level is accessible to learners with the teacher's help. Here, at least 90% of words should be known (Armbruster, Lehr & Osborn 2003). Earlier research by Burns et al (1998) posit that the reader should register at least 75% comprehension of a text and that anything below this signifies reading at frustration level. However, later research by Armbruster et al (2003) pegs the frustration level at below 90% of word knowledge. Texts at frustration level are better avoided. Because textbooks are normally used by learners with the teachers' assistance, they should largely be set at the learners' instructional reading level, with some portions at the independent reading level.
Apart from the literature, the present study is also informed by related studies.
Related studies
Some research to determine text readability has been conducted in South Africa. Langhan (1993) cites Macdonald's 1990 study on the textbook as a source of difficulty in the teaching and learning of geography through the medium of English in Standard 3 (Grade 5) in primary schools attended by most black children. Findings showed that English proficiency was poor in Standard 3 and that it was very difficult for learners to learn content subjects such as science, geography and mathematics in English. Macdonald also found that learners' failure to perform well in content subjects was partly because the language in their textbooks was not accessible to them. There was a mismatch between learners' grade level and the texts' reading levels (ibid). The present study sought to establish whether the same holds true for fairly recently published textbooks which are currently being used in schools. A study by Mankomo (1990) revealed that the first textbooks that learners encountered in English had a very large number of words which learners did not know. Internationally, Mayer (1989) investigated the use of illustrations in expository texts and their contribution to text readability. Learners who had no prior knowledge of the mechanics of cars read a passage about car braking systems that either contained illustrations without labels, or labels without illustrations. Mayer found that illustrated texts engendered greater comprehension and retention than unillustrated texts.
In another study, in Botswana (Kasule 2011), primary school student teachers (all ESL in-service teacher trainees) assessed textbook readability using an online readability tool and a cloze test administered to 278 Grade 7 primary school pupils. The finding was that the text was difficult. In the cloze test, only eighteen pupils could read the text without assistance, while the rest read it at frustration level.
Although this study's focus does not represent a marked departure from these studies in terms of purpose, it uses different tools from the ones used by the reviewed studies. It uses content analysis to determine the influence of vocabulary, concepts and graphics in text readability, and the readability calculator to determine the grade levels of the textbooks.
Research questions
In assessing the readability of two Grade 4 natural sciences textbooks, with specific focus on learners who speak English as an additional language, the study was guided by the two research questions:
1. To what extent are the selected Grade 4 natural sciences textbooks readable in terms of specific criteria?
2. Are the selected natural sciences textbooks at an appropriate reading level for Grade 4 learners?
The first question seeks to identify aspects of the textbooks that support or impede their readability, while the second seeks to determine the textbooks' readability level.
Research Methodology
Research orientation
The study is interpretive in nature. Cohen, Manion and Morrison (2000) describe interpretive research as research that seeks to understand a phenomenon - in this case, the readability of Grade 4 natural sciences textbooks. Both qualitative and quantitative methods were used to determine the readability of the natural sciences texts. Data of a qualitative nature emanates from a qualitative content analysis of four factors that determine the readability of texts. The quantitative component comprises the readability formulae that are part of the readability consensus calculator that yields numerical data. The research design is a case study. The research design and the research procedure followed in both the quantitative and qualitative dimensions are discussed next.
Case study
Yin (2003:13) defines a case study as follows:
[...] an empirical inquiry that investigates a contemporary phenomenon within its real-life context; when the boundaries between phenomenon and context are not clearly evident; and in which multiple sources of evidence are used.
According to Gerring (2004:342), the case study approach is used "for the purpose of understanding a larger class of (similar) units". A case study design was deemed suitable for the present study due to its ability to capture the complexity of a single case, which is the unit of analysis, and its allowance for the amalgamation of multiple methods to illuminate the case from diverse angles and the investigation of the case in its natural context. This case study used both qualitative and quantitative data to confirm, cross-validate and corroborate findings within a single study (Plano Clarke & Creswell 2008).
Sample and site
Two Grade 4 natural sciences textbooks constitute the case for the present study. The textbooks were purposefully selected, as they are currently being used in the two Grade 4 classes at the schools participating in the study. Since the study prioritised depth over breadth, only two schools, attended by predominantly isiXhosa-speaking learners who are taught English as a first additional language, were included in the study. This allowed the investigation into the extent to which the natural sciences textbooks, written in English, were accessible to Grade 4 second language users of English.1 The selected textbooks were used more frequently than others in the two classes, because the teachers, by their own admission, thought that these textbooks were the most accessible. The following texts, hereafter referred to as Book 1 and Book 2, were selected and analysed:
Book 1: Thurlow J & Strydom H. 2009. Spot On Natural Sciences Learners' Book. Grade 4. Gauteng: Heinemann.
Book 2: Govender M & Subramani T. 2004. Learning natural sciences can be fun. Learners' Book. Grade 4. Pretoria: Nasou via Africa.
Data gathering
Content analysis, which Berg (2007:303) defines as "a careful, detailed, systematic examination and interpretation of a body of material in order to identify patterns, themes, biases, and meanings", provided a qualitative dimension to the study and responded to the first research question. The data source was the textbooks identified above. Line by line analyses of both texts were done, looking at vocabulary; concepts (whether they were explained and exemplified); graphics (whether they were supported by accompanying text); and the nature of the subject matter (whether the content was familiar to readers) in order to determine how these aspects enhanced or hindered the readability of each textbook.
In response to the second research question, a quantitative method, the readability formulae, relying on its strengths of both objectivity and consistency, was used. The readability calculator, embodying seven quantitative readability formulae, was applied to sixteen samples, with optimal data power, from each textbook. Each individual formula yielded a readability score for each sample. Finally, a consensus from all the seven measures was computed yielding a grade level, readability level and reader's age for the text.
A quantitative method was used to respond to the second research question. Based on their strengths of both objectivity and consistency, reading formulae were selected to gather the quantitative data. An online readability calculator, incorporating seven different quantitative readability formulae, was applied to sixteen text samples from each textbook, which were selected for optimal data power.
Presentation and discussion of data
Data was largely categorised in tabular form. Data that was found to represent a given characteristic of a category was used to illustrate the particular aspect under examination.
Content analysis
This section presents data obtained from the line by line analysis of the texts that was done to determine how vocabulary (technical words); graphics; conceptual density; and the nature of the subject matter could arguably enhance or hinder the accessibility of either textbook. Although this section is largely qualitative, quantitative measures are included to provide a clearer picture of the manifestations of these textual features in each textbook.
Vocabulary (technical words)
Technical words (words with a specialised meaning and which are associated with a particular content area or topic) were examined to see whether any effort had been made by the textbook writers to assist learners' comprehension of these words. Table 1 presents the ratio of technical words to pages and the percentages of the technical words in terms of whether they are only mentioned, only defined, or defined, exemplified or explained. This indicates the extent to which the technical words are followed up on, which in turn determines the extent to which they influence text readability.

Table 1 shows that most of the technical words are only mentioned in the text books, without explanations or examples to make them accessible to learners. Examples of such words include planet, climate, oxygen, compression, solar system, soil erosion, resources, reptile, weathering, evaporation, snow, chlorine, cholera, pollution, floods and skeleton. An average of five or seven technical words per page is quite high, considering that most passages in both textbooks contain between 100 and 250 words. Having many technical words on a single page can render the text unreadable if the author has not made any effort to define terms or give examples. The analysis of vocabulary complexity shows that, for Book 1, 43% of the technical words are only mentioned, without providing explanations or examples. If one adds to this the 20% of technical words that are only defined and left at that, it means that 63% of the technical terms in Book 1 are not sufficiently elaborated to render them readable to the learners. For Book 2, 40% of the words are mentioned only, while 25% are defined only, and 35% are defined, exemplified or explained. When a text features many technical words that are neither defined nor explained, comprehension of that text is likely to be minimal. Words that were mentioned only include gravity, troposphere, stratosphere, ultraviolet, air pressure, precipitation. These words are technical and academic words learners cannot pick up from common interpersonal communication. These findings show that both texts are difficult to read at the vocabulary level.
Conceptual density
In the context of this study, scientific concepts are scientific ideas that are generally agreed upon in the scientific and also in the educational community. In this analysis, some technical words represent scientific concepts. Concepts, like (technical) vocabulary, also need to be defined and exemplified in order to make a text accessible. The concepts in the texts were identified, page by page, as well as the way in which each concept was used, that is, whether they were mentioned only, defined only, or explained or exemplified in order to make them comprehensible. Table 2 summarises the findings.

Book 1 used words representing eighty-two concepts, with an average of one concept per page, which for me was moderate enough. Two concepts are mentioned only, one is defined only, and seventy-nine are defined, explained and exemplified. This means that only 2.4% of the concepts found in the textbook are mentioned without any definitions or examples, while 96.3% of the concepts are accessible. The writers made a commendable effort to assist the reader in accessing background knowledge of the concept under discussion. Both the conceptual density and presentation of concepts in Book 1 ease its readability.
Book 2 includes words representing 238 concepts, with an average of 2.3 concepts per page, which seems appropriate, considering that the passages in the textbook are very short. The problem, however, is that most of these concepts are not developed. This is the case throughout Book 2. Only 19.3% of the concepts are defined, explained or exemplified. Examples include molecules, atoms, friction, domesticated animals, volcanoes and evaporation. The majority (60.1%) of the concepts are defined only, with no examples or explanations, while concepts that are mentioned only constitute 20.6%. With more than 80% of the concepts being neither explained nor exemplified, text readability is compromised. Learners may move from one concept to the next without understanding them, which greatly lowers the readability of the textbook. There is no conceptual overload in either book, with conceptual development being adequate in Book 1, but weaker in Book 2.
Graphics
Graphics are visual representations of ideas (concepts), including drawings, graphs, maps or diagrams. According to Van Rooyen (1990, cited in Langhan 1993), graphics have three functions, namely to give meaning to the text, reinforce learning, and attract attention in order to help the reader find out more about the issue under discussion. In this study, diagrams were analysed to see if they were supported by the accompanying text and to evaluate whether they fulfil these functions.
Presentation of graphics in Book 1
In Book 1, all graphics are captioned or titled and those that require labelling are labelled. Figure 1 shows a disabled person and Figure 2 shows living and non-living things.
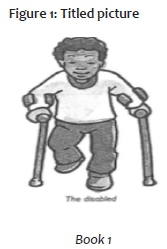

The diagrams in the textbook are also labelled, as in Figures 3 and 4, with the labels appearing in the accompanying text. Combining visuals and text reinforces and optimises learning (Langhan 1993).
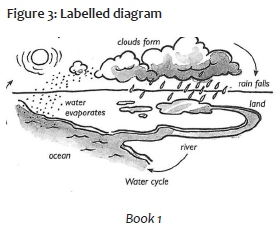


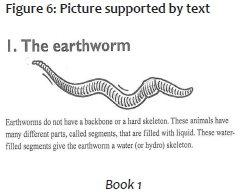

In a nutshell, the graphics in Book 1 serve their purpose well, because all graphics are captioned or titled, which assists readers in telling what the diagram or image is about. In addition to this, the diagrams in the textbook are also labelled and supported by the accompanying text. As readers read the text and refer to the diagram, they make sense of what they are reading. Abstract concepts are brought to life and vocabulary is supported.
Presentation of graphics in Book 2
The graphics in Book 2 do not fulfil the basic functions of enhancing the meaning of the text or reinforcing learning, as the following examples show.
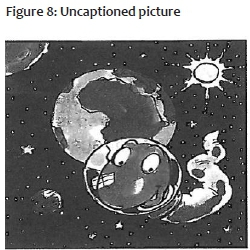
The use of humorous, cartoon-like drawings is very common in this textbook. Figures 8, 9 and 10 appear alongside the accompanying text. They have no captions, titles or labels. Figure 8 accompanies a passage about space, Figure 9 appears alongside a passage about 'What people need for a healthy life', and Figure 10 illustrates a piece of text about 'Food from plants'. Although the illustrations are relevant, the style in which they were drawn results in them confusing readers, rather than adding meaning. They do not portray things as they are in real life, which may well result in young readers failing to understand what is shown, especially when the illustrations are not titled or labelled. A banana has been drawn with a head, a carrot with a necktie and tail, and the moon with a tail and eyes. Such unnecessary departures from reality may detract from the focus of the visual.


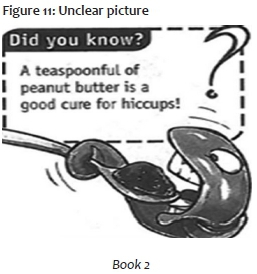
The illustration in Figure 11 is not clear. One cannot really tell whether it represents a human head or a fish or an animal. This undermines the readability of the text. Moreover, a reader would not know what benefits accrue from eating peanut butter just by looking at the drawing. It fails to draw attention or encourage the reader to find out more information about the subject.
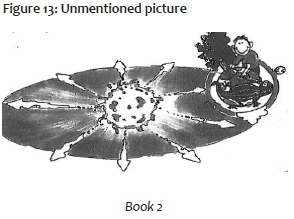
The content of the illustrations in Figures 12 and 13 were neither referred to nor mentioned at all in the accompanying passages. Figure 12, which shows a blood pressure meter (sphygmomanometer), accompanies a text passage about inventions, including the steam engine, telephone and light bulb, but not this item. Moreover, the drawing is not even labelled or captioned. Figure 13 shows a picture of the sun, a man, a plant and an animal. The accompanying text is about the sun, but makes no mention of people, plants or animals, leaving the reader to wonder why they feature in the drawing at all. Instead of complementing and extending the text, the visual information misrepresents reality by suggesting that men, plants and animals are found together with the sun. This would be bad enough in any textbook, and even more so in a science text. According to Mayer (1989), graphics should be supported by text and are only meaningful to the reader if they have this textual support. In these instances, the visuals and text do not support each other.

In summary, Book 2 has major limitations. It contains textual information which might or might not be 'readable' and graphics that have no captions, titles or labels, which may cause the reader to fail to understand captions as a meaningful part of the text. In addition, most graphics in the book misrepresent reality. There is also scant follow-up or absence of follow-up on the graphics, and some graphics are unclear.
Science is a subject that often features difficult language, which it why science textbooks must have appropriate graphics to support the text. If the graphics are poor, then comprehension is hindered and readability lowered. In terms of graphics, Book 1 is more readable than Book 2. The graphics in Book 1 help bring meaning to the text, so that learners can extract meaning from it, whereas those in Book 2 hinder the readability of the text.
Familiarity of content
In analysing the familiarity of the content of the textbooks, I considered whether it deals with things that learners may encounter or use in their daily lives, or which they had learnt in Grade 3 Life Skills. There was, however, the possibility that the learners may have learnt this content in their first language, so that the English terms might still be unfamiliar to them even if the concept might be familiar. When reading material is familiar, it is easier to read and comprehend. The topics in the textbooks were categorised according to three levels of familiarity: very familiar, partially familiar, and unfamiliar or abstract. Table 3 presents the findings of the content analysis.
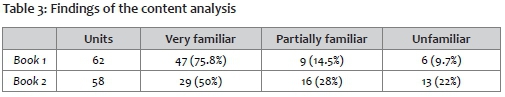
Table 3 shows that Book 1 has 62 units. In an analysis of the familiarity of the content of this textbook, it was found that 75.8% of the topics are very familiar; 14.5 % is partly familiar; and 9.7% is unfamiliar. This means that three-quarters of the content of the textbook deals with things that the learners experience or see every day; for example, trees, animals, buildings, fire, soil, water, and many others. Some content may be considered partly familiar, because although it deals with concepts of an abstract nature, it is a continuation of what the learners had learnt in Grade 3 Life Skills, for example, the content on the topic of space.
Graves and Graves (2003) state that texts with familiar content are more readable than those with unfamiliar content. Familiarity equips readers with the requisite prior knowledge of what they are reading to allow them to make inferences about unfamiliar words and sentences. Meyer (2008) observes that optimal learning occurs when learners understand most of the input (by reading or listening) while being challenged by some new material. Book 1 contains 9.7% new material, including content on deserts, technology and endangered and ancient animals, which represents new knowledge that readers will acquire as they read their textbooks. There should not be too much new material to challenge them, because readers may be overwhelmed and fail to learn anything. Krashen (1985) suggests that input should be one step beyond the knowledge acquirer's current stage of competence. He represents this as i+1 (input plus one). The input i is the current competence and 1 is the most immediate higher stage. If learners read only what they already know, then it means that no learning takes place. The high percentage of familiar information in Book 1 increases its readability, that is, the textbook is readable in terms of content familiarity.
Book 2 contains 50% very familiar content; 28% partially familiar content; and 22% unfamiliar content. This means that half of the content is not very familiar, including topics such as the earth's structure, energy systems, acids, and many others. Since the learners lack prior knowledge of what they are reading, the readability of the textbook is compromised. No attempt was made to increase the readability of Book 2 in terms of familiarity of content, which renders this textbook less readable.
Readability formulae
In addition to content analysis, readability formulae were also used to determine the reading levels of the same two textbooks.
The readability formulae were applied to samples from the Grade 4 natural sciences textbooks to help me answer the second research question: Are the selected natural sciences textbooks set at the appropriate level for Grade 4 learners? The free online Text Readability Consensus Calculator was used to evaluate this. As explained in the literature review, this instrument incorporates seven well-established readability formulae to calculate the average grade level, reading age and text difficulty of sample texts. Applying seven formulae to each sample would potentially increase the validity of the findings.
Stratified probability sampling was used to select the text samples for assessment. According to Denscombe (2007:15), in a stratified sample, "every member of the population has an equal chance of being selected in relation to their proportion within the total population". Random sampling is still done, but on strata that are representative of the whole. The four sections of each textbook constituted the major strata from which the samples were taken. Each section contains various different topics with several units. One unit from each topic in both books was randomly selected by writing down the numbers of all the units in each topic, putting them in a hat and picking them at random. In this way, sixteen samples per book were selected. The Readability Consensus Calculator was then applied to each of the samples to determine the grade level of each.
Presentation and discussion of readability formulae data
Figure 14 summarises the findings of the assessment of the readability of the textbooks using the readability formulae, and Table 4 shows the comparison of the measures of central tendency between the two books.


Based on these results, the reading grade levels of the two textbooks are interpreted as follows:
- Book 1: Grade 6 reading level
- Book 2: Grade 7 reading level
The means of the grade levels of the samples from the two books indicate that Book 2 is qualitatively more challenging than Book 1 and that neither Book 1 nor Book 2 is suitable for Grade 4 learners.
Book 1 readability results
The readability results show that the text is at Grade 6 reading level, which is above the Grade level for which it was written. The Text Readability Consensus Calculator gave a range of grade levels from Grade 3 to Grade 8 for the different samples, which shows how cognitively challenging some of them are.
Book 1 does not have a text sample at Grade 9 level. Two samples are at Grade 8 level; two at Grade 7 level; five at Grade 6 level; three at Grade 5 level; three at Grade 4 level; and one at Grade 3 level. Twelve samples therefore proved to be above the Grade 4 level and one below this level, with only three being pitched at the appropriate grade level.
Book 2 readability results
Book 2 is pitched at Grade 7 level. On sample tested below Grade 4 level and fifteen of them above. The most difficult sample (sample 8) is at Grade 9 level. Five samples are at Grade 8 level; two at Grade 7 level; three at Grade 6 level; and five at Grade 5 level. It is interesting to note that none of the sixteen samples from Book 2 is at Grade 4 level. Eleven samples are pitched at Grade 6 to 9 reading levels, which shows how difficult these samples are.
The readability formulae used to assess the readability of the textbooks differ in terms of variables and the criterion scores used when they were developed, which accounts for the differential reading levels (Reddish 2000). The authors' blurbs in both books claim that they were written for all learners and not specifically for English second language (ESL) readers. If this is the case, the writers might have had first language users in mind, which would pitch the texts at a level that could be difficult for ESL readers. The readability formulae refer to L1 grade levels, which increase the difficulty level for second language learners.
Conclusion and recommendations
The analysis performed on the two textbooks shows that both books are above the intended readers' reading levels. Much of the lack of text readability may be ascribed to vocabulary that is not explained. The authors did not seem to take cognisance of the context of the young users of the textbooks. However, the content analysis of readability factors points to Book 1 being the more readable of the two textbook. Of the four factors considered in the textual analysis, only the technical words compromise this textbook's readability. Most of the technical words in the book are not explained or exemplified, which renders it less readable. On the other hand, the concepts in the textbook are well developed and the graphics serve their purpose of providing visual clues about the text, often communicating ideas more effectively than the text alone could have done. The content in the book is also familiar to the intended readers. Although these three determinants of readability (concepts, graphics and content) are used positively in the texts, the use of undefined and only mentioned technical words compromises the readability of Book 1.
Content analysis established Book 2 to be difficult. All four criteria (technical words, concepts, graphics and content familiarity) indicated that this textbook is not readable. Technical words are not explained, defined or exemplified. The same applies to the concepts used in this book. The graphics do not aid comprehension of the accompanying text and most of the content in the book is unfamiliar to the intended readers. All these factors contribute to the textbook being less readable.
The results of the Text Readability Consensus Calculator show that both books are beyond the reading level of Grade 4 learners. Book 1 is better than Book 2, as it is only two levels above the reading level of the intended readers, while Book 2 is three levels above this level. Based on these results, both books are at the frustration level.
In addition, other factors, such as the degree and amount of exposure to the textbooks and the transitional challenges faced by Grade 4 learners, as explained in the literature review section, may further compromise the readability of the textbooks.
The main focus of this study was to assess the readability of two Grade 4 natural sciences textbooks currently used in South African schools. An overall content analysis yielded data which supports the conclusion that neither of the textbooks is readable for Grade 4 learners in general or the Grade 4 learners in the present study. The textual analysis indicated that both textbooks contain many technical words and concepts which are not explained or exemplified. Technical terms and concepts are an inevitable and integral part of learning about science, and they should be explained and exemplified to support learning.
Having found that the assessed textbooks were not at the reading level of the intended learners, I proffer some recommendations for authors, publishers, teachers and other stakeholders. Authors should consider factors that affect the readability of texts and present content in more readable ways. These aspects include technical words, scientific concepts, graphics and the nature of the content. If they are handled effectively, learners will be able to understand and learn from their textbooks. Authors could include glossaries to provide learners with a reference point for new words, and it might also be a good idea to have downloadable bilingual or multilingual glossaries on the publisher's website. Authors could also provide the meanings of new words in brackets immediately after they are used for the first time, so that readers may readily access their meaning as they read the texts.
Teachers mediate the information contained in textbooks to their learners and are therefore also important stakeholders in this regard. It is suggested that all teachers be trained to evaluate the suitability and readability of textbooks as part of their teacher education or in-service training. There are many textbooks on the market competing for attention, and training teachers to use sound criteria to evaluate textbooks and choose the most appropriate and accessible ones for their (ESL) learners would be of great value. Where teachers realise that the textbooks already in use in their school are beyond their learners' reading level, they need to devise strategies for mediating the content and adapting the material to the appropriate level.
References
Allington RL. 2002. You can't learn much from books you can't read. Educational Leadership, 60(3):16-19. [ Links ]
Armbruster BB, Lehr F & Osborn J. 2003. Putting reading first: The research blocks for teaching reading: Kindergarten through Grade 3. 2nd Edition. United States: Centre for the Improvement of Early Reading/National Institute for Literacy.
Berg BL. 2007. Qualitative research methods for the social sciences. 6th Edition. Boston, MA: Allyn and Bacon. [ Links ]
Burns PC, Roe BD & Ross EP. 1988. Teaching reading in today's elementary schools. 4th Edition. Boston, MA: Houghton Mifflin. [ Links ]
Carrell PL. 1987. Readability in ESL. Reading in a Foreign Language, 4(1):21-40. [ Links ]
Cohen L, Manion L & Morrison K. 2000. Research methods in education. 5th Edition. London: Routledge/Falmer. [ Links ]
Conzales P, Guzman JC, Partelow L, Pahlke E, Jocelyn L, Kastberg D & Williams T. 2004. Highlights from the Trends in International Mathematics and Science Study (TIMMS) 2003, Washington, DC: US Department of Education, National Centre for Educational Statistics. [ Links ]
Dale E & Chall SJ. 1949. The Concept of Readability. Elementary English, 26:19-26. [ Links ]
Denscombe M. 2007. The good research guide for small-scale social research projects. New York, NY: Open University Press. [ Links ]
DuBay WH. 2004. Impact information study on the principles of readability. [Retrieved 16 February 2012] http://www.impact-information.com/impact_info/readability02.
Gerring J. 2004. What is a case study and what is it good for? American Political Science Review, 98(2):341-354. [ Links ]
Graves MF & Graves BB. 2003. Scaffolding reading experiences: Designs for student success. Norwood, MA: Christopher-Gordon. [ Links ]
Howie S, Venter E, Van Staden S, Zimmerman L, Long C, Sherman V & Archer E. 2008. PIRLS 2006 Summary report: South African children's reading literacy achievement. Pretoria: Centre for Evaluation and Assessment. [ Links ]
Kondur J. 2006. Using the part of speech structure of text in the prediction of its readability. Unpublished MA thesis. Arlington, TX: University of Texas. [Retrieved 13 November 2008] http://proquest.umi.com/pdqweb?did=1216761731&sid=1&Fmt=2&clientld=46449&PQT=309&VName=PQD. [ Links ]
Kasule D. 2011. Textbook readability and ESL learners. Reading & Writing, 2(1):63-76. [ Links ]
Krashen SD. 1985. The input hypothesis. London: Longman. [ Links ]
Langhan DP. 1993. The textbook as a source of difficulty in teaching and learning. A final report of the Threshold Project. Pretoria: HSRC Publishers. [ Links ]
Lederman L. 2008. Science education and the future of humankind. Science News, 173(16):1. [ Links ]
Lee CD & Spratley A. 2010. Reading in the disciplines: The challenges of adolescent literacy. New York, NY: Carnegie Corporation of New York. [ Links ]
Lisichkin GV. 2007. The teaching of the natural science disciplines in the schools. Russian Education and Society, 49:23-32. [ Links ]
Mankomo P. 1990. Transforming the role of English in black schools. Language Projects Review, 5(3):22-28. [ Links ]
Mayer RE. 1989. Systematic thinking fostered by illustrations in scientific text. Journal of Educational Psychology, 81(2):240-246. [ Links ]
Meyer H. (2008). The pedagogical implications of L1 use in the L2 classroom. Maebashi Kyodai Gakuen College Ronsyu, 8:147-159. [ Links ]
Mikki J. 2000. Textbook: Future of the Nation. Frankfurt: Peter Lang. [ Links ]
Mji A & Makgato M. 2006. Factors associated with high school learners' poor performance: A spotlight on mathematics and physical science. South African Journal of Education, 26(2):253-266. [ Links ]
Motshekga A. 2009. Statement by Minister of Basic Education on the curriculum review process to the National Assembly on 5 November 2009. [Retrieved 3 September 2013] http://www.education.gov.za/ArchivedDocuments/ArchivedSpeeches/tabid/459/ctl/Details/mid/954/ItemID/2937/ Default.aspx.
Plano Clarke VL & Creswell JW. 2008. The mixed methods reader. Thousand Oaks, CA: Sage. Readability Formulas. nd. Free Text Readability Consensus Calculator. [Retrieved 4 April 2012] http://www.readabilityformulas.com/freetests/six-readability-formulas.php.
Reddish J. 2000. Readability formulas have even more limitations than Klare discusses. Journal of Computer Documentation, 24(3):1855-1873. [ Links ]
RSA DBE (Republic of South Africa. Department of Basic Education). 2011. Curriculum and Assessment Policy Statement. Pretoria: Government Printer. [ Links ]
RSA DoE (Republic of South Africa. Department of Education). 2001. Draft Revised National Curriculum Statement for Grades R-9 (Schools) for Natural Sciences. Government Gazette, No 22559. Pretoria: Government Printer. [ Links ]
RSA DoE (Republic of South Africa. Department of Education). 2008. National Reading Strategy. Pretoria: Government Printer. [ Links ]
Singer M & Tuomi J. 2003. Selecting instructional materials. A guide for K-12 Science. Technical report. Washington, DC: National Research Council. [ Links ]
Swanepoel S. 2010. The assessment of the quality of science education textbooks. PhD thesis. Pretoria: University of South Africa. [ Links ]
Taylor N. 2008a. It's OBE, but not as it should be. Mail & Guardian, 15 April.
Taylor N. 2008b. What's wrong with South African schools? [Retrieved 29 September 2013] http://jet.org.za/events/conferences/What%20works%20in%20school%20development/Papers/Taylor%20Whats %20wrong%20with%20SA%20schools%20JET%20Schools%20Conf%20final.pdf.
Waring R & Nation ISPP. 2004. Second language reading and incidental vocabulary learning. Angles on the English-speaking World, 4:97-110. [ Links ]
Wieman C. 2007. Why not try a scientific approach to Science Education? Change, September-October 2007:9-15.
Yin RK. 2003. Case Study Research: Design and Methods. Thousand Oaks. CA: SAGE Publications. [ Links ]
Zamanian M & Heydari P. 2012. Readability of Texts: State of the Art. Theory and Practice in Language Studies, 2(1):43-53. [ Links ]
1. The issue of learning to read in English as a second language is not included in the article, as that is a topic in and of itself.

