


Servicios Personalizados
Articulo
 Inglés (pdf)
 Articulo en XML
 Referencias del artículo
Indicadores

Links relacionados
-
 Citado por Google
 -
 Similares en Google
Compartir

 Permalink
Yesterday and Today
versión On-line ISSN 2309-9003
versión impresa ISSN 2223-0386
Y&T no.13 Vanderbijlpark jul. 2015
HANDS-ON ARTICLES
Teaching and learning history through thinking maps
Marj BrownI; Charles DugmoreII
IRoedean School (SA) MABrown@roedeanschool.co.za
IIRoedean School (SA) CDugmore@roedeanschool.co.za
ABSTRACT
The use of thinking skills is gaining ground in many South African schools and the challenge is how to use these tools so that they really assist learners without becoming prescriptive or forced. Over six months, Marj Brown and Charles Dugmore have been using thinking maps with various classes, and have found their worth is palpable. Many of the maps used come from the Habits of Mind (HoM) (Costa & Kallick, 2008)andThinkingMaps (Hyerle &Yeager, 2007), andareusedin conjunction with HoMapproaches to a task, while others have been devisedby the authors, or adapted from the original maps to suit the task. The maps have been used by pupils to preparefor essays, short tasks in class, as well as to summarise or understandconcepts, politicalstands, cause and effect, the flow of events, with examples at each stage, and to compare and contrast people, and groups, or events. The presentation is offered as a way of inspiring possibilities in learners to learn by mindmapping History so that it does not become a series of facts to be rote learnt.
Keywords: Thinking maps; History teaching and learning; Circle Map; Double Bubble Map; Tree Map; Brace Map; Flow Map; Multi- Flow Map; Bridge Map.
Introduction
The use of thinking skills is gaining ground in many South African schools and the challenge is how to use these tools so that they really assist pupils without becoming prescriptive or forced.
Over the past eight months, History teachers Marj Brown and Charles Dugmore have been using a range of graphic organisers including David Hyerle and Chris Yeager's Thinking Maps (Hyerle & Yeager, 2007) with various classes, and have found their worth is palpable. These Thinking Maps are used in conjunction with Habits of Mind (HoM) approaches to a task (Costa & Kallick, 2008), while others have been devised by the authors, or adapted from the original maps to suit the task. The thinking maps each represent a different cognitive skill and, thus, are not multi-dimensional in approach. They are useful building blocks to a final approach which may use a combination of skills, for example, cause and effect and relationships at the same time. Although the Thinking Maps approach is prescriptive and requires constant use of their eight key maps, allowing for little if any modification of the maps, we have taken a more eclectic approach. We have used the maps in a more creative way, at times using them as intended and, at other times, modifying them or developing entirely new thinking maps, which do combine different factors involved in an event, which has produced interesting results.
Why use Thinking Maps?
The maps have been used by learners to prepare for essays, short tasks in class, as well as to summarise or understand concepts, political stands, cause and effect, the flow of events with examples at each stage, and to compare and contrast people and groups, or events. This article is offered as a way of inspiring possibilities in learners to learn by mind-mapping History so that it does not become a series of facts to be learned by rote and to access a deeper level of learning that makes use of non-textual information to make sense of historical information.
In the sections to follow, reference will be made to the Circle Map, Double Bubble Map, Triple Bubble Map, Multi-Bubble Map, Tree Map, Brace Map, Flow Map, Multi-Flow Map and Bridge Map and the manner in which they can be utilised in the teaching and learning of History. Roedean, an Independent School for girls in Johannesburg, uses all of these eight Thinking Maps prescribed by Hyerle and Yeager (2007).
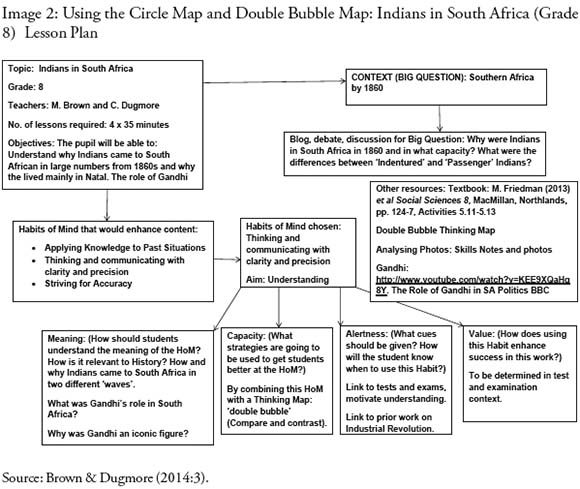
The Circle Map, or defining in context
When teaching at a grade 8 level, this map is useful to help pupils synthesise information and contextualise it. Earlier this year, the learners learned about the arrival of indentured and passage Indians, and studied the life of Gandhi in SA. As part of this study, we looked at the influences in his early life and his experience in SA that shaped him and his policy of Satyagraha. We asked the learners as a summary of this section, to do the Circle Map. They placed Gandhi and his policies/beliefs in the centre of the circle, and the influences on the outside, with the latter representing his context.
The Double Bubble Map, or compare and contrast
In a later, separate exercise, we used the double bubble map to compare and contrast the passage and indentured Indians. The circles in the middle show the similarities and the circles on the outside the differences.

When using the Circle Map and Double Bubble Map, the results showed that the learners who learn better from visualisation definitely benefitted from this graphic representation of the information.
The Habits of Mind lesson preparation for this section appears in Image 2 below.
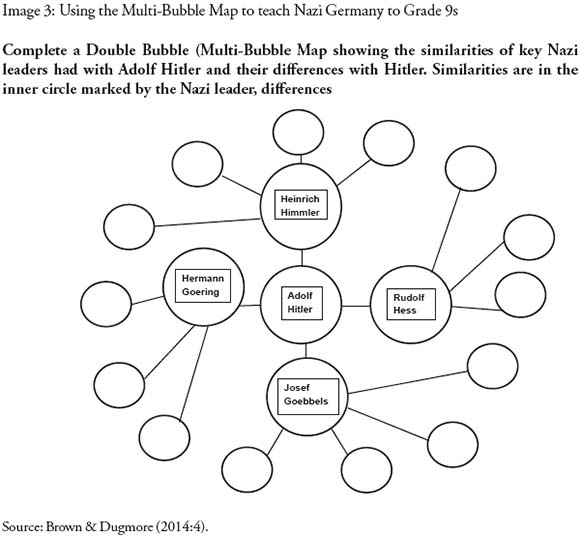
The Double Bubble Map is very useful for preparation for compare and contrast essays - and the latter are used widely in the Grade 12 syllabus - especially in the "Civil Society Protests" section. The learners have been asked to compare and contrast different Civil Society Movements such as the Womens Movement and the Civil Rights Movement. This is helpful, but we found that the pupils needed extra bubbles as well, in certain instances, and developed a Triple Bubble Map, or more, to show the overlaps of the different movements. We also asked the Grade 9 learners to indicate similarities between key Nazi leaders and Hitler while also showing their unique attributes, creating a Multi-Bubble Map. The result is seen below in Image 3.
Flow maps or sequencing: The flow map and the multi-flow map
In order to teach the Ante Matric (Grade 11) theme, "The cause and effects of the Russian Revolution", we began by using a flow map to show sequencing of the link between the 1905 revolution, the February Revolution and the October Revolution. The learners could also add aspects of each stage to the blocks below the main block, and, thus, create as many sub-headings as needed. This is a useful map for preparing for an essay where a clear understanding of cause and effect is required. Alternatively, we could have used the multi- flow map, where the context, the main event, and the implications of the event can be arranged. This map is ideal for studying for an extended writing essay, as these are the three aspects learners have to cover around an event: context, nature and effects.
We also developed a graphic visualisation of the different Russian Revolution political parties, to help Grade 11 learners understand the different political and economic views of these parties. For this we used an X and Y axis, and plotted the parties onto it. The X axis represented economic beliefs and the Y axis represented political beliefs. We then encouraged the learners to plot the various political parties across the ideological spectrum from the "Kadets" (Constitutional Democrats) on the right to the Bolsheviks on the far left. This was not linear however, and the learners had to think about political and economic ideology.
The Brace Map
Another useful map is the Brace Map. It is similar to a concept hierarchy where a single concept then "embraces" (using an embracement bracket) several "sub-concepts" or subsidiary concepts which are, in turn, also further sub-divided into supporting concepts, from left to right, across the page. The concepts have to be complete, including all possible concepts and excluding none. For example, the concept "North America" would embrace "Canada, USA and Mexico". Each of these concepts could then be further sub-divided into provinces or states so that all 50 states in the USA would appear after an embracement bracket and all the corresponding provinces would appear after Canada and Mexico.
The Tree Map
This is a useful map for classification purposes but, unlike the Brace Map, a concept is "branched off', from the top to the bottom of the page, into subsidiary concepts below it. It is similar to the Brace Map and a concept hierarchy but it only provides some examples and does not offer a complete range of all the subsidiary concepts (and could feasibly exclude many such subsidiary concepts). For example, the concept "Nouns" when "branched off could include "ball, cat, grass, sky" below it and each of these nouns could, in turn, be "branched of" below ("ball" could be sub-divided into "round", "football", "billiards" and so on).
The Bridge Map
The Bridge Map takes a concept and bridges or links this to another apparently unrelated concept by finding common ground between these concepts using a link referred to as a "relating factor". For example, "Man" and "dog" can be linked using the term "pet" as a "relating factor". The Industrial Revolution can be explained with a series of such bridge maps so that "cotton gin" is linked to "demand for slave labour' while "Spinning Jenny" is linked to "demand for female labour" and so on.
Applying the maps
In all these cases, graphic organisers and the more formal Thinking Maps were used eclectically to aid understanding in the teaching and learning process. We found that the learners enjoyed using these and understood the lessons better than using text alone. Our assessments suggest that learners remembered non-textual representations better and performed well in those sections where these were used. In the process, we have enabled the learners to become familiar with the use of non-textual representations of ideas and historical events so that should we introduce a more rigorous approach to Thinking Maps approach in the future, they will have already "bought into" their use and seen their value in improving their performance.
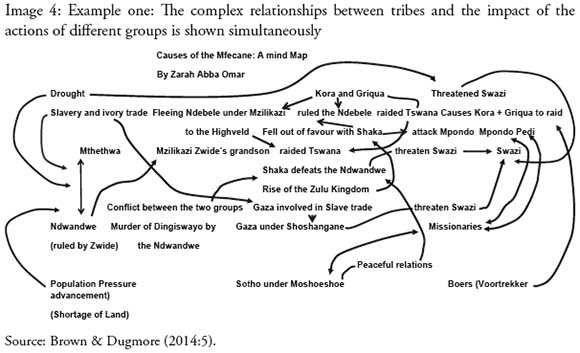
Finally, we decided to assess both the graphic organisers and the Thinking Maps used by the Grade 10 leaners to represent visually their essays on the causes of political instability or "upheaval" in Southern African in the late 1700s and early 1800s (in what used to be called the Mfecane). These leaners were given the task of synthesising a range of causes in a critical way. They had to respond to a topic that stated: "The Zulu Kingdom was just one of several important African states that had an impact on the instability in Southern Africa in the period 1750 to 1835". Most began by considering the argument that the Zulus were the only or the main cause of the instability (the so-called Shaka as Mfecane Motor argument) and then subjected this to a critique. They then systematically considered the role that other "African states" played.
In the process, the Grade 10 learners noticed that the Ndwandwe under Zwide and the Mthethwa under Dingiswayo were engaged in conflict with one another before the rise of Shaka and the Zulu Kingdom and that it was precisely these wars that Shaka emerged as a military commander. Many of the innovations that are associated with Shaka since as fighting barefoot, the use of the short stabbing spear and the bull-and-horns formation were actually earlier inventions that Shaka refined or adapted. Far from being the "cause" of the Mfecane, Shaka and his Zulu warriors were themselves, the "effects" of earlier causes.
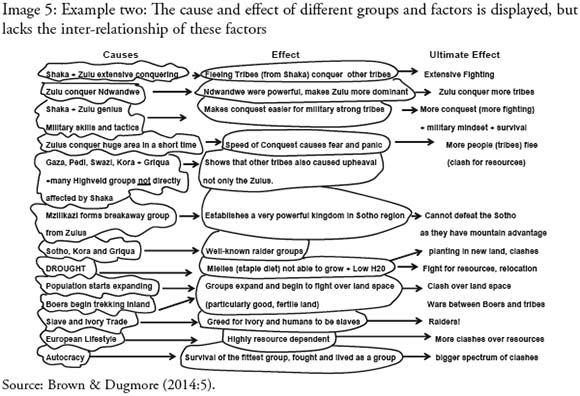
Secondly, the more astute learners also brought in broader factors such as the role played by the environment, for example droughts and trade (ivory, cattle and, later, slaves) with the Portuguese at Delagoa Bay. This introduced a separate vector or cause of instability in the interior. Thirdly, there were many other tribes that also engaged in violence in the interior independently of the Zulus or their neighbouring "tribes". Fourthly, the Boers, Griquas and Kora raiders along the Orange River brought in a separate cause that originated far from the Zulu Kingdom and eventually intersected with it after Shaka's death (under Dingane who engaged with the Voortrekkers at the Battle of Blood River). Finally, Shaka's attacks also set off a "chain reaction" of violence in the interior, notably in the form of Mzilikazi's Ndebele (although more capable learners noted that the Ndwandwe may have caused this separately from Shaka). The resulting essays were highly complex as each had to capture at least five different vectors of causality at different times. The learners were given eight 35-minute lessons to research and write up their essays in which they had to also insert references and a full bibliography. They submitted the final product using software that checks for plagiarism.
The learners' responses
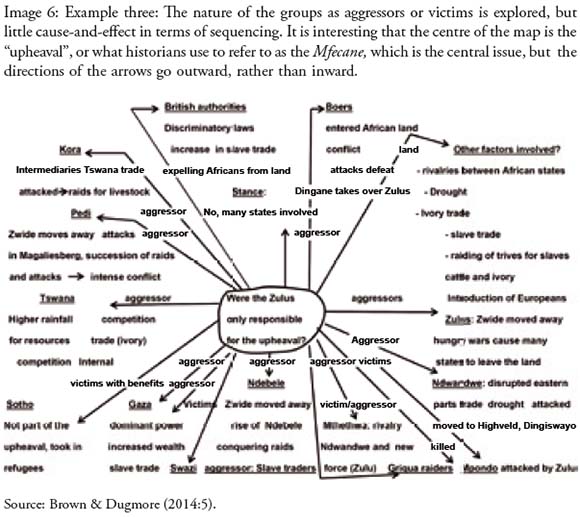
We then asked the Grade 10 learners to take their completed essays and represent them graphically on a sheet of paper, by hand. They were asked to show cause and effect in these mind maps as well as relationships between tribes. Besides this request, they were not given any guidance and left to their own devices although many checked and compared their results with their peers. The result was a fascinating array of different approaches. Many, it should be noted, did not opt for the Thinking Maps approaches but chose graphic organisers such as a simplistic Mind Map with "Instability" in the centre with lines linking to a range of causes. Interestingly, the arrows often projected outwards towards the causes rather than from them and with no links between the causes themselves. This suggests that they had not taken on board the Thinking Maps with which they were familiar and opted instead for a simple diagram (also known as a Spider Map). However, the more able learners produced marvellously complex and thoughtful Thinking Maps that mostly followed the Flow Map that represented sequencing and a few opted for variations on the Multi-Flow Map for cause and effect and several even preferred the Tree Map for classification. The variety suggests that they were thinking carefully about their work and customising it rather than following a prescriptive approach. Furthermore, they adapted the Thinking Map with all kinds of arrows and other graphic representations to create unique, highly dynamic and thoughtful non-textual representations of their essays. (See the examples below in Images 4 to 6).
Conclusion
Our eclectic approach had given learners the confidence to experiment with their own forms of Thinking Maps that produced a better, more accurate version than Hyerle and Yeagers (2007) versions would have produced. The lesson we take from this experience is while prescription has its place, learners are too diverse in their thinking to force them into one of eight "channels" as the Thinking Maps are presented and that our subject, History, is too complex to be accommodated in the straitjacket of a single Thinking Map. Furthermore, if we want learners to think critically and creatively about their own writing and thinking processes to promote adaption, modification, creativity and complexity, it necessarily requires a more flexible, eclectic approach in the teaching of Thinking Maps than the authors prescribe.
References
Brown, M & Dugmore, C 2014. Teaching and learning History through Thinking Maps (Paper, South African History Teachers 28th Annual Conference, Wits School of Education, 10-11 October): 2-7. [ Links ]
Cary, NC 2011. Thinking Maps Incorporated. North Carolina. [ Links ]
Costa, AL & Kallick, B 2008. Learning and leading with habits of mind: 16 Essential characteristics for success. Alexandria: Association for Supervision and Curriculum Development. [ Links ]
Hyerle, D & Yeager, C 2007. Thinking Maps®: A language for learning training/resource manual, K-12. [ Links ]

