


Servicios Personalizados
Articulo
 Inglés (pdf)
 Articulo en XML
 Referencias del artículo
Indicadores

Links relacionados
-
 Citado por Google
 -
 Similares en Google
Compartir

 Permalink
South African Journal of Economic and Management Sciences
versión On-line ISSN 2222-3436
versión impresa ISSN 1015-8812
S. Afr. j. econ. manag. sci. vol.27 no.1 Pretoria 2024
http://dx.doi.org/10.4102/sajems.v27i1.5103
ORIGINAL RESEARCH
External shocks' effects on the co-movements of currency and stock returns in three Southern African Development Community states
Thobekile QabhobhoI; Syden MishiI; Ewert P.J. KleynhansII; Edson VengesaiIII; Ongama MtimkaIV
IDepartment of Economics and Economic History, Faculty of Business and Economic Sciences, Nelson Mandela University, Gqeberha, South Africa
IISchool of Economic Sciences, Faculty of Economic and Management Sciences, North-West University, Potchefstroom, South Africa
IIIDepartment of Economics and Finance, Faculty of Economics and Management Sciences, University of the Free State, Bloemfontein, South Africa
IVDepartment of History and Political Studies, Faculty of Humanities, Nelson Mandela University, Gqeberha, South Africa
ABSTRACT
BACKGROUND: Although numerous researchers have discovered a negative association between stock-market returns and changes in exchange rates, the literature does not address how external shocks may alter these correlations.
AIM: This article investigates the risk synchronisation between stock returns, exchange-rate returns, geopolitical risk (GPR), and global economic policy uncertainty (GEPU) concerning countries within the Southern African Development Community (SADC).
SETTING: The SADC countries over the period February 2005-August 2021.
METHODS: The wavelet techniques were used to address the study's objectives.
RESULTS: The bivariate results show that there was a positive interdependence between the stock market and the currency market in Botswana and Mauritius from 2007 to 2012. In South Africa, there is always significant co-movement between the two markets. The partial wavelet shows that, while both increasing GPR and GEPU influence the correlation between stock returns and exchange-rate returns, GPR has a greater impact than GEPU. Finally, the wavelet multiple correlations analysis reveals that the Botswana exchange-rate reaction to shocks is indeterminate, with the ability to lead or lag in terms of how the SADC economies respond to shocks across all-time scales.
CONCLUSION: The findings from the study imply that investors should watch for changes in the GEPU, particularly the GPR, if they are concerned about the stock markets in Botswana, Mauritius, and South Africa.
CONTRIBUTION: This is the first study to evaluate the conditional effect of external shocks on the co-movement of currency returns and stock returns in SADC countries using wavelet techniques.
Keywords: external uncertainty shocks; stock returns; exchange rates; wavelets; SADC.
Introduction
Significant co-movement and spill overs between and within asset classes have become common phenomena in the era of globalisation of the economy and the financial sector (Athari & Hung 2022; Sahabuddin et al. 2022). Global financial integration has seen prominent levels of capital mobility (Abiad, Leigh & Mody 2009), making national borders significantly less relevant and exchange-rate controls by states extremely limited in effectiveness. According to Chinn (1989), as equity markets get more integrated into the global economy, they become more interconnected and experience significant international financial flows. As a result, equity markets have a bigger impact on the exchange rate. Given that equity markets have the propensity to experience considerable pricing errors, this influence may assist to explain some of the excess volatility in foreign exchange markets (Campbell & Shiller 1987). By including equities assets in investors' portfolios, Sarantis (1987) enhanced Branson's (1976, 1977) portfolio-balance model of exchange-rate determination, achieving findings that were superior to those of the original specification. In-depth empirical research on the relationship between stock-price returns and exchange-rate movements has produced conflicting results regarding directional causality (Inci & Lee 2014; Javangwe & Takawira 2022; Liang, Lin & Hsu 2013; Ocran 2010; Raji, Ibrahim & Ahmad 2017; among others). Similarly, empirical research on the dynamic relationship between stock and currency market volatility yields mixed results. Early research, such as Jorion's (1990), claimed that changes in exchange rates have little bearing on the volatility of stock returns, but later research (for instance, that of Dumas & Solnik 1995; Lin 2012; Roll 1992) found a considerable correlation between the two.
In more recent years, Javangwe and Takawira (2022) examined the relationship between the stock market and exchange rate in South Africa, using quarterly data for the period 1980-2020. Their findings demonstrated that the variables had a long-term link. These also showed a negative correlation between stock-market activity and changes in exchange rates. This corroborates Moore and Wang's (2014) analysis of the dynamic relationships between stock returns and exchange-rate volatility, concluding that stock prices react oppositely to a decline in a country' local currency level. They claim that local currency depreciation increases the appeal of domestic businesses by expanding their international trade, which, in turn, increases foreign investment in the home market. In the end, stock markets will react to the increase in cash-flow, driving up the price. This result is in line with findings of Adjasi, Biekpe and Osei (2011), Boako, Omane-Adjepong and Frimpong (2016), and Zhao (2010). Some researchers were unable to identify any meaningful connection between the two variables.
Although many researchers have found a negative correlation between stock-market returns and changes in exchange rates, the literature does not address the topic of how external shocks may affect the correlations between stock-market returns and exchange rates. Therefore, the current study investigates this occurrence in three Southern African Development Community (SADC) economies (Botswana, Mauritius & South Africa), based on the availability of data. The economies of these countries, which have reasonably mature stock markets, are among the strongest in the region (Bundoo 2017). External uncertainty shock variables are proxied by the global economic policy uncertainty (GEPU) and geopolitical risk (GPR) indices. In essence, this approach to stock co-movements pushes the knowledge boundaries further in terms of its practical relevance in understanding stock prices from new perspectives. This applies both in terms of the methodology and its geographic scope, that is South Africa.
The high volatility of the region's stock and currency markets is made worse by the fact that countries are dealing with a prominent level of uncertainty because of international tensions, terrorist attacks, GPR, and economic uncertainty on a global scale. The ongoing effects of both the pandemic and Russia's invasion of the Ukraine negatively affected the world economy. The global financial environment is strained due to higher-than-anticipated inflation, particularly in the United States and key European nations (Umar et al. 2022). This has seen central banks in both developed countries and developing and emerging markets increase interest rates between 2022 and 2023.
Increased GPR has historically been associated with negative effects on global economic activity. This is because the resultant armed conflicts destroy material and human resources, divert resources to less productive uses, obstruct financial and trade flows internationally, and disrupt supply networks globally. At the time of writing, for instance, the war in Ukraine had caused rising food prices around the world, due to that country's role as a supplier of grain and other staple food exports to the rest of the world, including the SADC region. A lack of knowledge about the potential effects of unfavourable geopolitical developments could limit demand by discouraging businesses from investing in new initiatives and hiring personnel, eroding consumer confidence, and tightening financial conditions. There are also indirect economic consequences that arise from GPR factors including those arising from coordinated responses to parties in conflict. Economic sanctions against parties in conflict have significant ramifications for not just supply chains (Vuola 2015), but also broader economic activities in key regions and may cause crises of global proportions. This has been the case, given the rapid disinvestment in Russia as a result of sanctions, and the consequent weaponisation of energy supplies from Russia.
Following a crisis, many different nations experience frequent short-term economic fluctuations. This short-term instability constrains the economy's ability to expand in several ways. High and sustainable economic growth requires a stable macro-economic environment. The reasons behind transient economic volatility should be closely explored if sustained economic progress is to be achieved. Uncertainty in economic policy, among other things, has a considerable detrimental impact on the growth of a sizable economy (Parsons & Waldo 2022). This is primarily shown by the fact that governments routinely adopt policies to aid in economic recovery, despite the knowledge that doing so may exacerbate macro-economic oscillations or even have the opposite effect of what was intended.
In the current study, a novel technique in financial economics application, bi-wavelet is utilised to represent the co-movements of stock-market returns and exchange-rate returns to meet the present study's objective. A partial wavelet was used to show how a third variable - the external shock - could conditionally affect these co-movements. Wavelet multiple correlations (WMC) were applied to show simultaneous effects.
This study presents two different viewpoints on the connection between stock-market returns and currency returns. Firstly, it investigated how the relationship between stock-market returns and currency returns varies with time and frequency in a few selected SADC economies using bi-wavelet, partial wavelet, and WMC. Time-frequency analysis is given less attention in the existing literature examining the relationship between stock-market returns and currency returns, which may affect the results when analysing this phenomenon. With the use of wavelet analysis, it is frequently possible to identify the dominant modes of variability in a time series and to track how the modes evolve over the course of time.
The inherent complexity of time-series analysis has, however, expanded the time-frequency domain. Therefore, in this inquiry, bivariate, partial, and WMC are essential. Bivariate wavelet coherence depicts the correlation between two variables, whereas partial wavelets display the co-movements between two variables relative to a shared dependency. Multiple variables' wavelet transformation coherence (WTC) is as a result ideal for WMC. Using bivariate and partial wavelet analysis, the lead-lag correlations in various time and frequency domains are investigated. By doing this, the study further controls for any potential interdependence and learns when and how often two variables lead or lag one another. The WMC is also used to evaluate how well all the variables for each SADC economy are simultaneously integrated. For combinations of more than two variables, the WMC will be utilised to identify the leading and lagging variables in relation to the scales to provide a comprehensive picture of the nexus. While accounting for external uncertainty shocks, emphasis is also placed on the long-term link between exchange-rate returns and stock-market returns.
The remaining sections include the literature review, methodology, findings, analysis, and conclusions.
Literature review
Owing to the desire of many countries' economies to become more integrated with the global economy, researchers and policymakers have concentrated on issues concerning Economic Policy Uncertainty (EPU), the effects of various economies on one another, the global financial crisis, and geopolitical upheavals (Baker, Bloom & Davis 2016; Liu, Zheng & Drakeford 2019; Rezaei & Norouzi 2019). A change in governmental economic policies may cause instability, which is known as EPU. This may cause significant decisions related to employment, investment, consumption, corporate savings, and other economic considerations to be postponed or changed (Parsons & Krugell 2022). Therefore, the economies bear the effects of economic instability (Haidarpour & Pourshahabi 2012). It is possible to measure the EPU index in several ways (Al-Thaqeb, Algharabali & Alabdulghafour 2020). The first approach involves researching stock-market volatility, which determines how much volatility will exist over a specific period within relevant horizons.
Various public and economic reporting reviews, as well as newspaper pieces, are the foundation of another approach. The EPU index can be calculated by counting and analysing the number of phrases, heavily associated with uncertainty, used in news articles, economic reports, and other public publications. Additionally, all tweets, including the phrases 'economics' and 'uncertainty' are considered, while creating this index (Baker et al. 2016). Acquiring and researching the index is intended to bring investors' economic choices and the implementation of future economic policy into context. By weighing the EPU indices of the 16 developed countries worldwide, the GEPU index is produced. These 16 countries' Gross domestic products (GDPs) account for almost 70% of the global GDP. It shows the level of economic anxiety and investor confidence in economic indicators for possible investment (Fang et al. 2018). Another essential element that leads to research in economics and finance literature, is GPR.
Flint (2017) defines GPR as any form of power confrontation, which includes risks associated with armed conflict, terrorist attacks, and disputes between and within governments that cannot be settled by democratic and peaceful means. According to Zhang and Hamori (2022), GPR arises when more armed conflicts or political unrest in a certain area hurt the regional economy or even the global economy. For instance, terrorism or war may result in higher costs, declining earnings, or a sluggish global economy. An illustration would be the increase in energy costs brought on by Russia's invasion of the Ukraine, which ultimately led to inflation. According to Balcilar et al. (2018), GPR has the capacity to change business cycles, obstruct investments, and, as a result, influence the economy of the concerned country. These may arise directly because of the occurrence of the risks, or indirectly, as a result of the responses to them by state and non-state actors. Caldara and Iacoviello (2022) compared the EPU and GPR indices and found that the GPR index captures events that are more exogenous to business and financial cycles and may worsen economic instability.
The stock-market returns of any economy can theoretically be affected by GEPU in a variety of ways. Firstly, economic actors' decisions about employment, consumption, savings, and investments are very susceptible to changes in economic policy (Arouri et al. 2016). Such a factor influences investors' behaviour, which may have an impact on stock-market performance. Secondly, shifts in capital flows into and out of the economy could result from the unpredictability of global economic policy. As a result, fluctuations in capital inflows and outflows may impact the performance of the stock market. Thirdly, oil prices and uncertainty in global economic policy are linked (Kang & Ratti, 2013; Kang & Ratti, 2015; Kang et al., 2017a, 2017b). Oil prices are a significant economic element, and therefore changes in economic policy at the international level may have an impact on stock prices. Fourthly, domestic economic instability brought on by unpredictability in global economic policy could result in abrupt changes in variables, such as inflation, interest rates, and currency rates. It is, therefore, reasonable to assume that changes in inflation, interest rates, and exchange rates could impact stock values by influencing corporations' discounted cash flows (Arouri et al. 2016). Therefore, it is thought that uncertainty in macro-economic fundamentals may have an impact on stock values. Fifthly, sensible investors might decide against making more investments in an asset because they believe that ambiguity in economic policy could perhaps represent future uncertainty. Because of such reflections, stock-market performance may suffer.
Geopolitical unrest could affect the stock market by influencing investors' sentiments. Terrorist attacks, according to Eldor and Melnick (2004) and Kollias et al. (2011), lead to a drop in stock markets. Similar to this, Döpke and Pierdzioch (2006) note that the stock market has a marked response to various political events (e.g., elections, international incidents and political scandals). According to anecdotal evidence, the terrorist assault on 11 September 2001 caused a significant decline in the stock markets around the world. Similar to this, during the heightened anxiety of the Iraq War and the Iraq Invasion in 2002/2003, the US stock market, particularly the S&P 500, saw a steep fall. Additionally, amid the Ukraine conflict, the annexation of Crimea, and Russia's sanctions in 2014, Russian stock indices experienced large declines. The trade war between China and US in 2018 demonstrated the importance of GPR and led to a decrease in the two biggest Chinese stock markets (De Nicola, Kessler & Nguyen 2019). Such evidence heightens the need to quickly determine how the stock market synchronised to GPR responses.
Numerous empirical studies have been conducted in this area of study to answer the question of what effects external variables, such as uncertainty in global economic policy and GPRs (terrorist attacks, wars, revolutions, and political instability), have on the stock market and currency markets. In ten developed and emerging nations, Krol (2014) studied how general economic and policy uncertainty affected exchange-rate volatility. In contrast to EPU, the author discovered that general economic uncertainty had far less of an effect on exchange-rate volatility. The author also concluded that domestic EPU shocks, as well as US-EPU shocks have an impact on the exchange rate in developed economies well integrated with the US economy. In contrast, solely domestic EPU influences the exchange rate in developing nations with less integration with the US. Yin et al. (2017) used the quantile regression test to investigate the causal connection between EPU and the exchange rate. They discovered that when quantile regression is applied, the association is more significant. Furthermore, Chen, Du and Tan (2019) concluded that EPU had a heterogeneous impact on the exchange rate in China after using quantile regression to look at the impact of EPU on the exchange rate in China.
Several research studies, including Alqahtani, Bouri and Vo (2020), Balcilar et al. (2018), Cheng and Chiu (2018), Hoque, Wah and Zaidi (2019), and Lehkonen (2019), examine how stock markets react to GPR. For instance, Hoque et al. (2019) provide evidence that geopolitical unrest affects stock markets differently, depending on the nation. The differences in the extent to which GPR affects the stock markets of countries might be construed as related to perceptions about the susceptibility of stock markets in various countries to political risks, given established views about the resilience of institutions in those countries. For instance, developing and emerging markets tend to be preferred when there are generally stable conditions for investment, while developed country stock markets are generally regarded as safe havens in times of instability. For example, Balcilar et al. (2018) discovered that stock returns in BRICS nations are negatively impacted by news regarding geopolitical tensions. The study also shows that, in terms of returns and volatility, the Russian stock market is the most vulnerable to geopolitical concerns.
Additionally, Cheng and Chiu (2018) show that the stock market's reaction to geopolitical shock varies across the nation, which may be explained by the severity of the danger and the extent of the public outcry. Empirical validation that global GPR has a large predictive potential in Gulf Cooperation Council markets is provided by Alqahtani et al. (2020). It may, therefore, be claimed that stock markets are responsive to GPR according to the review of earlier work.
Wavelet approaches application to financial economics and investment is gathering momentum, recent examples being Michis (2022), Gurdgiev and O'Riordan (2021), AlNemer, Hkiri, and Khan (2021), modelling the co-movements in financial markets. Using a wavelet-based estimator of the partial correlation coefficient, Michis (2022) investigated the relationship between stock-market returns. The ability to measure the relationships between stock-market returns over several time scales (short-term, medium-term, and long-term) while controlling for broader stock-market movements known to artificially inflate Pearson correlation estimates is a fundamental characteristic of this coefficient. Using the bi-wavelet technique, Gurdgiev and O'Riordan (2021) investigated the impacts of spill over and contagion between stock markets in advanced economies and those in the BRICS. They reported both contagion spreading from BRIC markets to advanced economies' markets and spill overs that propagate from shocks in advanced economies' markets to those in BRIC markets. Bivariate and multivariate wavelet methods were used by AlNemer, Hkiri, and Khan (2021) to study the relationship between investor sentiment and inter-cryptocurrency prices. Their research showed that investor sentiment has a great ability to forecast price fluctuations in cryptocurrencies over time and across scales. The question of whether the co-movements between the stock market and currency market are affected by GPR and GEPU, however, remains unanswered, which further motivates the investigations of the current research.
As an extension, this study employed three wavelet methods (the bi-wavelet, partial wavelet, and WMC) to accomplish the set objectives. The bi-wavelet is used to describe the co-movements of stock-market returns and exchange-rate returns. We demonstrated how the external shock, a third variable, might conditionally influence these co-movements using a partial wavelet. On the other hand, the WMC method was used to demonstrate concurrent effects.
Methodology
Data sources and description
In the study monthly data from February 2005 to August 2021 are employed, obtained from investing.com and policyuncertainity.com to examine the partial effect of external uncertainty shocks on the co-movements between returns in stock and exchange-rate markets in SADC countries. The study includes external shock factors such as GEPU and GPR to divulge their conditionality in the nexus between the stock and exchange-rate markets of the three selected SADC economies. In the study, price data are considered of the overall stock markets indices Johannesburg Stock Exchange (JSE) All-shares index, Botswana Stock Exchange (BSE), Domestic Companies Index and the Stock Exchange of Mauritius Index (SEMDEX). Stock-market price data were converted into continuously compounded returns determined as In (Pt/Pt-1). The exchange rates for the BRICS economies - Botswana (BEXR), Mauritius (MEXR), and South Africa (SAEXR) - are among the variables included. To determine exchange rates, the local currency is expressed as a percentage of the US dollar. Since the current analysis uses a direct quote against the US dollar, an increase in the BRICS exchange rate signifies a depreciation of the domestic currencies. The data on stock markets and exchange-rate markets were sourced from https://www.investing.com, whereas data on GEPU and GPR were extracted from the website https://www.policyuncertainty.com/index.html as developed by Baker et al. (2016).
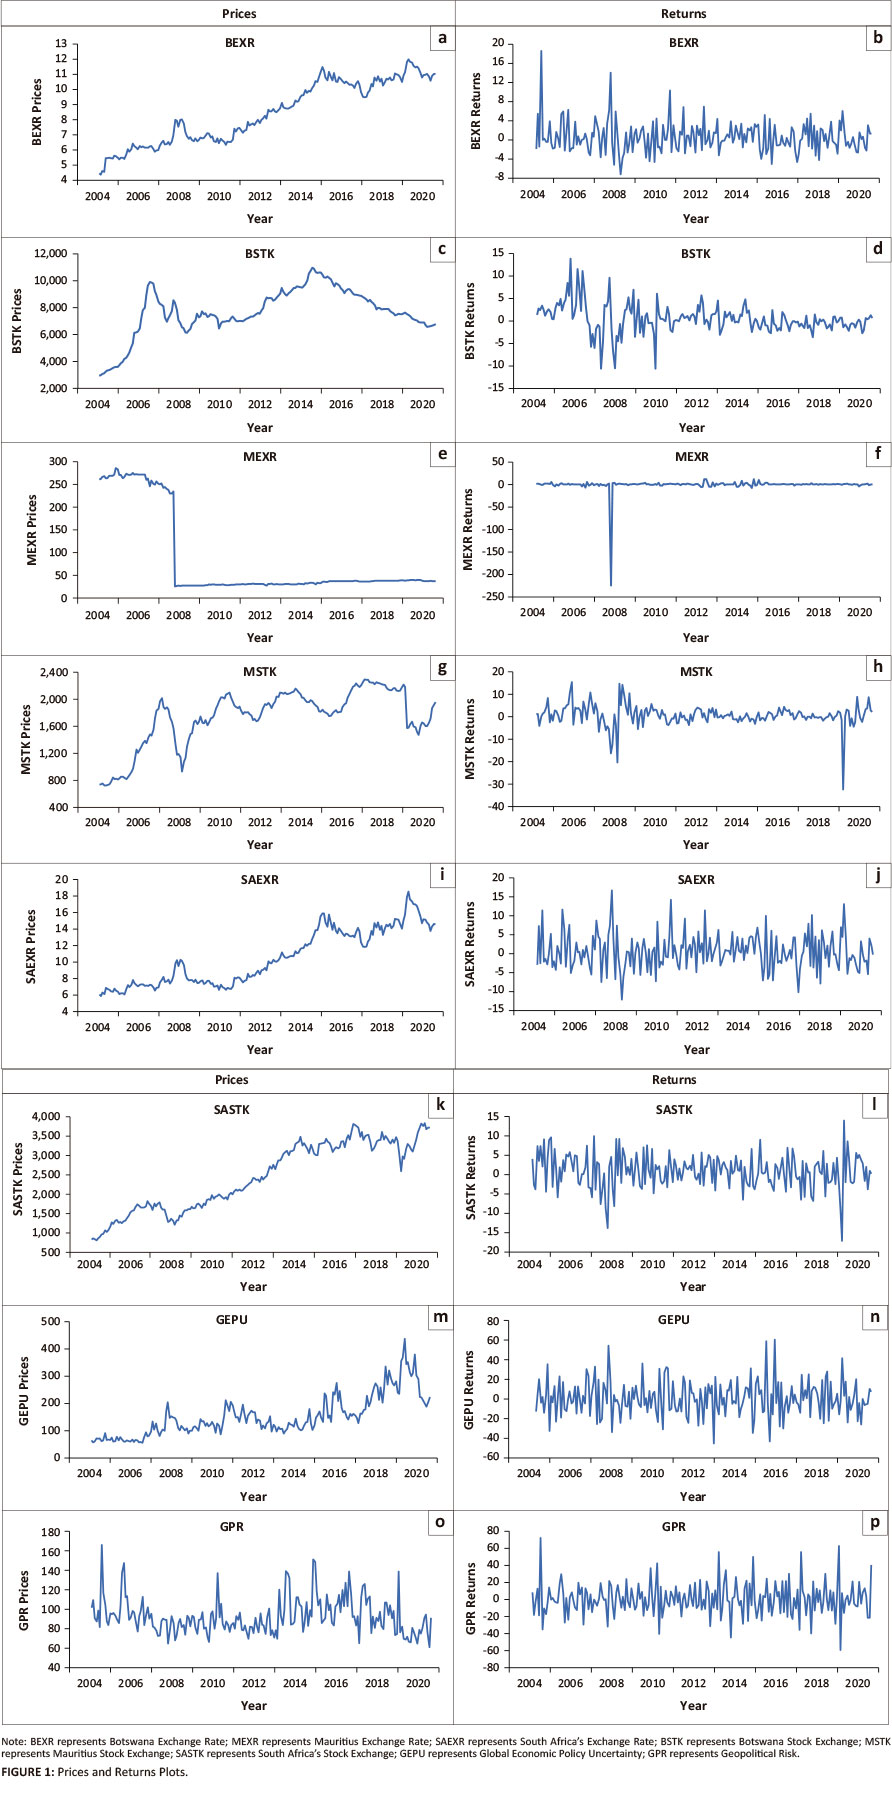
A sample period from February 2005 to August 2021, limited by the availability of consistent data for the selected variables is used, in keeping with various economic events the world experienced thus far. Figure 1 shows the trajectory of external shocks (GPR & GEPU) and two country-specific macro-economic indicators (stock prices & exchange rates), from 2005 to 2021. The timeframe corresponds to well-known economic shocks and events, including the 2008 Global Financial Crisis (GFC), the Arab Spring, the 2013 Eurozone Debt Crisis (EZC), BREXIT in 2016, and the coronavirus disease 2019 (COVID-19) Pandemic, to name a few. Over time, these incidents drastically altered the long-term tendencies in the series. Botswana and South Africa's exchange currencies depreciated sharply between 2008 and 2020, causing stock returns in these countries to fall. Figure 1 shows a dramatic increase in GEPU indices throughout the 2007/2008 global financial crisis, the 2016 BREXIT, and the 2020 COVID-19 pandemic crises, reflecting prominent levels of uncertainty during these events. Geopolitical risk, on the other hand, appeared to increase in 2005, 2006, 2011, 2013, 2015/2016/2017, and 2020, which correspond to the London bombing, Irananian nuclear tensions, the Syrian conflict, Islamic State in Iran Syria (ISIS) escalation, attacks in Paris and North Korea, and the Russia-Ukraine war, respectively. These findings are consistent with those of Caldara and Iacoviello (2022).
The descriptive statistics for the datasets are presented in Table 1. The data distribution in Table 1 shows non-normality. While Botswana and South Africa's exchange rates experienced positive mean returns throughout the period, Mauritius' exchange rate saw negative mean returns. During that period, the stock markets in every sampled nation experienced gains.
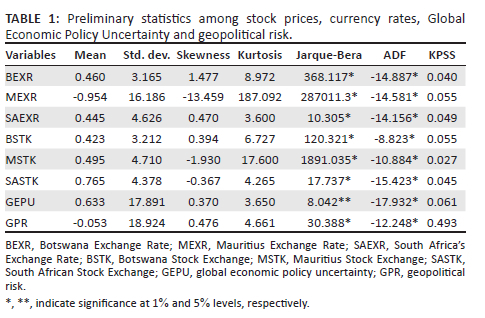
Additionally, the augmented Dickey-Fuller and Kwiatkowski-Phillips-Schmidt-Shin tests support the datasets' stationarity at first difference as depicted in Figure 1.
Model description/specification
Bi-wavelet
The lead-lag relationships between the exchange rate and stock prices are examined in this study from a time and frequency viewpoint using the bi-wavelet technique. Discrete wavelet transforms (DWTs), and continuous wavelet transforms (CWTs) are the two types of wavelet transforms. The emphasis is on CWT because of its superior extraction advantage (Pal & Mitra 2019). The mother wavelet consists of two parts: scale dilation (S), which explains the stretched nature of the wavelet, and location or time, which shows the wavelet's distinct place or time (Ω).
This is presented in Equation 1 as
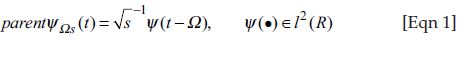
where  serves as the normalisation factor shown by the
  ; Ω and s. Morlet wavelet is shown as
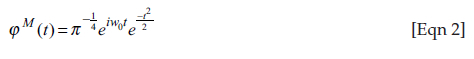
ω0 displays the wavelet's fundamental frequency, which is set at 3 by Rua and Nunes (2009) and Vacha and Barunik (2012).
Li et al. (2020) claim that Equation 3 can be used to express x(t) as
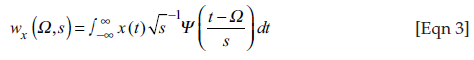
In the mother wavelet function, ψ is known to be complex conjugate.
Wavelet transformation coherence
Wavelet transformation coherence, according to Torrence and Compo (1998), is the squared value normalisation of a cross-absolute spectrum to a single wavelet power spectrum. The squared wavelet coefficient is expressed mathematically in Equation 4.
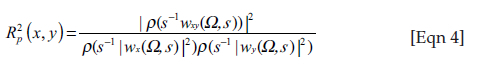
where ρ is a smoothing factor and the range of the square difference is 0 to 1. A connection is strong when the number is close to 1, and weak when the number is close to 0. Because it is difficult to ascertain the theoretical distribution of CWT coefficients, the Monte Carlo approach was used to examine the statistical significance of this nexus (Torrence & Compo 1998).
Wavelet transformation coherence phase difference
The difference in WTC phase over a specific period reveals oscillation problems. Equation 5 takes into account the phase difference between x(t) and y(t), using Bloomfield et al. (2004) as a guide.
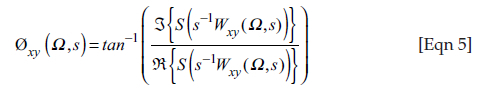
The symbols ℑ and ℜ in Equation 5 denote the real and imaginary operators, respectively. The phase-pattern dimension of the wavelet coherence map highlights the wavelet coherence difference as a source of inspiration. Dimensional arrows are used to separate phase patterns.
The bi-wavelet is graphically represented by arrows pointing right and left, as well as up and down. The first variable is denoted by right arrows pointing up and left arrows pointing down, and vice versa for left arrows pointing up and right arrows pointing down. A colour scheme and a surface colour are used to show the relationship between the related variables. Areas with a high co-movement rate are highlighted in red (warm), whereas those with a low co-movement rate are highlighted in blue (cool) (Agyei et al. 2022; Asafo-Adjei et al. 2022). Outside of the sphere of influence, the results are unimportant.
Partial wavelet coherence
Partial wavelet coherence is employed in the literature to limit the problem of pure correlation between time-series variables z(t) and to control the in-time-series time-series variable on the wavelet coherence between time-series variables x(t) and y(t) (Boateng et al. 2022; Amoako et al. 2022). As illustrated in Equation 6, PWC is represented by a similar equation to partial correlation squared.
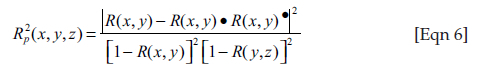
where  ranges from 0 to 1. The letters x, y, and z in this article present the SADC exchange rate, stock-market returns, GPR, and shocks related to GEPU, respectively. PWC is estimated using Monte Carlo techniques.
Wavelet multiple methods
The current study uses wavelet multiple methods to simultaneously analyse the degree of exchange rate and stock-price integration among SADC nations in the frequency domain. Additionally, the lead-lag relationship between financial time series over a range of investment horizons (short-, long-term) can be identified. In this study, the wavelet multiple cross-correlations (WMCC) are specifically used to identify variables that are leading or lagging, as well as a possible lead or lag.
Let Xt = x1t, x2t, … xnt be a multivariate stochastic process, with Wjt = w1jt, w2jt, …. wnjt serving as the resultant scale for λj. According to earlier works (Agyei et al. 2022; Owusu Junior et al. 2021), the maximal overlap discrete wavelet transform (MODWT) is used to estimate wavelet coefficients. Wavelet multiple correlations are therefore included in Equation 7 as:
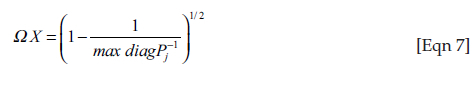
where Pj in Wjt is a (n x n) correlation matrix.
According to a theory of regression, fitted values for zi are  , hence the WMC is in Equation 8
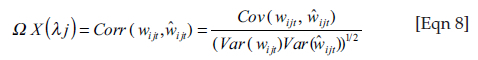
where  stands for the fitted values in the regression of wij on the outstanding wavelet coefficients at scale λj and wij is used to capitalise on ΩX(λj).
Consequently, by permitting a lag τ between fitted values and observations made at a certain scale λj, WMCC can be determined (see below).
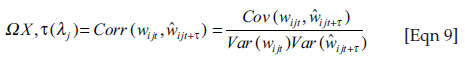
Therefore, for n = 2, WMCC and WMC combine with cross-correlation and conventional wavelet correlation.
et X = {X1, X2, … XT} be the recognition of the multivariate stochastic process Xt for t = 1, 2, …, T to calculate WMCC and WMC.
MODWT of order J is linked to individual univariate time series {X1i, …, X1T}, for i = 1, 2, …, n, the J length-T vectors of coefficients of MODWT 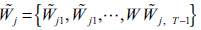 , for j = 0, 1, …, J is obtained.
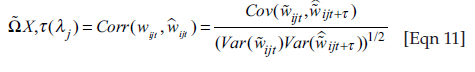
Equation 11 is a stable estimator of wavelet correlation from the MODWT, and Equation 10 is a nonlinear function of all numerators  wavelet correlations of scale λj.
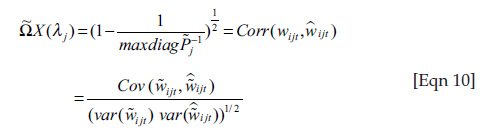
A suggested by Fernández-Macho (2012)  : the regression of the equivalent set of regressors
  optimise the R2.
Similar to this, a trustworthy equation for the WMCC can be approximated as
Results and discussion
Time-frequency domain
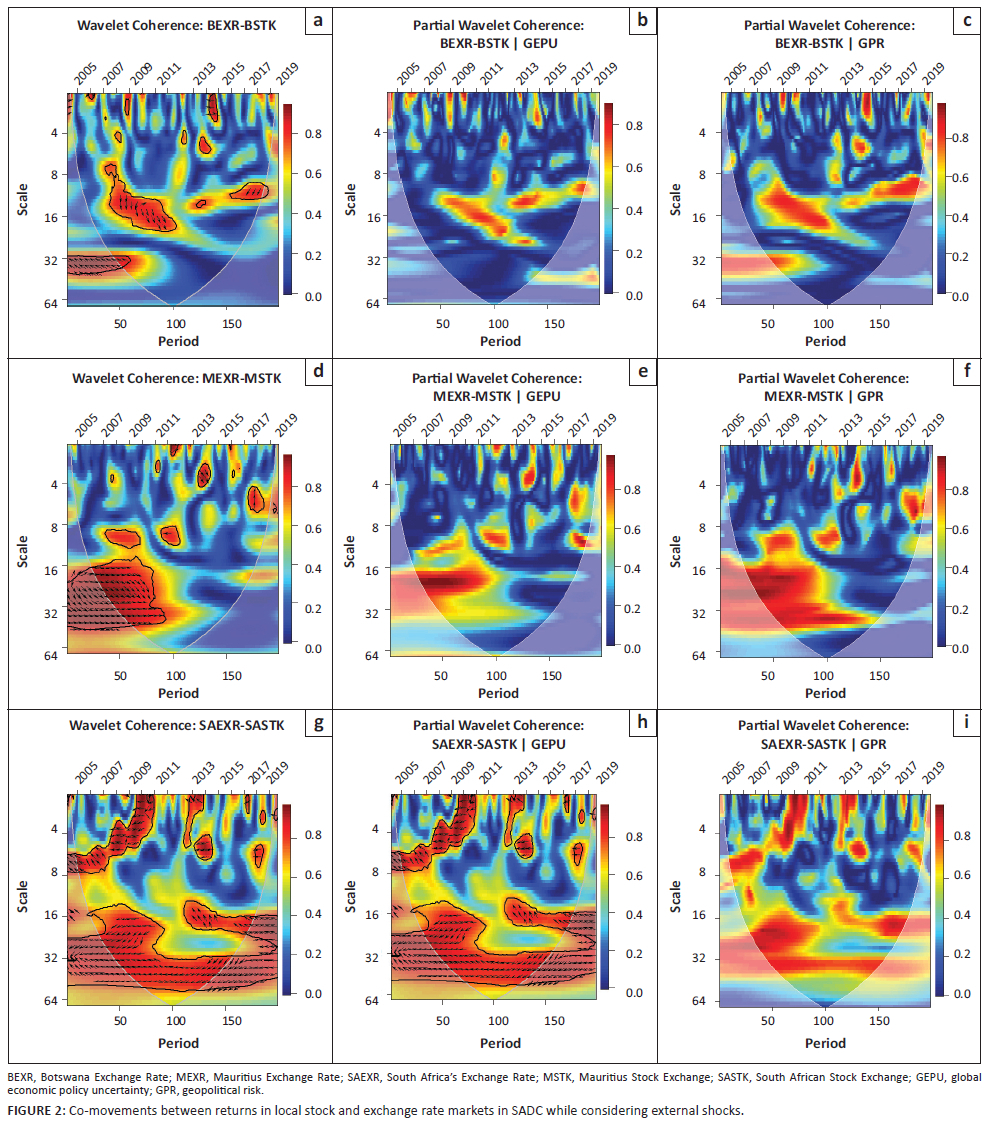
In this study, the bi-wavelet method was utilised to determine the degree of bi-causality or unidirectional relationship between two variables in time-frequency. This method would also show how closely two variables moved together in both the time and frequency domains. The results are in the form of a graphical display (Figure 2). The vertical axis represents the frequency domain (intrinsic time or time horizons), and the horizontal axis represents the time domain (calendar time). They combine to provide the time-frequency domain framework.
The analysis scripts and statistical interpretations were taken from Gouhier et al. (2013). Arrows pointing to the right and left in the chart indicate when domestic stock-market returns and domestic exchange rates in the SADC are, respectively, in-phase (moving in the same direction) and anti-phase (moving in the opposite direction). Left-pointing upward arrows and right-pointing downward arrows show that the second variable is leading, whereas right-pointing upward arrows and left-pointing downward arrows show that the first variable is leading. The surface colour and colour scheme serve as indicators of how interdependently the matched series are of one another. Red (warm) denotes components with significant interactions, whereas blue (cold) denotes components with fewer connections (Asafo-Adjei, Owusu Junior & Adam 2021; Frimpong et al. 2021; Owusu Junior et al. 2018). The bi-wavelet plots' cone of impact (COI) identifies the area where wavelet interpretation is crucial. Since the data are outside the 95% confidence interval, these are insignificant.
The relationship between the exchange rate (EXR) and stock prices (STK) throughout the full sample period is depicted in Figure 2. On Mauritius, there is a positive and significant co-movement, with the majority of right-pointing arrows pointing downward and driven by stock returns from 2007 to 2012 and in 2014, similar to Botswana between 2007 and 2012. This result is consistent with that of Mroua and Trabelsi (2020), who found that there is an immediate connection between the EXR and STK markets among the BRICS. This suggests that for Botswana and Mauritius, where the co-movements exist, the exchange rates and stock returns nexus are mostly positively impacted by stock returns, which have a dominant driving capability. This implies that as the US dollar equivalent of a local currency is used, the conclusion implies that stock prices affect both domestic and foreign investor behaviour, creating changes in money demand that then affect the exchange rate. Foreign capital will pour into these countries as a result of rising stock values. As a result, there is an increase in demand for local currency, which causes the US dollar to depreciate and local currency to appreciate. However, it is important to note that this observation may not apply to the studied stock markets due to the SADC markets' generally inadequate regulatory regimes.
Strong co-movements with a mix of rising and negative left-pointing arrows are shown in the case of South Africa throughout the sample period, demonstrating the potential for stock returns and exchange rates to drive one another. This demonstrates a high degree of integration in South Africa by showing a bi-directional causation relationship between the dynamics of exchange rates and stock returns. Most of the left-pointing arrows are upward, as can be seen. This suggests that stock returns have a significant, albeit negative, driving role in the relationship between the exchange rate and stock returns for the South African economy.
This finding is in line with the portfolio balance theory (PBT), which Frankel (1983) advanced. The PBT claims that stock-price fluctuations in an economy could affect the exchange rate through the influx and outflow of foreign capital, rather than exchange-rate fluctuations changing stock prices.
As highlighted above, in all-time frequencies, South Africa experiences a significant co-movement between the two markets, while in the case of Botswana and Mauritius, there seems to be insignificant co-movement between the local exchange rate and stock markets after 2012. This implies that the diversification of a portfolio might theoretically fail in South Africa. After 2012, diversification might be comparatively advantageous in Botswana and Mauritius. International investors could typically profit from portfolio diversification in Botswana and Mauritius due to the lack of a correlation between stock and exchange-rate gains, notably in the years following 2012.
The partial wavelet in the second and last columns of Figure 2 further demonstrates that while both GEPU and GPR have a considerable impact on the co-movement between stock returns and exchange-rate returns, GPR has a stronger impact than GEPU on this nexus. As demonstrated by Frimpong et al. (2021), external shocks have a major impact on the pricing of financial assets in the time-frequency domain. Due to the negative effects on investors, this may cause the balance of payments to be distorted.
Both investors and policymakers may benefit significantly from the evidence presented in this study. Investors should therefore be alert to changes in the global EPU, notably the GPR, especially those who are interested in the stock markets of Botswana, Mauritius, and South Africa. In this regard, SADC policymakers should think about the long-term development of stock markets and judiciously fine-tuning policies to better direct short-term investors as the changes in global EPU and GPR may obstruct investors' confidence in stock and Exchange Rate Markets. For state-level policymakers, this paper shows the link between capital mobility and exchange-rate volatility, as well as the role of domestic and foreign policy among the 'fundamental' factors that may explain how a country may be affected by political risk. It is well established that there remains little that countries can do to control market responses but awareness in itself should facilitate a better understanding of the national policy risk factors to enable policymakers to conduct their executive authority, mindful of the potential market responses.
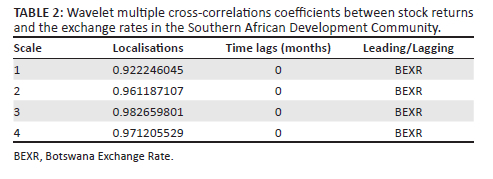
Wavelet multiple cross-correlations
The wavelet multiple cross-correlations for the variables under investigation are shown graphically (numerically) in Figure 3 and Table 2. The WMCC diagram demonstrates how each variable can either lead or lag, depending on the scale, suggesting that the variable at that scale has the highest value in the linear combination of all the variables at various scales. At a specific wavelet scale, the leading or trailing variable is influenced by the most significant variable, depending on how closely the other variables are related.
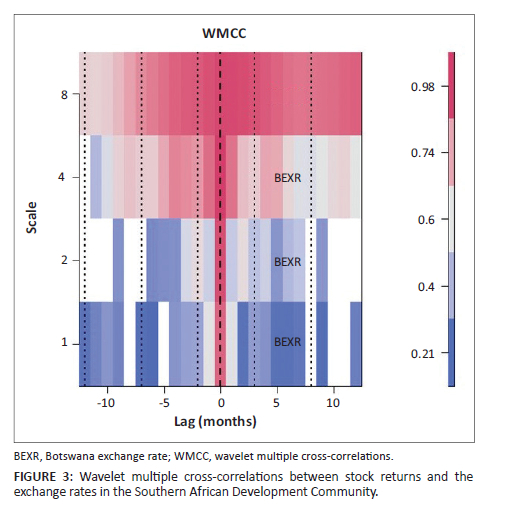
According to Figure 3, the scales on the y-axis have comparable implications to those that were mentioned at the outset of the discussion of wavelet multiple analysis. However, the x-axis displays the series' lag time. In this instance, both the positive and negative lags are 12 months. To validate the probable leading and lagging variables, both positive and negative results are required. At the corresponding scales, localisations at positive lag indicate lagging variables, while those at negative lag indicate leading variables. There is neither a lead nor a lag at the zero-lag of localisation (dashed) lines.
The localisation, shown by the dashed lines inside the dotted lines, shows the highest values in the linear combination of all variables at the wavelet scales (at all lags). When a variable is stated on a scale, it indicates that it has the ability to either lead or lag all other variables. It implies that, when all the variables are combined linearly over all relevant scales, it has the maximum value at that scale. In the heat map, a dashed line adjacent to a stated variable shows either a potential lag (positive lag) or lead (negative lag), unless the dashed line is on the zero-lag, in which case it implies neither lead nor lag. Thus, WMCC have economic implications in that they reveal the interdependence of the variables and identify the most important variable at a particular wavelet scale to act as either a leading (first mover to respond to shocks) or a lagging variable (last variable to respond to shocks after the other variables). The co-movements among all the variables reveal that the Botswana exchange-rate response to shocks is indeterminate and has the potential to lead or lag from scales 1 to 8 (at lag 0).
Conclusion and policy recommendations
Using three econometric techniques via wavelet, the present study's analysis was conducted. These three types of correlation analysis are wavelet multiple, partial, and bivariate. By integrating shocks from GPR and GEPU, the present study added to the existing literature on the time-frequency domain co-movement between stock-market returns and local currency returns. With the aid of these tools, it is possible to identify the lead-lag linkages between the variables under investigation and evaluate how they interacted with one another in terms of both policy and investment decisions, particularly portfolio diversifications.
The results of the bivariate study point to a high degree of integration in South Africa between the dynamics of currency rates and stock returns, with a bi-directional causation consequence. Typically, the left-pointing arrows are upwards, as may be seen. This suggests that stock returns have a significant, albeit negative, driving role in the relationship between the exchange rate and stock returns for the South African economy. This agrees with Frankel's (1983) PBT, which postulates a causal relationship between stock prices and currency rates, via the influx and outflow of foreign capital. Once more, there is a positive interdependency between the stock market and currency market, and this is seen in Botswana and Mauritius from 2007 to 2012. This implies that for Botswana and Mauritius, where the co-movements exist, the exchange rates and stock returns nexus are primarily positively impacted by stock returns, implying diversification is not rewarding.
At all-time periods, South Africa experiences a considerable co-movement between the two markets; however, after 2012, the co-movement between the local exchange rate and stock markets in Botswana and Mauritius has been insignificant. This suggests that a portfolio's diversification may, in theory, fail in South Africa. However, due to the absence of a link between stock and exchange-rate gains, particularly in the years following 2012, foreign investors could benefit from portfolio diversification in Botswana and Mauritius.
Additionally, the partial wavelet shows that while both GPR and GEPU significantly affect the co-movement between stock returns and exchange-rate returns, GPR has a stronger influence than GEPU on this nexus. This might skew the balance of payments because of the detrimental consequences on investors.
The WMCs study provides evidence that the Botswana exchange-rate has the capacity to lead or lag in terms of how it responds to shocks across all-time scales for the SADC economies.
The data presented in this study may have important real-world ramifications for investors and governments alike. Investors should, therefore, keep an eye out for changes in the global EPU, particularly the GPR, and especially if they have concerns about the stock markets in Botswana, Mauritius, and South Africa. In this regard, SADC officials should consider the long-term development of stock markets and judiciously fine-tune regulations to better direct short-term investors as the fluctuations of global EPU and GPR may obstruct the investors' confidence in stock and exchange-rate markets. To ensure that timely and effective action is taken to minimise the impact on the co-movement between stock returns and currency returns, policymakers must also have a thorough understanding of the nature of the co-movement between the currency and stock markets in these particular countries, as well as the conditional effect of the GEPU and GPR on the said markets.
Acknowledgements
Competing interests
The authors have declared that no competing interest exists.
Authors' contributions
Dr T.Q.: Conceptualisation; Project administration; Formal analysis; Investigation; Methodology; Writing original draft. Prof. S.M.: Validation; Writing original draft; Writing review and editing. Prof. E.P.J.K.: Validation; Writing original draft; Writing review and editing. Dr E.V.: Validation; Writing original draft; Writing review and editing. Dr O.M.: Validation; Writing original draft; Writing review and editing.
Ethical considerations
This article followed all ethical standards for research without direct contact with human or animal subjects. H21-BES-ECO-124.
Funding information
This work is based on the research supported wholly/ in part by the World Trade Organization (WTO) and the National Research Foundation of South Africa (Grant Numbers: 129452).
Data availability
The data that support the findings of this study are available on request from the corresponding author, T.Q., upon reasonable request.
Disclaimer
The views and opinions expressed in this article are those of the authors and do not necessarily reflect the official policy or position of any affiliated agency of the authors.
References
Abiad, A., Leigh, D. & Mody, A., 2009, 'Financial integration, capital mobility, and income convergence', Economic Policy 24(58), 241-305. https://doi.org/10.1111/j.1468-0327.2009.00222.x [ Links ]
Adjasi, C.K.D., Biekpe, N.B. & Osei, K.A., 2011, 'Stock prices and exchange rate dynamics in selected African countries: A bivariate analysis', African Journal of Economic and Management Studies 2(2), 143-164. https://doi.org/10.1108/20400701111165623 [ Links ]
Agyei, S.K., Owusu Junior, P., Bossman, A., Asafo-Adjei, E., Asiamah, O. & Adam, A.M., 2022, 'Spillovers and contagion between BRIC and G7 markets: New evidence from time-frequency analysis', PLOS One 17(7), e0271088. https://doi.org/10.1371/journal.pone.0271088 [ Links ]
AlNemer, H. A., Hkiri, B., & Khan, M. A., 2021, 'Time-varying nexus between investor sentiment and cryptocurrency market: New insights from a wavelet coherence framework', Journal of Risk and Financial Management 14(6), 275. https://doi.org/10.3390/jrfm14060275 [ Links ]
Alqahtani, A., Bouri, E. & Vo, V.X., 2020, 'Predictability of GCC stock returns: The role of geopolitical risk and crude oil returns', Economic Analysis and Policy 68, 239-49. https://doi.org/10.1016/j.eap.2020.09.017 [ Links ]
Al-Thaqeb, S.A., Algharabali, B.G.H. & Alabdulghafour, K.T., 2020, 'The pandemic and economic policy uncertainty', International Journal of Finance & Economics 27(3), 2784-2794. https://doi.org/10.1002/ijfe.2298 [ Links ]
Amoako, G.K., Asafo-Adjei, E., Mintah Oware, K. & Adam, A.M., 2022, 'Do volatilities matter in the interconnectedness between world energy commodities and stock markets of BRICS?', Discrete Dynamics in Nature and Society 2022, 1030567. https://doi.org/10.1155/2022/1030567 [ Links ]
Arouri, M., Estay, C., Rault, C. & Roubaud, D., 2016, 'Economic policy uncertainty and stock markets: Long-run evidence from the US', Finance Research Letters 18, 136-141, https://doi.org/10.1016/j.frl.2016.04.011 [ Links ]
Asafo-Adjei, E., Adam, A.M., Idun, A.A.A. & Ametepi, P.Y., 2022, 'Dynamic interdependence of systematic risks in emerging markets economies: A recursive-based frequency-domain approach', Discrete Dynamics in Nature and Society 2022, 1139869. https://doi.org/10.1155/2022/1139869 [ Links ]
Asafo-Adjei, E., Owusu Junior, P. & Adam, A.M., 2021, 'Information flow between global equities and cryptocurrencies: A VMD-based entropy evaluating shocks from COVID-19 pandemic', Complexity 2021, 4753753. https://doi.org/10.1155/2021/4753753 [ Links ]
Athari, S.A. & Hung, N.T., 2022, 'Time-frequency return co-movement among asset classes around the COVID-19 outbreak: Portfolio implications', Journal of Economics and Finance 46(4), 736-756. https://doi.org/10.1007/s12197-022-09594-8 [ Links ]
Baker, S.R., Bloom, N. & Davis, S.J., 2016, 'Measuring economic policy uncertainty', The Quarterly Journal of Economics 131(4), 1593-1636. https://doi.org/10.1093/qje/qjw024 [ Links ]
Balcilar, M., Bonato, M., Demirer, R. & Gupta, R., 2018, 'Geopolitical risks and stock market dynamics of the BRICS', Economic Systems 42(2), 295-306. https://doi.org/10.1016/j.ecosys.2017.05.008 [ Links ]
Bloomfield, D.S., McAteer, R.J., Lites, B., Judge, P.G., Mathioudakis, M. & Keenan, F.P., 2004, 'Wavelet phase coherence analysis: Application to a quiet-sun magnetic element', The Astrophysical Journal 617, 623. https://doi.org/10.1086/425300 [ Links ]
Boako, G., Omane-Adjepong, M. & Frimpong, J.M., 2016, 'Stock returns and exchange rate nexus in Ghana: A Bayesian quantile regression approach', South African Journal Economics 84(1), 149-179. https://doi.org/10.1111/saje.12096 [ Links ]
Boateng, E., Asafo-Adjei, E., Addison, A., Quaicoe, S., Yusuf, M.A. & Adam, A.M., 2022, 'Interconnectedness among commodities, the real sector of Ghana and external shocks', Resources Policy 75, 102511. https://doi.org/10.1016/j.resourpol.2021.102511 [ Links ]
Branson, W.H., 1976, 'Portfolio equilibrium and monetary policy with foreign and non-traded assets', in E. Chaasen & P. Salin (eds.), Recent issues in international economics, pp. 241-250. Amsterdam, North Holland. [ Links ]
Branson, W.H., 1977, 'Asset markets and relative prices in exchange rate determination', Sozialwissenschaafttliche Annalen 1, 69-89. [ Links ]
Bundoo, S., 2017, 'Stock market development and integration in SADC', Review of Development Finance 7(1), 64-72. https://doi.org/10.1016/j.rdf.2017.01.005 [ Links ]
Caldara, D. & Iacoviello, M., 2022, 'Measuring geopolitical risk', American Economic Review 112(4), 1194-1225. https://doi.org/10.1257/aer.20191823 [ Links ]
Campbell, J.Y. & Shiller, R.J., 1987, 'Co-integration and tests of present value models', Journal of Political Economy 95(5), 1062-1088. https://doi.org/10.1086/261502 [ Links ]
Chen, L., Du, Z. & Tan, Y., 2019, 'Sustainable exchange rates in China: Is there the heterogeneous effect of economic policy uncertainty', Green Finance 1(4), 346-363. https://doi.org/10.3934/GF.2019.4.346 [ Links ]
Cheng, C.H. & Chiu, C.W., 2018, 'How important are global geopolitical risks to emerging countries?', International Economics 156, 305-325. https://doi.org/10.1016/j.inteco.2018.05.002 [ Links ]
Chinn, M., 1989, 'A tale of two markets: Capital market integration and the determination of exchange rates', in R. O'Brien & T. Datta (eds.), International economics and financial markets, pp. 193-214. Oxford University Press, Oxford. [ Links ]
De Nicola, F., Kessler, M. & Nguyen, H., 2019, The financial costs of the U.S.-China trade tensions: Evidence from East Asian stock markets, World Bank, Washington, DC. [ Links ]
Döpke, J. & Pierdzioch, C., 2006, 'Politics and the stock market: Evidence from Germany', European Journal of Political Economy 22(4), 925-943. https://doi.org/10.1016/j.ejpoleco.2005.11.004 [ Links ]
Dumas, B. & Solnik, B., 1995, 'The world price of foreign exchange risk', The Journal of Finance 50(2), 445-479. https://doi.org/10.1111/j.1540-6261.1995.tb04791.x [ Links ]
Eldor, R. & Melnick, R., 2004, 'Financial markets and terrorism', European Journal of Political Economy 20, 367-386. https://doi.org/10.1016/j.ejpoleco.2004.03.002 [ Links ]
Fang, L., Chen, B., Yu, H. & Qian, Y., 2018, 'The importance of global economic policy uncertainty in predicting gold futures market volatility: A GARCH-MIDAS approach', Journal of Futures Markets 38, 413-422. https://doi.org/10.1002/fut.21897 [ Links ]
Flint, C., 2017, Geopolitical constructs: The mulberry harbours, World War Two, and the making of a militarized transatlantic, 1-226, Rowman and Littlefield, Lanham, Maryland. [ Links ]
Frankel, J.A., 1983, 'Monetary and portfolio-balance models of exchange rate determination', in J.S. Bhandari & B.H. Putnam (eds.), Economic interdependence and flexible exchange rates, pp. 84-115, MIT Press, Cambridge, MA. [ Links ]
Frimpong, S., Gyamfi, E.N., Ishaq, Z., Kwaku Agyei, S., Agyapong, D. & Adam, A.M., 2021, 'Can global economic policy uncertainty drive the interdependence of agricultural commodity prices? Evidence from partial wavelet coherence analysis', Complexity 2021, 8848424. https://doi.org/10.1155/2021/8848424 [ Links ]
Gouhier, T.C., Grinsted, A., Simko, V., Gouhier, M.T.C. & Rcpp, L., 2013, 'Package "biwavelet"#', Spectrum 24, 2093-2102. [ Links ]
Gurdgiev, C., O'Riordan, C. 2021, 'A wavelet perspective of crisis contagion between advanced economies and the BRIC Markets', Journal of Risk Financial Management, 14(10), 503. https://doi.org/10.3390/jrfm14100503 [ Links ]
Haidarpour, A. & Pourshahabi, F., 2012, 'Explaining the effects of economic uncertainty on macroeconomic variables (Case study: Iran)', Quarterly Journal of Parliament and Strategy 71, 125-148. [ Links ]
Hoque, M.E., Wah, S.L. & Zaidi, M.A.S., 2019, 'Oil price shocks, global economic policy uncertainty, geopolitical risk, and stock price in Malaysia: Factor augmented VAR approach', Economic Research-Ekonomska Istrazivanja 32(1), 3701-3733. https://doi.org/10.1080/1331677X.2019.1675078 [ Links ]
Inci, A.C. & Lee, B.S., 2014, 'Dynamic relations between stock returns and exchange rate changes', European Financial Management 20(1), 71-106. https://doi.org/10.1111/j.1468-036X.2011.00621.x [ Links ]
Javangwe, K.Z. & Takawira, O., 2022, 'Exchange rate movement and stock market performance: An application of the ARDL model', Cogent Economics & Finance 10(1), 2075520. https://doi.org/10.1080/23322039.2022.2075520 [ Links ]
Jorion, P., 1990, 'The exchange-rate exposure of U.S. multinational', The Journal of Business 63(3), 331-345. https://doi.org/10.1086/296510 [ Links ]
Kang, W. & Ratti, R.A., 2013, 'Oil shocks, policy uncertainty and stock market return', Journal of International Financial Markets, Institutions and Money 26, 305-318. https://doi.org/10.1016/j.intfin.2013.07.001 [ Links ]
Kang, W. & Ratti, R.A., 2015, 'Oil shocks, policy uncertainty and stock returns in China', Economics of Transition 23(4), 657-676. https://doi.org/10.1111/ecot.12062 [ Links ]
Kang, W., De Gracia, F.P. & Ratti, R.A., 2017a, 'Oil price shocks, policy uncertainty, and stock returns of oil and gas corporations', Journal of International Money and Finance 70, 344-359. https://doi.org/10.1016/j.jimonfin.2016.10.003 [ Links ]
Kang, W., Ratti, R.A. & Vespignani, J.L., 2017b, 'Oil price shocks and policy uncertainty: New evidence on the effects of US and non-US oil production', Energy Economics 66, 536-546. https://doi.org/10.1016/j.eneco.2017.01.027 [ Links ]
Kollias, C., Manou, E., Papadamou, S. & Stagiannis, A., 2011, 'Stock markets and terrorist attacks: Comparative evidence from a large and a small capitalization market', European Journal of Political Economy 27(suppl. 1), S64-S77. https://doi.org/10.1016/j.ejpoleco.2011.05.002 [ Links ]
Krol, R., 2014, 'Economic policy uncertainty and exchange rate volatility', International Finance 17(2), 241-256. https://doi.org/10.1111/infi.12049 [ Links ]
Li, X., Cheng, X., Wu, W., Wang, Q., Tong, Z., Zhang, X., et al., 2020, 'Forecasting of bioaerosol concentration by a back propagation neural network model', Science of the Total Environment 698, 134315. https://doi.org/10.1016/j.scitotenv.2019.134315 [ Links ]
Liang, C.C., Lin, J.-B. & Hsu, H.C., 2013, 'Re-examining the relationships between stock prices and exchange rates in ASEAN-5 using panel Granger causality approach', Economic Modelling 32, 560-563. https://doi.org/10.1016/j.econmod.2013.03.001 [ Links ]
Lin, C.H., 2012, 'The comovement between exchange rates and stock prices in the Asian emerging markets', International Review of Economics and Finance 22(1), 161-172. https://doi.org/10.1016/j.iref.2011.09.006 [ Links ]
Liu, Y.Y., Zheng, Y. & Drakeford, M., 2019 'Reconstruction and dynamic dependence analysis of global economic policy uncertainty', Quantitative Finance and Economics 3(3), 550-561. https://doi.org/10.3934/QFE.2019.3.550 [ Links ]
Michis, A.A., 2022, 'Multiscale Partial Correlation Clustering of Stock Market Returns', Journal of Risk and Financial Management, 15(1), 24. https://doi.org/10.3390/jrfm15010024 [ Links ]
Moore, T. & Wang, P., 2014, 'Dynamic linkage between real exchange rates and stock prices: Evidence from developed and emerging Asian markets', International Review of Economics and Finance 29, 1-11. https://doi.org/10.1016/j.iref.2013.02.004 [ Links ]
Mroua, M. & Trabelsi, L., 2020, 'Causality and dynamic relationships between exchange rate and stock market indices in BRICS countries Panel/GMM and ARDL analyses', Journal of Economics, Finance and Administrative Science 25(50), 395-412. https://doi.org/10.1108/JEFAS-04-2019-0054 [ Links ]
Ocran, M.K., 2010, 'South Africa and United States stock prices and the Rand/Dollar exchange rate', South African Journal of Economic and Management Sciences 13(3), 362-375. https://doi.org/10.4102/sajems.v13i3.106 [ Links ]
Owusu Junior, P., Adam, A.M., Asafo-Adjei, E., Boateng, E., Hamidu, Z. & Awotwe, E., 2021, 'Time-frequency domain analysis of investor fear and expectations in stock markets of BRIC economies', Heliyon 7(10), e08211. https://doi.org/10.1016/j.heliyon.2021.e08211 [ Links ]
Owusu Junior, P., Kwaku Boafo, B., Kwesi Awuye, B., Bonsu, K., Obeng-Tawiah, H., & McMillan, D., 2018, 'Co-movement of stock exchange indices and exchange rates in Ghana: A wavelet coherence analysis', Cogent Business & Management 5(1), 1481559. https://doi.org/10.1080/23311975.2018.1481559 [ Links ]
Pal, D. & Mitra, S.K., 2019, 'Oil price and automobile stock return co-movement: A wavelet coherence analysis', Economic Modelling 76, 172-181. https://doi.org/10.1016/j.econmod.2018.07.028 [ Links ]
Parsons, R. & Krugell, W., 2022, 'Policy uncertainty, the economy and business', South African Journal of Economic and Management Sciences 25(1), 1-9. https://doi.org/10.4102/sajems.v25i1.4422 [ Links ]
Raji, J.O., Ibrahim, Y. & Ahmad, S., 2017, 'Stock price index and exchange rate nexus in African markets', International Economic Journal 31(1), 112-134. https://doi.org/10.1080/10168737.2016.1245354 [ Links ]
Rezaei, N. & Norouzi, A., 2019, 'Investigating economic uncertainty and bank lending decisions', Quarterly Journal of Investment Knowledge 8, 32. [ Links ]
Roll, R., 1992, 'Industrial structure and the comparative behavior of international stock market indices', The Journal of Finance 47(1), 3-41. https://doi.org/10.1111/j.1540-6261.1992.tb03977.x [ Links ]
Rua, A. & Nunes, L.C., 2009, 'International co-movement of stock market returns: A wavelet analysis', Journal of Empirical Finance 16(4), 632-639. https://doi.org/10.1016/j.jempfin.2009.02.002 [ Links ]
Sahabuddin, M., Islam, M.A., Tabash, M.I., Anagreh, S., Akter, R. & Rahman, M.M., 2022, 'Co-movement, portfolio diversification, investors' behavior and psychology: Evidence from developed and emerging countries' stock markets', Journal of Risk and Financial Management 15(8), 319. https://doi.org/10.3390/jrfm15080319 [ Links ]
Sarantis, N., 1987, 'A dynamic asset market model for the exchange rate of the pound sterling', Weltwirtschaftliches Archiv 123, 24-38. https://doi.org/10.1007/BF02707780 [ Links ]
Torrence, C. & Compo, G.P., 1998, 'A practical guide to wavelet analysis', Bulletin of the American Meteorological Society 79(1), 61-78. https://doi.org/10.1175/1520-0477(1998)079<0061:APGTWA>2.0.CO;2 [ Links ]
Umar, Z., Bossman, A., Choi, S.Y. & Teplova, T., 2022, 'Does geopolitical risk matter for global asset returns? Evidence from quantile-on-quantile regression', Finance Research Letters 48, 102991. https://doi.org/10.1016/j.frl.2022.102991 [ Links ]
Vacha, L. & Barunik, J., 2012, 'Co-movement of energy commodities revisited: Evidence from wavelet coherence analysis', Energy Economics 34(1), 241-247. https://doi.org/10.1016/j.eneco.2011.10.007 [ Links ]
Vuola, L., 2015, 'Sanctions and the supply chain', Global Trade and Customs Journal 10(2), 69-72. https://doi.org/10.54648/GTCJ2015005 [ Links ]
Yin, D.A.I., Zhang, J.W., Yu, X.Z. & Xin, L.I., 2017, 'Causality between economic policy uncertainty and exchange rate in China with considering quantile differences', Theoretical and Applied Economics 24(3), 29-38. [ Links ]
Zhang, Y. & Hamori, S., 2022, 'A connectedness analysis among BRICS's geopolitical risks and the US macroeconomy', Economic Analysis and Policy 76, 182-203. https://doi.org/10.1016/j.eap.2022.08.004 [ Links ]
Zhao, H., 2010, 'Dynamic relationship between exchange rate and stock price: Evidence from China', Research in International Business and Finance 24(2), 103-112. https://doi.org/10.1016/j.ribaf.2009.09.001 [ Links ]
 Correspondence:
Thobekile Qabhobho
thobekile.qabhobho@mandela.ac.za
Received: 31 Mar. 2023
Accepted: 12 Oct. 2023
Published: 19 Jan. 2024
Project Number: ECO-124

