


Services on Demand
Article
 English (pdf)
 Article in xml format
 Article references
Indicators

Related links
-
 Cited by Google
 -
 Similars in Google
Share

 Permalink
South African Journal of Economic and Management Sciences
On-line version ISSN 2222-3436
Print version ISSN 1015-8812
S. Afr. j. econ. manag. sci. vol.24 n.1 Pretoria 2021
http://dx.doi.org/10.4102/sajems.v24i1.3796
ORIGINAL RESEARCH
Estimation of the potential economic welfare to be gained by the South African Customs Union from trade facilitation
Shahrzad SafaeimaneshI; Glenn P. JenkinsII
IFaculty of Economics, Administrative, and Sciences, Cyprus West University, Famagusta, Turkey
IIDepartment of Economics, Queen's University, Kingston, Canada
ABSTRACT
BACKGROUND: Trade facilitation is important for the South African Customs Union (SACU) countries because the expansion of international trade is a priority to enhance their economic growth. Unfortunately, the high trade compliance costs facing importers and exporters operating in SACU are in conflict with this objective.
AIM: This article aims to quantify the annual economic welfare gains that the member countries of SACU could realise from reforms that would reduce the documentary and border compliance time and costs.
METHODS: We use a partial equilibrium welfare economics framework of up-to-date sets of general equilibrium estimates of the import demand and the export supply elasticity in a country. The impact on the volume of trade flow and economic welfare is quantified to reduce documentary and border compliance time and trade compliance costs.
RESULTS: The economic welfare changes from reducing the documentary and border compliance time and costs for imports and exports would be between US$2.2 billion and US$3.7 billion (2018 prices), or between 0.54% and 0.90% of GDP of the SACU countries. The economic welfare gains from reducing the excess administrative costs in imports and exports of SACU members would be between US$2.2 billion and US$3.7 billion (2018 prices), or between 0.54% and 0.90% of the GDP of the SACU.
CONCLUSION: The most important reforms needed to realise these cost savings include a single window administrative structure. In this case, both customs, health, welfare, and controls, as well as the payment of all duties, taxes, and licenses are handled by a single administrative office. Failure to move fast regarding such changes would have a negative impact on the well-being of SACU members.
Keywords: trade facilitation; Southern Africa Customs Union (SACU); South Africa; trade compliance costs; trade reform; economic welfare gains.
Introduction
Over the past two decades, policymakers in emerging economies gradually came to understand that if the benefits of international trade are to be realised, trade facilitation measures must be implemented (Perera 2016). The reduction in the costs of engaging in international trade must be at the core of the long-term development agenda of emerging economies. In December 2013, after 10 years of negotiations, the World Trade Organization (WTO) Trade Facilitation Agreement (TFA) was formally approved at the Ninth Ministerial Conference of the WTO and applied in February 2017. By January 2020, over 85% of the 41 WTO member countries from Africa had ratified the TFA (Hassan 2020; WTO 2020).
According to Trade Facilitation Implementation Guide (TFIG 2020a), trade facilitation measures include a wide range of possible interventions. This includes improving the domestic infrastructure for transportation and ports by designing administrative systems that link the management of the port to that of customs, banks, and government ministries, such as those for trade and health (Fuenzalida-O'Shee, Valenzuela-Klagges & Coryalan-Quiroz 2018; UNCTAD 2017).
The need for trade facilitation and policies to reduce the costs of international trade in sub-Saharan Africa (SSA) has been well documented (Arvis et al. 2016; Djankov, Freund & Pham 2010; Hassan, Odularu & Babatunde 2020; Porteous 2019). Over the past decade, several trade facilitation interventions have been initiated in SSA with substantial success. Much of the subsequent research on the impact of trade facilitation has been largely focused on the potential impact of reducing the costs on international trade flows. While these studies had estimated the potential impact of trade facilitation on the volume of trade and export diversification in Africa, little direct quantitative assessment had been made of its effect on the economic welfare (Hoekman & Shepherd 2015).
This article aims to quantify the gain in the annual economic welfare that could be realised by the member countries of the South African Customs Union (SACU) from reforms to reduce the documentary and border compliance time and costs for imports and exports.
The focus is on reforming a series of administrative functions with costs greatly reduced without significant investment costs. The two aspects of trade compliance costs (CC) evaluated as potential areas for boosting economic welfare, if reformed, are border CC and documentary CC. Border CC are associated with the time and costs incurred in customs clearance, goods inspection, and handling at ports and borders (WB 2019a). Documentary CC are the time and costs associated to process the required documents to complete the international trade of goods from the country of origin to the destination country (WB 2019a). These costs are estimated annually by the World Bank Survey on Doing Business (WB 2018a). South African Customs Union countries, and particularly South Africa, have the information technology and management skills and financial resources to reduce these costs dramatically. Examples abound of successful reforms in this area by developing countries, starting with Singapore in 1989 (TFIG 2020a).
The members of SACU are South Africa, Botswana, Eswatini (Swaziland), Lesotho, and Namibia. This union is the world's oldest customs union still in existence, with its inception in 1889 (Ngalawa 2014). Due to its size and stage of development, South Africa is the dominant partner in setting policy and the day-to-day operations of SACU (Manwa, Wijeweera & Kortt 2019). South African Customs Union members have agreed on a trade liberalisation policy, with the duty-free transit of domestic products within the common customs area. At the same time, they have implemented a common regime of customs duties on imported goods into SACU countries. According to this agreement, all customs and excise duties collected in the customs union are deposited in the common revenue pool. After deducting the union's administrative cost, this revenue is shared between SACU members based on a revenue-sharing formula (SACU 2002).
As of 2018, 24% of SSA's total gross domestic product (GDP) is created in the SACU countries, predominantly South Africa. In terms of international trade, 36% of the value of imports in SSA, and 32% of its exports are produced by SACU countries. While exports and imports each account for more than 20% of SSA's GDP, these ratios are much higher for SACU, at 29% and 35%, respectively (IMF 2019; WB 2019c). This illustrates the importance of the SACU trading bloc in SSA and, in turn, the importance of international trade in the functioning of the SACU economies.
Literature review
Trade facilitation is particularly important for countries in Africa because, when considering all the policy measures to stimulate economic growth, expanding their ability to engage in international trade becomes a priority (Portugal-Perez & Wilson 2009; Sakyi et al. 2017). In conflict with this need is the heavier burden of trade costs in SSA compared to those in the rest of the world.
Investigating the impact of international trade and trade facilitation on economic growth in 35 and 52 African countries, respectively, Sakyi et al. (2017) and Sakyi and Afesorgbor (2019) found that the more those countries engage in trade facilitation, the greater the impact of international trade on economic growth. Other studies have examined various aspects of the impact of trade facilitation on bilateral trade in SSA (Portugal-Perez & Wilson 2009; Turkson, Adjei & Barimah 2020; Valensisi, Lisinge & Karingi 2016).
With a focus on SSA, Ferreira and Steenkamp (2020) identified an array of potential intra-regional trade opportunities that would occur, with improved integration of trading relationships across the 26 member countries in the Tripartite Free Trade Agreement (FTA). The authors concluded that the level of unnecessary costs, associated with international trade in the region, must be eliminated. These include poor infrastructure, slow border and customs procedures, and excessive documentation requirements. Using a Computable General Equilibrium (CGE) model, Balistreri et al. (2018) state that trade facilitation would increase the share of income of the poorest population in the East African Customs Union and the Tripartite FTA.
Portugal-Perez and Wilson (2009) compiled an extensive survey of the literature on identifying the types of trade costs, and how they might be captured for comparative analysis across countries. Three sets of indicators of trade impediments were selected. Data on each of these indicators were available across Africa. These included a trade restrictiveness index (TRI) that combines rates and frequency of import tariffs, along with quantitative trade restrictions, the trading-across-border indicators of the administration costs of trade as reported by the World Bank, and the World Bank's Logistics Performance Index (LPI) that reflects the relative transportation costs associated with international trade in each country. These variables were used as explanatory variables in the estimation of a gravity model of international trade. The focus of this analysis is on the determinants of the volume of trade flows. The empirical estimates of the impact of these variables are as expected: the greater the trade restrictions, the lower the volume of imports; the lower the cost of trade administration, the greater the volume of both exports and imports. Also the better the transportation system, the greater the volume of trade. Given that Africa has the highest trade transaction costs among all developing countries, they concluded that reducing such costs is critically important for economic growth and poverty alleviation in Africa. In general, the impact of feasible reforms that would lower trade transaction costs is relatively higher than the impact of reducing tariffs.
More recently, Sakyi et al. (2017) also investigated the effects of trade and trade facilitation on economic growth across 35 countries in Africa. They measured the trade-related exogenous variables by the volume of trade and the rate of CC related to export and such costs associated with import. These variables were used as exogenous variables to econometrically estimate an augmented growth model. They found that the direct impact of economic growth is statistically significant and positive. They also measured the impact of trade facilitation on economic growth, via increasing trade level, which stimulates the latter. The greater the extent of trade facilitation in an African country, the greater the impact of international trade on its economic growth.
Subsequently, Sakyi and Afesorghor (2019) investigated the effects of individual trade facilitation measures and their combined effect on trade performance, employing data from 52 African countries. In this study a structural gravity model framework is used for the period from 2006 to 2015. The focus of the analysis was on evaluating the impact of improvement in border and transportation efficiency on the volume of a country's exports and imports. Principal Component Analysis is used to create composite indices from several trade facilitation variables. They found that, while there has been some improvement over time, the trade costs associated with African countries have been consistently and significantly higher than those in any other region of the world. Their empirical analysis revealed that the real cost to export and import across borders is the key determinant of the performance of intra-Africa trade. Trade facilitation that reduced these border costs of trading was particularly important in determining countries' ability to export.
In their study on bilateral trade in SSA, Valensisi et al. (2016) found that the costs of processing imports and exports in African countries were very high even for bilateral trade within Africa. For example, they found that 10 out of 16 countries in the Common Market of Eastern and Southern Africa (COMESA) region had higher bilateral trade costs within their common market than with the rest of the world. A similar pattern exists in the East African Community (EAC) countries and the Economic Community of West African States (ECOWAS). They concluded that high transaction costs are a significant hindrance to Africa's integration globally and its own regional integration. Using CGE, a set of trade facilitation measures has been evaluated. It was estimated that establishing a Continental Free Trade Area (CFTA) could result in more than a 50% increase in intra-African trade.
In their study of the opportunities for bilateral trade in SSA, Turkson et al. (2020) recognised the challenge of developing efficient procedures and well-functioning institutions for cross-border administration trade. They conclude that African countries remain highly aid-dependent due to their inability to pursue the potential gain from trade fully. To address this problem, they point to the need for reforms to lower the level of cost of trade through the implementation of trade facilitation measures. Employing a panel estimation technique, using a gravity model with data from 29 SSA countries, they estimated the impact of strengthening institutions and the business environment by promoting bilateral trade. The results supported the theory that trade facilitation encourages bilateral exports and increases trade flows among the countries.
In the above studies, the focus was almost exclusively on how trade facilitation reforms would quantitatively expand the flows of exports and imports. Balistrere et al. (2018) attempt to go further in their study. Employing a CGE model, the authors did an economic welfare analysis of reducing trade costs in the East African Customs Union and the FTA. Their focus is on the impact of these reforms on poverty and the incomes of the bottom 40% of the income distribution. Their analysis indicated that the effects of the trade reforms to reduce trade costs benefit the poor. They found that trade facilitation tends to increase the incomes of the poor and reduce inequality. The strong influence of trade facilitation on improving agricultural returns tends to benefit skilled labour proportionally and reduce income inequality in these countries.
A substantial body of research has been published, focusing on the need for South Africa to stimulate its economic growth by diversifying its international markets to those providing a sustainable export demand (Matthee, Idsardi & Krugell 2015; Matthee & Santana-Gallego 2017; Mhonyera, Steenkamp & Matthee 2018; Turkson et al. 2020). The European Union (EU) is one such sustainable market. The EU and six countries of the Southern African Development Community (SADC) Botswana, Lesotho, Namibia, and Swaziland (BLNS), South Africa, and Mozambique - in 2016 signed an economic partnership agreement (EPA). The objective of this EPA is to bring about economic integration between the EU and this Southern African region. The estimation of the impact on trade flows, revenue, and economic welfare has been carried out to promote free trade through the existing Trade Development and Cooperation Agreement (TDCA) between South Africa and the EU. The estimated annual trade expansion in South Africa is over US$1 billion, with an increase in the economic welfare of approximately US$130 million.
However, the TDCA only tied the EU and South Africa in terms of trade liberalisation. Since South Africa is adhering to a single external tariff as a member of SACU, it is an imperfect union that does not function as it is supposed to for imports coming from the EU (Berends 2016). In 2014 EU and members of the SADC concluded talks on a new EPA.
The SADC EPA entered provisional implementation in 2016 to strengthen SADC EPA states' capacity in trade policy and trade-related issues. South Africa is the most important source of import for all SACU members (Czermińska & Garlińska-Bielawska 2018). This article demonstrates the importance of a sustainable trade flow for SACU members' economic growth.
Model specification and methodology
Various models of international trade have been used to estimate the impact of trade facilitation on trade flows. Many researchers used gravity equations for this purpose (Arvis et al. 2016; Jordaan 2014; Portugal-Perez & Wilson 2009). At firm level these effects were estimated through econometric studies of the comparative response of firms across countries (Seck 2016). Others employed CGE models to estimate these effects on the level of trade flow and its impact on poverty (Balistreri et al. 2018) and regional integration in Africa (Valensisi et al. 2016).
A partial equilibrium model that has been applied in studies worldwide is the WITS-SMART model developed by the United Nations Conference on Trade and Development. It allows an approximate measure of the change in consumer surplus from a change in trade policies and has been used to analyse the welfare effects, due to trade, of the European FTA on South Africa (Guei, Mugano & Le Roux 2017). This model was built to help developing countries to assess quantitatively the implications of proposals for trade liberalisation through Multilateral Trade Negotiations (MTN), or the effect of changes in the Generalized System of Preference (GSP) schemes of developed countries. It is an ex-ante partial equilibrium model, measuring through simulation the first-round effect of changes in tariff policies.
The focus of this model is on the trade creation and trade diversion effect of changes in tariff policies that, by their structures, will influence the trade flow between it and the country's various trading partners. These impacts are quantified using a series of import demand functions between each of the countries in the commodities analysis. A similar set of export supply functions is specified for each of the countries' exported commodities. The elasticity of the substitution of commodities can also be applied to determine the degree of trade diversion between countries due to changes in the relative prices brought about by the tariff reforms. The total trade effect is obtained by summing together the trade creation and trade diversion effects. The welfare effect arises from the benefits consumers in the importing countries derive from the lower domestic prices, due to the removal or reduction in tariff rates, or quantitative restrictions. Producers of exports also gain to the degree that the supply of these commodities is less than infinitely elastic. This model has been used to analyse the welfare effects of the European FTA on South Africa (Guei et al. 2017).
This model, however, is not well suited for the analysis of the welfare impact of trade facilitation reforms that is the primary focus of this article. Such reforms lower the costs of importing all goods by approximately the same percentage, and similarly, the reduction of the costs of exporting goods by a uniform percentage reduction. Hence, we can treat all imports as one composite good, and all exports (except oil and precious stones) as another composite good. In such a situation, there is only the impact of trade creation and no impact of trade diversion because relative prices from the various countries are not affected. In such a situation, it is the aggregate elasticity of demand for imports and the aggregate elasticity of exports supply that are the relevant empirical parameters for quantifying the responses of imports and exports to the changes in the administration costs of international trade. Hence, a more aggregated partial equilibrium model, such as the one outlined in this article, is all that is needed to quantify the overall impact on the volumes of imports and exports and, more importantly, the measurement of the economic enhancement for importers and exporters that such trade facilitation reforms create.
The default position of the WITS model stems from the assumption that export supply elasticities are infinite. This reduces its usefulness when estimating economic welfare changes, involving changes in exporters' trade costs. Changing to a finite elasticity will affect results by transforming part of trade creation (quantity effect) into price effect. The maximum estimate of trade creation is achieved with an infinite export supply elasticity.
A partial equilibrium framework and country-specific estimates of the export elasticity of supply, derived by Tokarick (2014), and the import elasticity of demand by Ghodsi, Grübler and Stehrer (2016), are used in this study. These estimates are available by country, using the GDP function approach initially developed by Kohli (1991) and Kee et al. (2008).
Trade compliance costs, tariff, and the demand for import
In this section we follow the methodology developed by the WTO (2015). The impact of tariffs and import CC on the volume of imports, economic efficiency, and tariff revenues are illustrated in Figure 1. In the absence of import tariffs, CC to import, domestic freight, and domestic marketing costs, the quantity demanded of imports would be determined by the demand function for imports and the cost, insurance, and freight (CIF) prices of imports at the border of the importing country. This research focuses on the impacts of tariffs (t), the CC associated with the administration of international trade flows (TCM), and their economic resource costs for SACU. We set aside the issues associated with differential domestic freight and domestic marketing costs. The analysis first identifies the quantity of imports, including both final goods and intermediate goods, demanded in a market that was free of both tariffs and trade CC. This is denoted as M1.
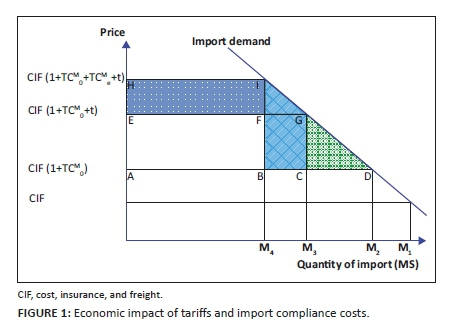
In order to import goods, there will be a minimum required rate of trade CC to import (TCM), even in the most efficient of circumstances. The total TCM that is observed for a country can be divided into the lowest rate of import compliance cost that can be expected from an efficient administration system (TC0M) and the amount in excess (TCeM).
This relationship for a country is expressed in Equation 1:
TCeM is the rate of trade CC that can be potentially eliminated through administrative reforms. While TCM for a country is observed, TC0M is not. However, the rates of TCM for other countries that implemented reforms to improve the efficiency of their trade administration systems are observable. Hence, in this analysis the benchmark rates of TC0M are obtained from the observed rates of TCM achieved by the trade administration of other countries.
When the minimum or efficient rate of trade CC, TC0M, is added to the CIF price, the cost (price) of imports to the country increases. Such costs reduce the quantity of imports in Figure 1 as the measurement from M1 to M2. In addition, imposing a tariff (t) on the CIF price of imported merchandise raises the prices of imports domestic consumers must pay, causing them to reduce the quantity of imports demanded further from M2 to M3. Any degree of excess CC, TCeM, will further increase the cost of imported items and lead to a further reduction in the quantity of imports demanded (M4 in Figure 1). This will also be the quantity of imports that is reported in a country's international trade statistics.
In the pre-reform situation, the price of imported goods can be expressed as CIF(1 + TC0M + t + TCeM) in which trade CC can also be measured as a percentage of the CIF value of the imports. If the small-country assumption holds for SACU countries, the world prices of imported goods are not affected by the quantity of imports demanded by these countries. In this situation, the quantities of imports can be expressed in units of foreign exchange; hence, CIF is defined to be equal to 1.
If trade administration reforms are implemented that eliminate TCeM, they will reduce the cost of a unit of import to (1 + TCeM + t), increasing the quantity of imports demanded from M4 to M3. This change in the quantity of imports, denoted as (ΔM)1, can be expressed as in Equation 2:
ɛM is the elasticity of demand for imports, while TCeM is the proportional change in the price of imports brought about by eliminating excessive trade CC.
The gain in economic welfare realised from the elimination of TCeM arises from two sources. First, goods being imported before the reform can now be imported at a lower cost (ΔW1). This is shown as the area of rectangle EHIF in Figure 1, representing the reduction in real resources used by the required administrative procedures to import goods into the country. This saving of resources can be expressed as in Equation 3:

The second gain in economic welfare, ΔW2, occurs because consumers of imported goods are paying a price of (1 + TC0M + t + TCeM) for items that after the reform will cost only (1 + TC0M + t). The lower price charged to consumers will increase the quantity of imports demanded by ΔM1. This increase in imports will have a resource cost of only (1 + TC0M). The economic welfare changes denoted as ΔW2 are shown as the summation of BFGC and FIG areas in Figure 1 and can be estimated as in Equation 4.
In Figure 1, the area BIGC represents the difference between consumers' total willingness to pay for the additional quantity demanded (M4IGM3) and the economic costs of the additional imports (M4BCM3).
Substituting Eqation 2 into Eqation 4, we have:

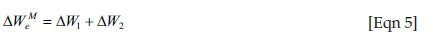
The total welfare gain ΔWe from a reform to eliminate the excess CC of import administration is given in Equation 5:
In the case of imports, the study of tariffs and their efficiency costs has a long tradition. By estimating the economic welfare costs of the tariff, a comparison can be made of the relative size of these two sources of economic inefficiency in the market for imports.
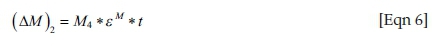
The economic inefficiency of the tariffs on imports is shown as the area CGD in Figure 1. To estimate this familiar triangle of welfare cost, one can consider the change in the quantity of imports demanded if the tariff were eliminated (ΔM)2. This is expressed as in Equation 6:
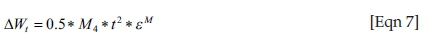
The economic welfare cost as measured by the triangle CGD can then be expressed as Equation 7:
Trade compliance costs and the supply of exports
Figure 2 illustrates a similar framework for the impact of trade CC on the volume of exports and the economic inefficiency that these costs might create. If there were no export trade CC, the exporter would receive the Free on Board (FOB) price. The quantities of export can be stated in units of foreign exchange, with the FOB price defined as being equal to 1. Given the supply function of exports, SoSx, the quantity of exports would be shown by X1.
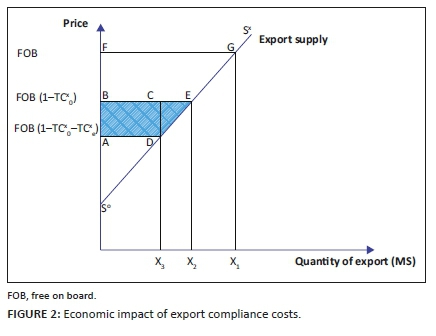
Conversely, if the country imposes on exporters a rate of trade transaction cost of TCX, the net remuneration received by exporters would fall to FOB (1 - TCX) and the quantity of exports to X3. Let us assume that the efficient level of trade CC is denoted by TC0X. At this level of costs, the total value of exports would be X2. The relation between these levels of administration CC of export is expressed as in Equation 8:
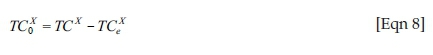
TCeX is the excess trade transaction costs that can be eliminated through trade administration reforms.
As the CC to export are also measured as a percentage of the dollar value of exports, the remuneration received by domestic producers of exportable goods, net of trade transaction costs, would be (1 - TC0X - TCeX). If reforms were implemented to remove the TCeX, the remuneration received for a unit of export by the producer would increase to (1 - TC0X). This would bring an increase in the supply of exports from X3 to X2, denoted by (ΔX)1. This supply response is expressed in Equation 9:
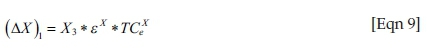
ɛX is the supply elasticity of export and TCeX is the proportional change in the price of exports from the elimination of the excess trade CC.
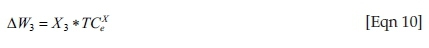
Elimination of the excess export CC increases economic welfare, as fewer resources are used in exporting the goods. The economic welfare gain from reducing the excess compliance cost is shown in Figure 2 for the current quantity of exports as the area of the rectangle ABCD, which can be computed using Equation 10:
With the increase in the producers' prices for exports, the quantity supplied will increase. The increase in the level of exports is the source of another economic gain shown as the area of the triangle of DCE in Figure 2. To quantify this economic benefit (ΔW4), Equation 11 is used:

This economic gain occurs because the marginal cost of the additional production (X3DEX2) is less than the economic value received net of the compliance from the additional export sales (X3CEX2).
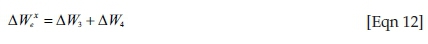
Therefore, the overall economic welfare gain from eliminating the excess CC for exporting, ΔWeX, is shown in Figure 2 as the total area of ABED. This gain is the sum of the results in Eqations 10 and 11, expressed as Equation 12:
In this article, these economic welfare measurements are estimated for a trade administration reform by SACU member countries.
Data and empirical analysis
To estimate the change in the level of imports and exports and the associated changes in economic welfare arising from the proposed reforms, international trade data for each of the SACU countries is used. Information is required on the actual values of the rates of trade CC for both imports and exports, along with import tariff rates and estimates of benchmark values for the rates of trade CC and import demand and the export supply elasticity. Description of the variables and the data source for each is provided in Appendix 1.
Import and export data are obtained from the Direction of Trade Statistics published by the IMF (2019). Trade compliance time and monetary costs are obtained from the Doing Business Survey of the World Bank (WB 2019b), and weighted average import tariff rates are available from the World Bank (WB 2019b). The import demand elasticity was estimated in 167 countries by Ghodsi et al. (2016), using the semi-flexible translog GDP function approach proposed by Kee et al. (2008). The export elasticity of supply used for each country are average long-run export supply elasticity adjusted to include the general equilibrium effects of price changes, as estimated by Tokarick (2014).
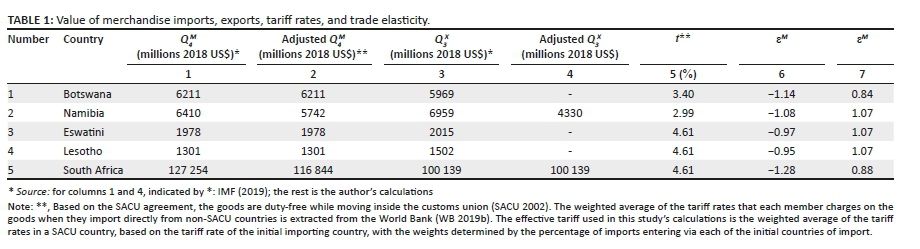
The import data between SACU countries are adjusted to avoid double counting the imports arriving in South Africa or Namibia that are trans-shipped to other SACU countries and counted as imports of the second country. Similarly, export values of the interior SACU countries are adjusted to reflect the fact that not all their exports will be shipped by sea via South Africa, or Namibia, to third countries. The exports of diamonds and precious metals are cases in point. The values of the border-crossing intra-SACU trade flow that is subject to the border and documentary CC to import are presented in Table 1, columns 2 and 4 (columns 1 and 3 are representations of the total value of exports before adjustment). The weighted average values for tariffs and the import demand and export supply elasticity in each country are reported in columns 5, 6, and 7, respectively.
To estimate the potential magnitude of the excess trade CC, the total CC of the import or export of a shipment of goods must be measured for each SACU country and compared with that of the benchmark countries.
Trade compliance costs of importing
In this article, estimating the gains from reducing trade CC focuses only on reducing border and documentary CC, as these costs have been the focus of WTO and World Customs Organization efforts at reducing trade compliance cost. By taking the total number of hours of waiting for an average import shipment, the average value of the shipment, and the cost of capital, one can estimate the average cost of waiting time to ship imports into a country (Equation 13):
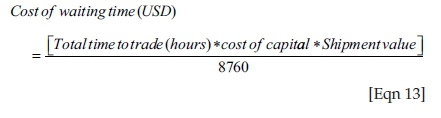
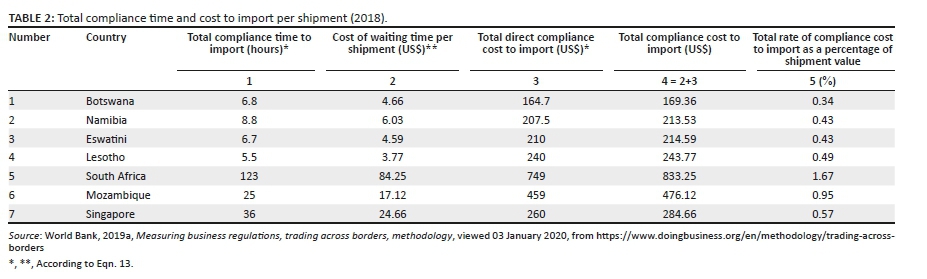
The real cost of funds for the average importer is assumed to be 12% for 1 year (8760 h). The total compliance time and cost to import are presented in Table 2. The first two columns are the hours and US dollar value of compliance time for import. The summation of US dollar cost of border and documentary compliance (WB 2019b) in column 3 is then added to the capital cost of waiting time for the shipment. The sum of the values in columns 2 and 3 then gives the total compliance cost of importing (TCCM) (column 4). These rates of CC are what each country imposes on a shipment of imports as it moves from the port in South Africa through the official procedures of the internal SACU countries, and it is expressed as a percentage of the World Bank standard shipment value for imports of US$50 000 (column 5).
The importation of goods through South Africa imposes a TCCM rate of 1.67% of the value of the imported goods (Table 2, row 5, column 5). Inland SACU countries and Namibia impose a further cost as the goods are imported there. For Botswana, the additional CC are equal to 0.34% of the value of the goods. Due to recent trade facilitation reforms, Botswana has the lowest second-stage importation costs among inland SACU countries (WB 2018a, 2019b, 2019c). Namibia, Eswatini, and Lesotho have additional customs compliance costs of 0.43%, 0.43%, and 0.49%. The combined rates of the TCCMs imposed on South Africa, and the ultimate country of importation are reported in Table 3, column 2.
The combined compliance costs are lowest for goods imported by and remaining in South Africa, at 1.67%. For inland countries, the rate of compliance costs ranges from 2.01% in Botswana to 2.16% in Lesotho. A small amount of goods is imported via the port in Namibia, mainly used to export raw materials. However, it is relatively efficient, with custom compliance costs for Botswana of 0.77% (i.e. 0.34% + 0.43%) and only 0.43% for Namibia (Table 3, column 3). However, shipping costs to Namibia, with its small number of cargo, will generally be higher than shipping via South Africa, except for a number of selected high-volume raw materials.
In summary, there are three possible avenues for importing goods into a SACU country. Firstly, goods may come directly into the country as either air shipments or direct imports by South Africa and Namibia. The rates of CC for these importations are shown in Table 3, column 1. Secondly, goods can first be imported into South Africa and then shipped to a second country. The rates of CC for these imports are reported in Table 3, column 2. Finally, a small amount of goods is imported into Botswana via ports or airports in Namibia.
In all countries, a degree of customs CC is necessary to ensure the security and health of residents. However, several reforms worldwide have greatly reduced these costs, while improving the overall quality of the services provided by customs and other government organisations dealing with international trade (Peterson 2017; TFIG 2020a, 2020b; WB 2019a). The two countries in the region that have been most successful in implementing trade facilitation reforms are Mozambique and Botswana. As a result of its reforms, Mozambique has the lowest cost of trading across borders of any coastal country in the region, except Mauritius (WB 2018b, 2019c).
In our analysis, Mozambique and Singapore are chosen as appropriate targets South Africa could reach. At the same time, Botswana is the benchmark for the inland countries of Lesotho and Eswatini, and also for the costs incurred by Namibia to bring goods from South Africa.
Mozambique has a total CC for imports of US$476.12 (Table 2, row 6), which on average is 0.95% of the value of a shipment of imported goods. It is clearly much more efficient than South Africa, with a TCCM of US$833.25 per shipment, a rate of CC of 1.67% of the value of imported goods. Singapore, a pioneer in trade facilitation reform, has total CC for imports of only US$284.66 per shipment, equivalent to only 0.57% of the value of each shipment (Table 2, row 7). With its advanced IT industry, sophisticated banking organisations, and highly educated public sector, South Africa should be able to achieve either one of these benchmarks. The same logic applies to the development of a benchmark of costs associated with the second importation of the goods from South Africa to Namibia and the landlocked countries of Lesotho, Eswatini, and Botswana. With its rate of customs CC of only 0.34% of the value of the imported goods, Botswana is the benchmark for the CC for importation from South Africa.
The rates of CC of these benchmark countries are subtracted from the current CC of the SACU countries to estimate the potential efficiency gains of trade facilitation reforms. These are presented in Table 3, columns 3 and 4, using Mozambique and Botswana as benchmarks. Where Singapore and Botswana are used as the benchmark rates for 'normal' rates of trade CC, the potential efficiency improvements are reported in Table 3, columns 5 and 6.
The savings in the cost of imports for SACU from trade facilitation reform range from 0.72% to 0.87% of the value of imports, with Mozambique as the benchmark value for 'normal' compliance costs, and between 1.10% and 1.25% for Singapore.
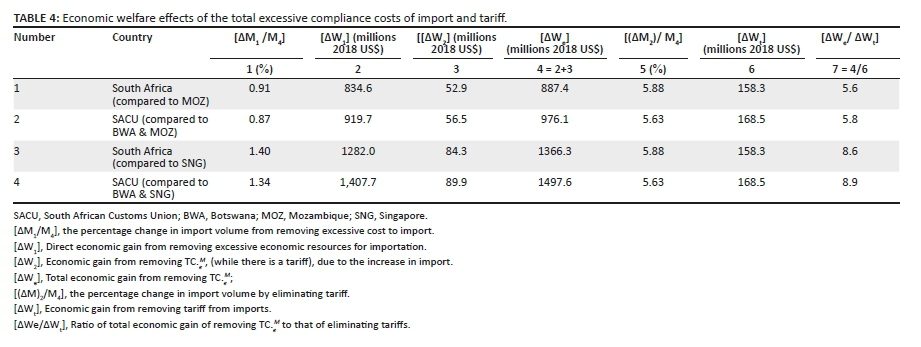
The economic efficiency impact of trade administration reforms expressed by Equations 3, 4, 5, and 7 for imports are presented in Table 4, columns 2, 3, 4, and 6, respectively.
As shown in Table 4, column 1, removing the excess CC would lead to an increase in the quantity of imports across the SACU countries of between 0.87% and 1.34%, and in South Africa of between 0.91% and 1.40%. In terms of the percentage response, the biggest impact is on the imports into South Africa.
The estimated gain to SACU countries in economic welfare from reducing transactions cost of importing is shown in Table 4, column 2, rows 2 and 4. The range in the present value of the gain in economic welfare is between US$919.7 million and US$1407.7 million annually, for the current level of imports (estimated using Eqation 3). An additional gain in economic welfare occurs with the increase in the level of imports. The incremental gain in economic welfare is between US$56.5 million and US$89.9 million annually. Combining these, the annual gain in economic welfare (Table 2, column 4, rows 2 and 4) is estimated at between US$976.2 million and US$1497.6 million. For South Africa alone, the estimated annual gain would be between US$887.4 million and US$1366.3 million. That means more than 90% of the total economic gain to SACU would accrue to South Africa.
A perspective of the relative size of the benefits of reforming the trade administration could be gained by comparing these values with the gain in welfare if all import tariffs were eliminated. Because the weighted average tariff rates (Table 1, column 3) are larger than the size of the potential rates of proposed reductions in trade transactions costs (Table 3, columns 3-6), the impact on the quantity of imports demanded in SACU is larger, at 5.63% versus 0.87% - 1.34%. However, the estimated value of the traditional measure of the deadweight loss reduction from the complete elimination of the import tariffs (Eqation 7) is reported in Table 4, column 6. The annual economic welfare gain amounts to only US$168.5 million. Approximately 94% of annual economic welfare gain resulted from the complete elimination of the import tariffs that would accrue to South Africa (US$158.3 out of US$168.5). This estimate is consistent with that of Guei et al. (2017), who found that the economic welfare gain from the FTA between South Africa and the EU would be approximately US$134 million per year. The reform of the import administration level would yield the countries of SACU between 5.8 and 8.9 times as much economic gain (Table 4, column 7). As was shown in Figure 1, the fundamental cause of this huge difference in the current level of economic efficiency losses is that the tariff only creates a triangle of economic inefficiency (triangle GCD, in Figure 1), due to the reduction in consumer demand for importables and the stimulation of the supply of importables. Most of the price impact of tariffs is borne by consumers through the payment of increased tariff revenues to the government. These tax revenues are not economic welfare costs but represent a fiscal transfer. This is in contrast to the excess trade CC that in their entirety reflect an economic resource cost to the country (area EHIG in Figure 1).
Trade compliance costs of exporting
To estimate the economic benefits from the reform in the SACU countries' export administration system that would reduce the CC, we have used Equations 8-12. The required data are the level of exports, supply elasticities of exports (Table 1), and estimates of export CC (Table 5).
In the case of exports, we suggest a little potential for reform in Eswatini, Lesotho, and Botswana. According to World Integrated Trade Solution, published by the WTO (2015), more than 90% of Botswana's exports and 37.78% of Namibia's exports are diamonds. We assume that the remaining 10% of Botswana's exports are exported via South African to third countries and will be included in South Africa's exports. If these exports are simply sold in South Africa as regionally traded goods, we exclude any potential benefits from reforming Botswana's export administration system. The exports of Eswatini and Lesotho go almost all in the first instance to South Africa (Sacolo, Mohammed & Dlamini 2018). Hence, they are treated in the same manner as non-diamond exports from Botswana. Namibia has its own ports, which are mainly used for shipping its non-diamond exports. Hence, it is assumed that all Namibia's non-diamond exports are shipped from its ports. It is the export CC of non-diamond exports that are measured by the Doing Business surveys. Thus, we apply these costs to Namibia's non-diamond exports (WB 2019b). Our analysis, therefore, focuses on the potential economic benefits of trade facilitation reform of the export administration systems in Namibia and South Africa.
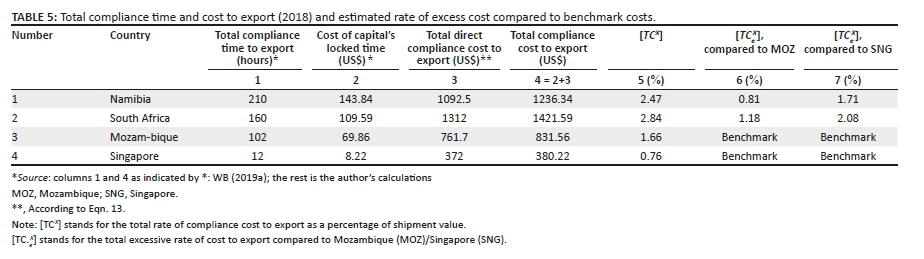
The total CC to export is the aggregation of the total value of the time costs and the direct costs associated with merchandise exportation from SACU countries (Table 5, columns 1-4). The CC associated with the administration of exports expressed as a percentage of a standard shipment of US$50 000 value, TCX, is reported in column 5: 2.47% for Namibia and 2.84% for South Africa. The corresponding benchmark rates of export CC (Table 5, rows 3 and 4) for Mozambique and Singapore are 1.66% and 0.76%, respectively, of the shipment value of export.
Subtracting these benchmark rates for the normal CC of exporting from the current rates of CC for Namibia and South Africa gives the rates of excess CC (TCeX) (Table 5, columns 6 and 7). These are the target of the proposed trade facilitation reforms. The potential reform savings for Namibia are 0.81% - 1.71% and South Africa 1.18% - 2.08% of the value of exports. These rates can be considered a tax on exports from SACU countries that finances the administrative inefficiency of processing the paperwork to facilitate the administration of the export of commodities.
The first step in analysing the impact of the reform is to see how exports would increase if the exports' CC were reduced to the level of those exporting through Mozambique and Singapore. This is estimated using Equation 9, along with the export supply elasticity and the volumes of exports of Namibia and South Africa (Table 1). The results are reported in Table 6, column 1. It is estimated that reform of the export process would increase the volume of exports by 1.03% - 1.83%.
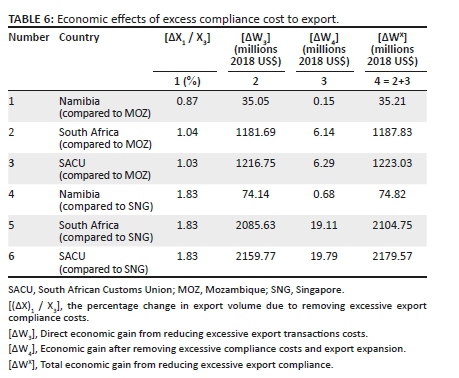
In total, the estimated economic savings in CC imposed by the trade administration are between US$1223.0 million and US$2179.6 million annually, based on the benchmark costs of Mozambique and Singapore, respectively. The contribution of Namibia to these overall efficiency gains is relatively small, at only 3% of the total gain in economic welfare.
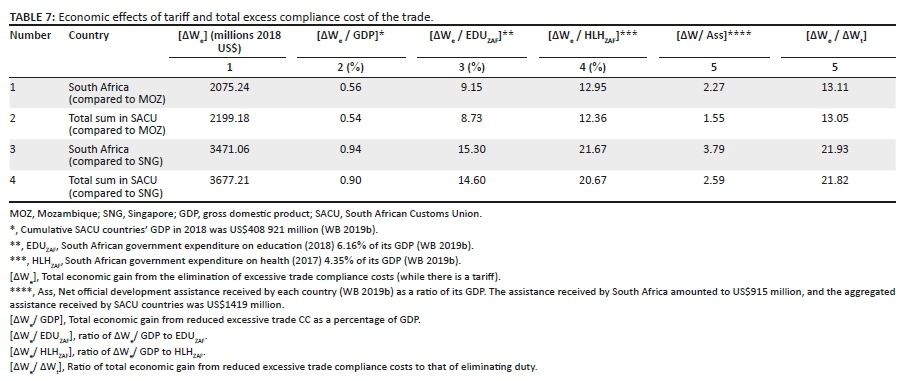
The economic efficiency won by a reduction in trade CC of both imports and exports to the level of that of Mozambique would amount annually to approximately US$2.2 billion (Table 7). If Singapore is used as the benchmark, the annual gain would be about US$3.7 billion (2018 prices). In terms of relative magnitude to other macroeconomic variables, the annual economic gains possible after this reform would be 0.54% - 0.90% of the combined GDP of the SACU countries. South Africa and the other SACU countries are wasting resources of more than half a percent of their combined GDP annually, because of an unnecessarily inefficient system of imports and export clearances and cost imposed on consumers. Without the proposed reforms, the welfare of the region is reduced annually by these amounts.
The governments of the SACU countries are strongly committed to the education of their young populations and spend approximately 6.2% of their GDP on public education services. This rather simple reform of customs and port procedures would yield a benefit to these countries of 8.7% - 14.5% of their total current expenditures on education. Comparing the annual economic gains after this reform to the South African government's average expenditure on health (4.35%) shows that this single reform would save the country from 12.36% to 20.67% of government health expenditure.
A major concern, with the imposition of import tariffs, among economists and policymakers discussing SACU's tariff policies, has been the magnitude of the efficiency costs they create (Edwards & Lawrence 2008). Table 7, column 5, shows a comparison of the relative values of the economic efficiency that could be gained from reforming the management of the international trade flow (ΔWe) to the economic efficiency gained from a complete elimination of all import tariffs (ΔWt) (Table 4, column 6). The total potential welfare gain for the SACU economic community can also be compared to the total 'net official development assistance received' (US$1419 million) in 2018. This comparison indicates that the economic welfare gain could be achieved through these reforms in trade across borders is 1.6-2.6 times greater than the value of loans and grants received by SACU member countries (Table 7, column 6). This ratio is even higher in South Africa at around 2.3-3.8 times more than the net official development assistance. The result is that inefficiency due to the excess CC is between 13 and 22 times the estimated economic inefficiency cost of SACU's tariff regime.
Conclusion and policy implications
The economic gain from reducing the excess border compliance and documentary compliance costs for imports and exports are substantial, amounting to 0.54% - 0.90% of SACU countries GDP annually. Reforming these administrative practices would provide South African residents with about 95% of the possible benefits of the whole SACU. In South Africa alone, the gain from reducing these excess CC would be worth between US$2075 million and US$3471 million. By way of comparison, the costs of implementing major trade facilitation reforms to reduce these border and documentary CC are trivial. For example, the cost of setting up a single window in Kenya was US$14.7 million.
In South Africa, the economic benefits of reducing the excessive trade CC are between US$2.1 billion and US$3.5 billion. The gain for each of the other SACU members in the case of reduction in import CC is as follows: Botswana US$31 to US$48 million, Namibia US$29 to US$42 million, Eswatini US$17 to US$25 million, Lesotho US$12 to US$17 million, while for South Africa it is US$887 to US$1366 million.
South Africa is the one that achieves much of the gain. However, more than 85% of the welfare gain in these countries is achievable through the decrease in trade CC in South Africa. This demonstrates the importance of South African's trade facilitation for welfare to improve all members of SACU.
The cost to Singapore of setting up their Trade Net system was well below US$50 million in 2019 prices, while the annual operating costs are between US$195 000 and US$1.2 million (Jenkins 1996; Valensisi et al. 2016; Yeow 1996). Given the worldwide experience in developing and developed countries, implementing such trade facilitation measures, there is little risk of failure in IT-rich South Africa. Few reforms are available to any country that would yield such widespread economic benefits, from significantly reducing the costs of intermediate input and consumer goods to stimulating international trade flows of exports and imports. Failure to proceed quickly with such reforms inflicts costs that SACU countries can ill afford.
The most important changes needed to realise these cost savings are, first and foremost, a single window administrative structure. This can be paired with risk-based customs checks, trade logistics system upgrades, regional administrative coordination, and trade stakeholder preparation and consultation.
A strong trade facilitation plan is the best way to reduce obstacles by deepening the adoption of regional trade agreements in SACU. This could lead to greater economic integration among SACU countries.
The SACU members' failure to improve costs and leverage has been a major hurdle in bringing about trade facilitation reforms. Reforming customs administrations is notoriously difficult. Corruption in such organisations and powerful unions serving port employees have often defied the institutional reforms needed to introduce modern structures. Often, reforms necessitate modern information technology, which existing administrators and employees will not be familiar with.
Given the magnitude of the possible gains, future studies should concentrate on the study of transition adoption. Future research could also investigate how such measures should be implemented to promote public interest in existing ineffective procedures. Finally, the implementation methods of effective reforms should be analysed so that a clearer understanding of the political economy of trade facilitation reform can be established.
Acknowledgements
Competing interests
The authors declare that they have no financial or personal relationships that may have inappropriately influenced them in writing this article.
Authors' contributions
This article forms part of a Ph.D. study at the Eastern Mediterranean University by S.S. with G.P.J. as the supervisor assisting with the conceptual construction of the study.
Ethical considerations
This article followed all ethical standards for research without direct contact with human or animal subjects.
Funding information
This research received no specific grant from any funding agency in the public, commercial or not-for-profit sectors.
Data availability
Data sharing is not applicable to this article, as no new data were created or analysed in this study.
Disclaimer
The views and opinions expressed in this article are those of the authors and do not necessarily reflect the official policy or position of any affiliated agency of the authors.
References
Arvis, J-F., Duval, Y., Shepherd, B., Utoktham, C. & Raj, A., 2016, 'Trade costs in the developing world: 1996-2010', World Trade Review 15(3), 451-474. https://doi.org/10.1017/S147474561500052X [ Links ]
Balistreri, E.J., Maliszewska, M., Osorio-Rodarte, I., Tarr, D.G. & Yonezawa, H., 2018, 'Poverty, welfare and income distribution implications of reducing trade costs through deep integration in Eastern and Southern Africa', Journal of African Economies 27(2), 172-200. https://doi.org/10.1093/jae/ejx024 [ Links ]
Berends, G., 2016, 'What does the EU-SADC EPA really say? An analysis of the economic partnership agreement between the European Union and Southern Africa', South African Journal of International Affairs 23(4), 457-474. https://doi.org/10.1080/10220461.2016.1275763 [ Links ]
Czermińska, M. & Garlińska-Bielawska, J., 2018, 'The pros and cons of the Economic Partnership Agreement (EPA) for the Southern African Development Community (SADC) in the context of member states' trade relations with the European Union (EU)', Central European Review of Economics & Finance 23(1), 69-85. https://doi.org/10.24136/ceref.2018.006 [ Links ]
Djankov, S., Freund, C. & Pham, C.S., 2010, 'Trading on time', The Review of Economics and Statistics 92(1), 166-173. https://doi.org/10.1162/rest.2009.11498 [ Links ]
Edwards, L. & Lawrence, R., 2008, SACU tariff policies: Where should they go from here?, CID Working Paper Series 2008.169, Harvard University, Cambridge, MA, May 2008. [ Links ]
Ferreira, L. & Steenkamp, E.A., 2020, 'Identifying regional trade potential between selected countries in the African tripartite free trade area', South African Journal of Economic and Management Sciences 23(1), a2936. https://doi.org/10.4102/sajems.v23i1.2936 [ Links ]
Fuenzalida-O'Shee, D., Valenzuela-Klagges, B. & Coryalan-Quiroz, A., 2018, 'Trade facilitation and its effects on Chile's bilateral trade from 2006 to 2014', Cepal Review 2018(124), 173-191. https://doi.org/10.18356/630ad7fa-es [ Links ]
Ghodsi, M., Grübler, J. & Stehrer, R., 2016, Import demand elasticities revisited, WIIW Working Paper 132, The Vienna Institute for International Economic Studies (wiiw), Vienna. [ Links ]
Guei, K.M.A., Mugano, G. & Le Roux, P., 2017, 'Revenue, welfare and trade effects of European Union free trade agreement on South Africa', South African Journal of Economic and Management Sciences 20(1), a1655. https://doi.org/10.4102/sajems.v20i1.1655 [ Links ]
Hassan, M., 2020, 'Africa and the WTO trade facilitation agreement: State of play, implementation challenges, and policy recommendations in the digital era', in G.O. Odularu, M. Hassan & M.A. Babatunde (eds.), Fostering trade in Africa, pp. 5-38, Springer, Cham. [ Links ]
Hassan, M., Odularu, G. & Babatunde, M.A., 2020, 'Introduction: Trade relations, business opportunities and policy instruments for fostering Africa's trade', in G.O. Odularu, M. Hassan & M.A. Babatunde (eds.), Fostering trade in Africa, pp. 1-4, Springer, Cham. [ Links ]
Hoekman, B. & Shepherd, B., 2015, 'Who profits from trade facilitation initiatives? Implications for African countries', Journal of African Trade 2(1-2), 51-70. https://doi.org/10.1016/j.joat.2015.08.001 [ Links ]
IMF, 2019, IMF data, direction of trade statistics, exports and imports by areas and countries, viewed 06 July 2019, from http://data.imf.org/?sk=9D6028D4-F14A-464C-A2F2-59B2CD424B85. [ Links ]
Jenkins, G.P., 1996, 'Information technology and innovation in tax administration', Vol. 2, in G.P. Jenkins (ed.), Information technology and innovation in tax administration, pp. 1-14, Kluwer Law International BV, Netherlands. [ Links ]
Jordaan, A.C., 2014, 'The impact of trade facilitation factors on South Africa's exports to a selection of African countries', Development Southern Africa 31(4), 591-605. https://doi.org/10.1080/0376835X.2014.907535 [ Links ]
Kee, H.L., Nicita, A. & Olarreaga, M., 2008, 'Import demand elasticities and trade distortions', The Review of Economics and Statistics 90(4), 666-682. https://doi.org/10.1162/rest.90.4.666 [ Links ]
Kohli, U., 1991, Technology, duality, and foreign trade: The GNP function approach to modeling imports and exports, Harvester Wheatsheaf, New York, NY. [ Links ]
Manwa, F., Wijeweera, A. & Kortt, M.A., 2019, 'Trade and growth in SACU countries: A panel data analysis', Economic Analysis and Policy 63, 107-118. https://doi.org/10.1016/j.eap.2019.05.003 [ Links ]
Matthee, M., Idsardi, E. & Krugell, W., 2015, 'Can South Africa sustain and diversify its exports?', South African Journal of Economic and Management Sciences 19(2), 249-263. https://doi.org/10.4102/sajems.v19i2.1324 [ Links ]
Matthee, M. & Santana-Gallego, M., 2017, 'Identifying the determinants of South Africa's extensive and intensive trade margins: A gravity model approach', South African Journal of Economic and Management Sciences 20(1), a1554. https://doi.org/10.4102/sajems.v20i1.1554 [ Links ]
Mhonyera, G., Steenkamp, E. & Matthee, M., 2018, 'Evaluating South Africa's utilisation of sustained export potential in sub-Saharan Africa', South African Journal of Economic and Management Sciences 21(1), a1927. https://doi.org/10.4102/sajems.v21i1.1927 [ Links ]
Ngalawa, H.P., 2014, 'Anatomy of the Southern African Customs Union: Structure and revenue volatility', International Business & Economics Research Journal (IBER) 13(1), 145-156. https://doi.org/10.19030/iber.v13i1.8385 [ Links ]
Perera, S. (2016). 'Trade facilitation agreement (TFA)-implementing implications,' Emerging Issues Briefing Note (5), The Commonwealth Secretariat, United Kingdom. [ Links ]
Peterson, J., 2017, 'An overview of customs reforms to facilitate trade', Journal of International Commerce and Economics, August, 2017, viewed from https://www.usitc.gov/journals. [ Links ]
Porteous, O., 2019, 'High trade costs and their consequences: An estimated dynamic model of African agricultural storage and trade', American Economic Journal: Applied Economics 11(4), 327-366. https://doi.org/10.1257/app.20170442 [ Links ]
Portugal-Perez, A. & Wilson, J.S., 2009, 'Why trade facilitation matters to Africa', World Trade Review 8(3), 379. https://doi.org/10.1017/S147474560900439X [ Links ]
Sacolo, T., Mohammed, M. & Dlamini, T., 2018, 'Evolution of trade in Eswatini from 1968 to 2015: A developmental perspective', African Review of Economics and Finance 10(2), 151-168. [ Links ]
SACU, 2002, Southern African Customs Union (SACU) agreement, viewed November 2019, from https://wits.worldbank.org/GPTAD/PDF/archive/SACU.pdf. [ Links ]
Sakyi, D. & Afesorgbor, S.K., 2019, 'The effects of trade facilitation on trade performance in Africa', Journal of African Trade 6 (1-2), 1-15. https://doi.org/10.2991/jat.k.191129.001 [ Links ]
Sakyi, D., Villaverde, J., Maza, A. & Bonuedi, I., 2017, 'The effects of trade and trade facilitation on economic growth in Africa', African Development Review 29(2), 350-361. https://doi.org/10.1111/1467-8268.12261 [ Links ]
Seck, A., 2016, 'Trade facilitation and trade participation: Are sub-Saharan African firms different?', Journal of African Trade 3(1-2), 23-39. https://doi.org/10.1016/j.joat.2017.05.002 [ Links ]
TFIG (Trade Facilitation Implementation Guide), 2020a, United Nations, trade facilitation implementation guide, case studies, viewed 09 February 2020, from http://tfig.unece.org/contents/case-studies.htm [ Links ]
TFIG (Trade Facilitation Implementation Guide), 2020b, United Nations Economic Commission for Europe (UNECE), trade facilitation implementation guide, case stories, single window implementation in Mozambique, viewed 09 February 2020, from http://tfig.unece.org/case-stories.html. [ Links ]
Tokarick, S., 2014, 'A method for calculating export supply and import demand elasticities', The Journal of International Trade & Economic Development 23(7), 1059-1087. https://doi.org/10.1080/09638199.2014.920403 [ Links ]
Turkson, F.E., Adjei, RM & Barimah, A., 2020, 'Does trade facilitation promote bilateral trade in sub-Saharan Africa? Policy and issues', in G.O. Odularu, M. Hassan & M.A. Babatunde (eds.), Fostering trade in Africa, pp. 63-96, Springer, Cham. [ Links ]
UNCTAD (United Nations Conference on Trade and Development), 2017, National trade facilitation committees: Beyond compliance with the WTO trade facilitation agreement?, Transport and Trade Facilitation Series, No. 8, viewed from https://unctad.org/en/pages/PublicationWebflyer.aspx?publicationid=1961. [ Links ]
Valensisi, G., Lisinge, R. & Karingi, S., 2016, 'The trade facilitation agreement and Africa's regional integration', Canadian Journal of Development Studies/Revue canadienne d'études du développement 37(2), 239-259. https://doi.org/10.1080/02255189.2016.1131672 [ Links ]
WB (World Bank), 2018a, Economy profile of Botswana, Doing Business, World Bank, Washington, DC, viewed November 2019, from https://openknowledge.worldbank.org/handle/10986/30679. [ Links ]
WB (World Bank), 2018b, Economy profile of Mozambique, Doing Business, World Bank, Washington, DC, viewed November 2019, from https://openknowledge.worldbank.org/handle/10986/30790. [ Links ]
WB (World Bank), 2019a, Measuring business regulations, trading across borders, methodology, viewed 03 January 2020, from https://www.doingbusiness.org/en/methodology/trading-across-borders. [ Links ]
WB (World Bank), 2019b, Data bank, World Development Indicator, World Bank, Washington, DC, viewed 17 November 2019, from http://datatopics.worldbank.org/world-development-indicators/. [ Links ]
WB (World Bank), 2019c, Trading across borders, Doing Business, World Bank, Washington, DC, viewed November 2019, from https://www.doingbusiness.org/en/data/exploretopics/trading-across-borders. [ Links ]
WTO (World Trade Organization), 2015, World trade report 2015, World Trade Organization, Geneva, viewed from www.wto.org/english/res_e/booksp_e/world_trade_report14_e.pdf. [ Links ]
WTO (World Trade Organization), 2020, Trade topics, trade facilitation, viewed 19 April 2020, from https://www.wto.org/english/tratop_e/tradfa_e/tradfa_e.htmYeow. [ Links ]
Yeow, T. C., 1996, 'The computerization of customs in Singapore trade net', in G.P. Jenkins (ed.), Information technology and innovation in tax administration, pp. 165-176, Kluwer Law International BV, The Netherlands. [ Links ]
 Correspondence:
Glenn Jenkins
jenkins@econ.queensu.ca
Received: 08 Aug. 2020
Accepted: 02 June 2021
Published: 16 Aug. 2021

