


Serviços Personalizados
Artigo
 Inglês (pdf)
 Artigo em XML
 Referências do artigo
Indicadores

Links relacionados
-
 Citado por Google
 -
 Similares em Google
Compartilhar

 Permalink
South African Journal of Economic and Management Sciences
versão On-line ISSN 2222-3436
versão impressa ISSN 1015-8812
S. Afr. j. econ. manag. sci. vol.24 no.1 Pretoria 2021
http://dx.doi.org/10.4102/sajems.v24i1.3795
ORIGINAL RESEARCH
Happiness lost: Was the decision to implement lockdown the correct one?
Stephanié RossouwI; Talita GreylingII; Tamanna AdhikariII, III
ISchool of Economics, Faculty of Business, Economics and Law, Auckland University of Technology, Auckland, New Zealand
IISchool of Economics, College of Business and Economics, University of Johannesburg, Johannesburg, South Africa
IIISchool of Business Administration, Al Akhawayn University, Ifrane, Morocco
ABSTRACT
BACKGROUND: Amid the rapid global spread of the coronavirus disease 2019 (COVID-19), many governments enforced country-wide lockdowns, likely with severe well-being consequences. The actions by governments triggered a debate on whether the costs of a lockdown, economically and in well-being, surpass the benefits perceived from a lower infection rate.
AIM: To use the Gross National Happiness index (GNH), derived from Big Data, to investigate the determinants of happiness before and during the first few months of a lockdown in a country as an extreme case, South Africa (a country with low levels of well-being and stringent lockdown regulations). Next, to estimate (1) the probability of being happy during a pandemic year, before and after the implemented lockdown, relative to the mean happiness levels of the previous year, and (2) to utilise simulations to estimate the probability of being happy if there were no lockdown.
SETTING: This study considers the effect of government-mandated lockdown on happiness in South Africa.
METHODS: We use Big Data in the forms of Twitter and Google Trends to derive variables and ordinary least squares and ordered probit estimation methods.
RESULTS: What contributes to happiness under lockdown, except for COVID-19 cases, are the factors linked to the implemented regulations themselves. If we compare scenarios pre- and post-lockdown, we report a happiness cost of 9%. The simulations indicate that assuming there were no lockdown in 2020, the relative well-being gain is 3%.
CONCLUSION: If policymakers want to increase happiness levels and the probability of achieving the same happiness levels as in 2019, they should consider factors related to the regulations that can increase happiness levels.
Keywords: happiness; COVID-19; Big Data; regulations; South Africa.
Introduction
Whereas the need for curbing the coronavirus disease 2019 (COVID-19) infection rate is understandable and the lockdown measures taken by many governments within reason, the question arises as to the well-being cost of these decisions. In this article, we define well-being as the subjective evaluative mood of a country as measured using the Gross National Happiness index (GNH) derived from Big Data (Greyling, Rossouw & Afstereo 2019). (Please note that we use the words 'well-being' and 'happiness' interchangeably).
Most discussions thus far regarding lockdowns have centred around economic loss. While the cost of lockdown on the gross domestic product (GDP) has indeed been high, there could also be a substantial loss in national well-being. Often in the past, GDP was erroneously used to measure the well-being of a nation; however, it cannot measure non-market social interactions, such as family and friendship, or attributes such as moral values, happiness or the sense of purpose in life. As such, there is an increasing demand to use subjective measures of well-being and to move beyond the classical income-based approach to measuring human development and progress (Algan et al. 2019).
Furthermore, Piekalkiewicz (2017) and Bryson et al. (2016) state that well-being predicts one's future income, affects labour market performance and increases productivity. Anik et al. (2009) and Lyubomirsky, Sheldon and Schkade (2005) argue that happiness also has consequences for the health and social sectors of a country. Unhappy individuals are physically less healthy, die at a younger age and engage more in risky behaviour, such as drinking and smoking. In contrast, happy people are more active, more creative, and better problem solvers. Therefore, maximising well-being should be a priority in policy.
Previous studies that investigated subjective well-being during pandemics found that community connectedness and not isolation was a mitigating factor in subjective well-being during the H1N1 outbreak (Jones & Salathe 2009). Additionally, those that studied mental well-being saw that anxiety levels waned along with the perception of the Severe Acute Respiratory Syndrome (SARS) virus being less of an immediate threat (Lau et al. 2008).
More recently, Rossouw et al. (2020) used the GNH to determine the probabilities to move between stages of happiness in New Zealand, using a Markov switching model. They found that the probability of moving between stages did not change significantly before and during the pandemic. However, the mean levels of happiness for these stages were much lower during the pandemic than before. Furthermore, they found that the factors of importance to New Zealand's happiness post-Covid-19 regulations implemented were related to international travel, employment and mobility. Greyling, Rossouw and Adhikari (2020a) studied the causal effect of lockdown on happiness in a cross-country study. They found that lockdown had a negative effect on happiness, notwithstanding the different country characteristics, the duration and the type of lockdown regulations. Additionally, they found that the more stringent the lockdown regulations, the greater the cost in happiness. Hamermesh (2020) used Google Trends data to predict the life satisfaction of married and single people while in government-imposed lockdown by running simulations. Not surprisingly, single people were less satisfied with life than married people. Also using Google Trends data, Brodeur et al. (2020) found an increase in searches for loneliness, worry and sadness after a lockdown was implemented, which indicates a negative effect on well-being and mental health.
Sibley et al. (2020) investigated the effect of lockdown regulations in New Zealand on institutional trust, attitudes, health and well-being, using survey data collected at two points in time (December 2019 and April 2020). Their preliminary results showed a small increase in people's sense of community and trust. However, they also found an increase in anxiety and depression post-lockdown and hinted at longer-term challenges to mental health. De Pedraza, Guzi and Tijdens (2020) investigated life dissatisfaction and feelings of anxiety in a cross-country study post-Covid-19. They found that people with poorer general health, without employment, living without a partner, choosing to live alone and not exercising daily, report higher dissatisfaction and higher anxiety. Additionally, they found that the effect of COVID-19 on dissatisfaction and anxiety levels off with a higher number of COVID-19 infection cases.
However, none of the above-mentioned studies compared the determinants of happiness before and during a lockdown in a developing country, such as South Africa, which already suffers from low levels of well-being and a poorly performing economy (an extreme country case). In addition, no other study, to the knowledge of the authors, has attempted to measure the probability that a country can adapt to previous levels of happiness after suffering the consequences of a pandemic, or used simulations to determine the happiness probabilities with and without a lockdown.
Therefore, in this study, we address the gaps in literature by firstly using the GNH, a real-time measure of well-being, derived from Big Data, to compare the determinants of happiness before and during the first months of the government-imposed lockdown. This is one of the few studies (see also Greyling et al. 2020a and 2020b; Rossouw et al. 2020, although these studies address different research questions) that investigates the effect of lockdown on happiness, making use of real-time Big Data. Other studies such as Hamermesh (2020) and Brodeur et al. (2020) also use Big Data, although they limit their analysis to Google Trends.
Secondly, we first calculate the probabilities to reach the mean happiness levels of 2019, considering that the subsamples of before and after the lockdown were implemented. Using simulations, we then address the question of whether the probability of being happy without a lockdown and a higher number of COVID-19 cases exceeds the probability of being happy with lockdown and fewer COVID-19 cases. In this regard, it is the first study that compares the probabilities to be happy in 2020, considering the mean levels of happiness in 2019 and the first study that simulates happiness levels, if we assumed that there were no lockdown in 2020.
Our results indicate that, for an extreme country case, what significantly contributes to happiness under lockdown are the factors directly linked to the implemented regulations themselves. These factors can be classified as (1) social capital issues: lack of access to alcohol, concerns about schooling and increased social media usage, and (2) economic issues: employment concerns, the threat of retrenchments and lower levels of consumption. As expected, the number of daily COVID-19 cases is negatively related to happiness. Surprisingly, we find that the stay-at-home variable is positively related to happiness after lockdown, implying that spending more time at home, without considering the other negative effects of a lockdown, increases happiness.
We find the probability of reaching the same mean happiness levels experienced in 2019, considering the two subsamples, before lockdown regulations were implemented, to be 26% and after that 17%. Thus, lockdown likely had a happiness cost of 9%. The simulation study reveals that, even considering a margin of error, people in South Africa would likely have been happier with a higher number of COVID-19 cases and no lockdown regulations (a probability of 27%), than with a lower number of COVID-19 cases and lockdown regulations (a probability of 23%).
The results of the study inform policymakers on that which significantly contributes to happiness levels during a lockdown with possible applications to other countries with similar lockdown regulations. Additionally, by making use of high-frequency real-time data, policymakers are informed of the consequences of their policy decisions with immediate effect, in comparison with significant delays in information (up to two years), associated with survey data.
The rest of the article is structured as follows. In the next section, the choice of South Africa as an extreme country case is discussed. The 'data and methodology' section describes the data, the selected variables and outlines the methodology used. The results follow, and then the article concludes.
Why South Africa?
In this study, we define a country as an extreme case if it is under stringent lockdown regulations, coupled with a failing economy and existing low levels of well-being. As such, South Africa, a developing country, represents an extreme case.
For the period before COVID-19, we found that for South Africa the mean well-being level, as measured by the GNH, was relatively low at 6.4 (measured on a scale of 0-10), when compared to the mean happiness levels of 7.3 and 7.2 for New Zealand and Australia (Greyling et al. 2019). Furthermore, considering the economic well-being of South Africans, we found that even before the negative economic impact of the pandemic, GDP was estimated to shrink by 4.8% (Bureau of Economic Analysis 2020), and the unemployment rate reached 29%. Additionally, it has been estimated that approximately 3-7 million people can potentially become unemployed as a direct consequence of the pandemic, thereby increasing unemployment rates to approximately 50% (National Treasury 2020). Moreover, South Africa's sovereign credit rating was dealt a massive blow in March 2020 when it was downgraded to junk status. Naturally, the impact of this downgrading stretched into the political sphere, creating instability, as well as impacting on the level of national debt and debt interest payments. Lastly, the consumption of South Africans has been declining in 2020, with major declines seen after lockdown.
South Africa's alert levels of lockdown regulations vary from 1 to 5, with alert level 1 the most relaxed and alert level 5 the most stringent. As South Africa manages to curb the spread of COVID-19, it moves down the alert levels and South Africans regain more of their lost freedoms. South Africa went into level 5 lockdown on 27 March 2020, which brought about some of the world's most draconian regulations. These regulations were comparable only to those implemented by countries such as Jordan and the Philippines (Farge 2020). Level 5 lockdown brought with it high economic costs which were cause for concern since South Africa was already experiencing a severe economic downturn. Additionally, South Africans faced restrictions such as not leaving their homes to travel for work, leisure or exercise, not being allowed to purchase tobacco and alcohol, while the police and armed forces were called upon to enforce these restrictions.
The data for this article spans the time period when level 5 restrictions were implemented in South Africa. At the end of the sample, South Africa was under level 4 lockdown which started on 01 May 2020. Even though South Africans were now allowed to exercise outside from 06:00 to 09:00 and purchase more than just essential goods, the sale of alcohol and tobacco was still banned.
Taking the above information into consideration, it is clear that South Africa is an example of a country as an extreme case, suffering from low levels of well-being and poor economic performance. This situation amplifies the effect of the difficult choices made between curbing the spread of the virus and the likely cost to well-being, related to strict lockdown regulations.
Data and methodology
Data
In the analyses, we make use of high-frequency daily data spanning the period from 01 January to 08 May 2020, which is 128 days.
Gross National Happiness index - The dependent variable
To measure happiness, we make use of the GNH for South Africa, which was launched in 2019. The GNH measures the evaluative mood of South Africans. To construct the GNH, we extract tweets from Twitter and apply sentiment analysis to every tweet. Sentiment analysis is the process of determining whether a piece of writing conveys a positive, negative or neutral 'opinion'. We use natural language processing (NLP) and a sentiment algorithm to determine the sentiment of a whole sentence rather than only the sentiment of a single word. This is the better choice as it helps you understand an entire opinion and not merely a word from the text. The outcome of the sentiment analysis is used in an algorithm to derive the GNH per hour. The scale of the happiness scores is from 0 and 10, with 5 being neutral, thus neither happy nor unhappy. The index is available live on the GNH website (Greyling et al. 2019) (see Rossouw & Greyling 2020 for a detailed discussion of the index).
In South Africa, the average number of tweets extracted for 2020 is 68 524 per day. South Africa has approximately 11 million Twitter users, representing a substantial sample of almost 18% of the population (Omnicore 2020). Rossouw et al. (2020) and Greyling et al. (2020a & 2020b) argue that even though Twitter is not representative, it does accommodate individuals, groups of individuals, media outlets and organisations, representing a kind of disaggregated sample, not found in survey data. Furthermore, we test the robustness of the GNH using the 'Global behaviors and perceptions at the onset of the COVID-19 pandemic data' online survey. The survey results represent 58 countries (those countries in which more than 200 individuals responded), and the total sample was 107 565 individuals (OSF 2020). Correlating the GNH with 'anxiety' and 'depression', derived from the above-mentioned survey for the period from 01 March 2020, we find a negative and significant relationship, mostly greater than 0.5 (r > 0.5). It indicates that the GNH and 'anxiety' and 'depression' measured, using survey data, showed similar but inverted trends.
Happiness tends to vary depending on the day of the week, normally with a Monday low and a Saturday high. Therefore, we adjust the time series to remove the day-of-the-week effect (Helliwell & Wang 2011; Kelly 2018).
In addition to computing the GNH, Greyling et al. (2019) extended their analysis in February 2020 to distinguish between the different emotions underpinning the tweets. The team did this to determine the emotions of a nation under challenging circumstances and in events in which one expects significant changes in emotions. Subsequently, they differentiate between eight emotions, namely sadness, surprise, disgust, anticipation, fear, anger, trust and joy.
Selection of covariates
To determine the effect of a lockdown on happiness before and after the implemented lockdown, we constructed a treatment variable, named 'lockdown'. This divides the sample into two distinct time periods: before the first regulations were implemented on 18 March 2020 and after the implementation. The first time period - before 18 March 2020, from 01 January 2020 to 17 March 2020 (77 days) - is coded as 0 and includes a period when the first positive cases were reported in South Africa, but no regulations to curb the spread were implemented as yet. The second time period - after 18 March 2020, thus from 18 March 2020 to 08 May 2020 (51 days) - is coded as 1. This period includes the initial two weeks in which there was not a total lockdown, but restrictions on social gatherings were implemented. Consequently, South Africa moved into level 5 lockdown regulations and on 01 May moved back to level 4. These were stringent and very limiting (see above for the full description).
To select the covariates included in the model, we were led by the literature and data availability. The limited time period under observation brought about further limitations as the number of covariates that could be included in the estimation, was restricted to avoid overfitting the models.
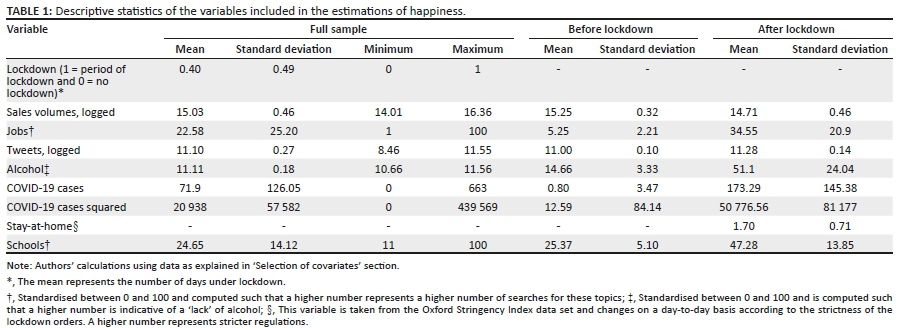
Considering the mentioned challenge and the fact that daily data was scarce, we are restricted in our choice of variables. See Table 1 for selected variables and the descriptive statistics for the covariates before and after the implemented lockdown. In the literature, it has been shown that GDP, inflation and unemployment influence happiness (Perovic & Golem 2010; Sacks et al. 2010; Stevenson & Wolfers 2008). As we were only working with four months of data, we assume the inflation rate to be relatively stable. Following the work done by Stiglitz, Sen and Fitoussi (2009), we chose to use consumption as our measure for material well-being since material living standards are more closely associated with consumption than GDP. Additionally, Sachs et al. (2018) argue that consumption is a more appropriate variable to measure economic activity from a developmental point of view, than income. Thus, to estimate consumption, we made use of the daily data available, related to credit and debit card sales, together with ATM transactions (BETI 2020). We realised that sales were not a perfect proxy for consumption; however, given our data limitations, we believed it provided a reasonable representation of the situation in South Africa. We had no daily measure of unemployment; therefore, we used the methodology as set out by Nuti et al. (2014), Brodeur et al. (2020), Greyling et al. (2020a) and Rossouw et al. (2020) and used daily searches on Google Trends for topics related to 'jobs', including searches for the South African government's Unemployment Insurance Fund as a proxy for future uncertainty related to jobs and the economy (see also Simionescu & Zimmermann 2017). We named this variable 'jobs'.
To select other variables included in the estimation of the happiness function, we relied on the analysis of the tweets. We found ourselves in uncharted territory, as there were limited studies estimating happiness functions during a lockdown (Greyling et al. 2020a; Rossouw et al. 2020). We used the studies mentioned above, as well as the contents of the tweets, to direct us to those covariates that influenced happiness during a lockdown. It was evident from the tweets that the main topics of discussion related to the regulations that were implemented to curb the spread of the virus. These, among others, included the prohibition on the sale of alcohol and tobacco. To proxy the sale of alcohol and tobacco, we followed a similar method to the one used when we derived the measures of 'concerns related to the economy'. This meant that we used the number of searches for alcohol and tobacco on Google Trends. The searches for both alcohol and tobacco followed the same trend during the lockdown period and were highly correlated (r = 0.83). To circumvent issues related to multicollinearity, as well as accommodating restrictions in the number of covariates to include in the model, we decided to include only 'alcohol' in the regressions. However, we assumed that results drawn from 'alcohol' would most likely also apply to tobacco.
Other topics mentioned were related to concerns about the schooling of children and stay-at-home orders. To proxy concerns about schooling, we once again made use of Google Trends searches for the word 'school'.
To consider the stay-at-home orders, a proxy for lack of mobility, we made use of the Oxford Stringency Index data set. It included a variable that changed on a day-to-day basis according to the strictness of the stay-at-home orders. It was an ordinal variable and equal to 0 if there were no stay-at-home orders. It changed to 1 if the recommendation was not to leave your house, 2 when people were required not to leave their houses, but could, for example, exercise, do grocery shopping and run essential errands. The value 3 indicated not leaving your home, or with restrictions, such as leaving once a week only, or only one person at a time (Hale et al. 2020). Thus, a higher value indicated stricter restrictions. We included this variable only for the period after lockdown, seeing that all values before lockdown were 0.
Furthermore, we included the number of tweets per day, as it formed part of the Twitter data extracted daily in South Africa (Greyling et al. 2019), which was a proxy for connectivity. It also gauged the opportunity cost of not being able to have face-to-face interactions, which seemed to be negatively related to happiness (Chae 2018; Wilson, Gosling & Graham 2012). As expected, the number of tweets increased markedly during the lockdown period, from an average of 60 708 tweets per day before the lockdown to almost 80 000 tweets per day during the lockdown.
We included the number of COVID-19 cases, as well as the squared number of COVID-19 cases to control for a possible non-linear relationship between the number of cases and happiness. The data for the number of cases was sourced from the European Centre for Disease Prevention and Control (2020). This data was updated each day nationally, using a wide number of mainly official sources, as well as a handful of social media outlets of the national health ministries of each country.
Methodology
Ordinary least squares regression
We first estimated the following baseline model for the full sample from 01 January to 08 May 2020:

Here, yt refers to the GNH for each day, lockdownt is our treatment variable capturing the 'closure' of both economic and social activity as a response to COVID-19. It took a value of 0 before 18 March 2020, and 1 after that. Additionally, we used several relevant covariates to account for the changes in happiness over the time under consideration. This was encapsulated in Xt.
Due to the various factors that affect happiness, there may be a correlation with some of our independent variables and the error term, leading to endogeneity concerns. The coefficient could be biased downwards or upwards, depending on the direction of the correlation between the error term and the X variable. For example, the coefficient on the indicator for 'jobs' is likely biased upwards as it, in all probability, shows the effect of concerns about jobs, as well as some other negative economic shock on happiness. In the absence of panel data or an appropriate instrument, it was difficult to ascertain causality from Equation 1. However, given the sudden and rapid spread of the pandemic and the probability of it having a knock-on effect on the economy, a study in terms of associations was also relevant. A natural extension of the work, as better data becomes available in time, would be to address these concerns.
Next, we split our sample by our treatment variable to analyse the determinants of happiness before and after the implemented lockdown. The probability of autocorrelation and heterogeneity in our data could not be ruled out, especially due to its time-series nature. However, we used robust standard errors to account for this. Additionally, there was a caveat in the choice of our controls. We only have 128 observations and, therefore, using a larger battery of covariates would lead to problems arising due to overfitting of the model.
Probabilistic models
Our second objective was to consider the change in the probability of being happy in the year 2020 because of the pandemic and lockdown. To this end, we first transformed our dependent variable on happiness, which was measured on a scale from 0 to 10, to a binary variable. We used the mean of happiness for the year 2019, which has a score of 6.35, as the cut-off point. We then estimated the following ordered probit model:

In Equation 2, Xt is the vector of the covariates as described earlier. Using the probit regressions from Equation 2, we computed the predicted probabilities of being happy first, over the entire sample, and then before and after the lockdown. Due to the method of constructing our binary dependent variable, we could interpret our computed probabilities as the probability of being happier than the mean level of happiness achieved in 2019.
Lastly, we ran a simulation model to estimate the probability of being happy in the event of no lockdown. To do this, we needed to create several counterfactual scenarios for our variables. We made the reasonable assumption of an increase in the number of COVID-19 cases due to no lockdown. To simulate the number of cases, we used the example of Spain (a worst-case scenario). Spain was a likely choice due to its population size being similar to that of South Africa's and because of its somewhat delayed lockdown response to the pandemic, thus simulating a no lockdown period. Spain reported its first COVID-19 case on 31 January 2020 and only enforced a total lockdown on 14 March - 43 days later. This fits in well with our timeline as the last date of our sample is 08 May - 43 days after the first reported case in South Africa.
Admittedly, one could also use the example of Italy. Still, due to the similar trajectory in the two countries, we believed Spain was the better choice due to the matching number of days, 43, under investigation. We imputed the number of COVID-19 cases for South Africa after its first case on 06 March. Next, to account for the lack of effect of the lockdown on our other covariates (jobs, schools, alcohol, sales and tweets), we used their 2019 values at the same time of that year - thereby accounting for seasonality. We then estimated Equation 2 and reported the resulting predicted probabilities. Thus, the predicted happiness levels against the backdrop of the COVID-19 pandemic with no lockdown regulations. Admittedly creating counterfactual situations in this way has its own concerns as it incorporates year-specific effects. Still, we believed that, even with a margin of error, the computed probability would shed light on the true effect of the lockdown on happiness levels.
Results and analysis
Descriptive results
Figure 1 shows the two periods for South Africa that we analyse: the period before the lockdown, which covers 01 January to 17 March 2020, and then the period after the first regulations were introduced and the lockdown was implemented, 18 March to 08 May 2020 (periods are divided by the vertical line in Figure 1).
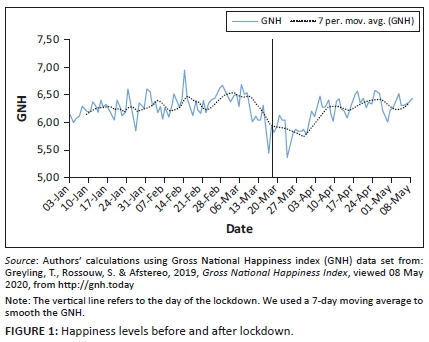
From Figure 1, it is evident that declaring a state of emergency and informing the nation that they will go into a nationwide lockdown, had a significant negative effect on the happiness level (see dotted line representing smoothed GNH - Figure 1). While South Africans understood that measures had to be implemented to curb the spread of the virus, the limited mobility, being forced to work from home, children not being allowed to attend schools, the restrictions on the sale of alcohol and tobacco, as well as limitations on exercise had a negative effect on happiness.
What about the emotions that underpin the evaluative mood expressed in the happiness index? From Figure 2, it can be seen that South Africans experienced a change in their emotions from before to after the imposed lockdown. South Africans were angrier after their first weekend spent in stringent lockdown. Additionally, the emotions expressed changed from being joyful, anticipating good things to happen and showing trust, to being angry, anticipating the worst and showing disgust and fear. Over the period, the most significant gainers, among the emotions, were anger, up by almost 10%, followed by disgust (+8%). In contrast, the biggest losers were trust (−13%) and joy (−6%).
Regression analysis
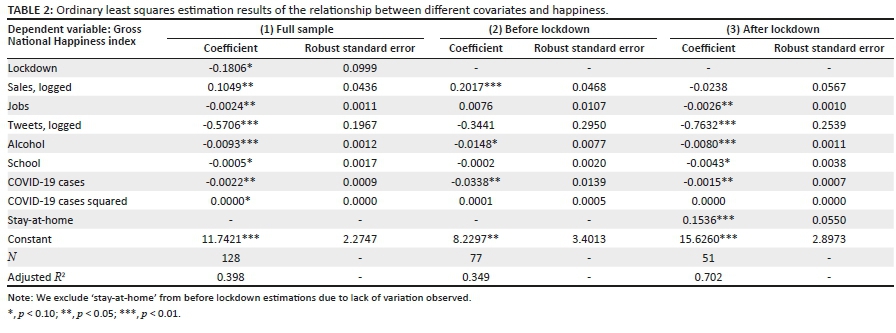
From the results of Table 2, we see that the coefficient on the treatment variable 'lockdown' is negative. Therefore it is indicative of lower happiness levels after the regulations were introduced than before.
Let us consider that the year 2020 was tainted by the COVID-19 virus from January 2020 onwards, even though the first case of COVID-19 in South Africa was only announced on 06 March 2020. We can assume that happiness functions might look different in this pandemic year compared to other years.
Table 2, panel 1, shows the statistically significant determinants of happiness since the beginning of 2020 up to 08 May 2020. Sales are significant and positively related to happiness. Sales, in this instance a proxy for consumption, are positively related to happiness; thus, if sales increase, happiness would likely also increase (Stanca & Veenhoven 2015; Wang et al. 2019). The COVID-19 cases squared variable, which we introduced to test for a quadrative relationship between COVID-19 cases and happiness, is positive and significant for the whole sample, although only at the 10% level. Additionally, the effect size is very small, and it loses its significance in the subsamples. Thus, it seemed in the early stages of COVID-19, although the effect size decreased, there was not yet sufficient evidence of a quadratic relationship. Additionally, Table 2, panel 1, shows that searches for jobs, alcohol and school, the number of tweets, as well as COVID-19 cases, are statistically significant and negatively related to happiness.
Let us consider the time periods before lockdown (01 January to 17 March 2020) (Table 2, panel 2) and after the lockdown regulations were introduced on 18 March (up to 08 May 2020, the date of completing the research article) (Table 2, panel 3). We find the following differences in the factors that influence happiness.
Sales (a proxy for consumption) were a significant predictor of happiness before the lockdown period. After the lockdown was introduced, it seems that sales were no longer of importance to happiness. This might be explained as the joy derived from buying dissipated after the lockdown, due to the experience being negative. South Africans' consumption experience was characterised by standing in queues before entering a store, only being allowed to purchase essential goods, enduring the discomfort of wearing masks and always keeping to social distancing rules.
Before the lockdown, searches for jobs were not significant. Still, in the period after the lockdown, concerns about the future of the economy show a statistically significant and negative relationship to happiness, emphasising concerns about the economic effects of the lockdown.
The number of tweets was not significant before the lockdown, but after the lockdown, it was significant and negatively related to happiness. In line with expectations, we did note that the number of tweets during the lockdown period increased significantly. As mentioned previously, it had been shown an increase in use of social media is often negatively associated with happiness (Chae 2018; Wilson et al. 2012).
After the lockdown was introduced, the sales of all alcoholic beverages and tobacco were prohibited. Once the sales were prohibited, it became more apparent that the lack of these products is a significant contributor to the happiness of South Africans. Research done by Sommer et al. (2017) proved that because of the presence of hordenine in, among others, beer, it significantly contributes to mood elevation. In South Africa, which is well-known for its high per capita beer and alcohol consumption (Statistics South Africa 2017), we noticed that the lack of alcohol played a significant role in the decrease in happiness both before and after the implemented lockdown. The effect size, however, was not significantly different from each other. This could be related to the lack of socialising, which is a large part of the South African culture and synonymous with consuming alcoholic beverages. Indeed, when reading through the actual tweets themselves, we noticed that the lack of alcohol was a major tweet topic.
Before the lockdown period searches for school, a proxy for people concerned about their children's schooling, was not significant, but after the lockdown was introduced, it became significant. This is an indication of people's concern for their children's education and the uncertainty surrounding the schooling process for 2020. Furthermore, there was uncertainty about when schools would re-open and how teaching would take place without putting children at risk.
The number of daily COVID-19 cases was negatively related to happiness, before and after the lockdown. The significant relationship before lockdown is interesting, as the first COVID-19 case in South Africa was only confirmed on 06 March 2020. This was approximately three weeks before the lockdown regulations were implemented. However, the news about COVID-19 was available since the end of December 2019, and the first tests for COVID-19 in South Africa were done in February 2020. Looking at the emotion of fear, we saw that it increased since February and was likely linked to the negative relationship between the number of COVID-19 cases and the happiness levels before lockdown, but the emotion of fear started to decline from April 2020. However, the coefficient on COVID-19 cases is smaller after the lockdown than before. This reveals that the effect of the number of cases on happiness declined over time.
Let us only consider the period after lockdown, and introduce the stay-at-home variable, a proxy for lack of mobility (Table 2, panel 3). We found that stay-at-home orders played a significant and positive role. As the stringency of the stay-at-home orders increased, happiness increased. This could be thought of as one of the positive effects of the lockdown. In general, people had more time to spend with their loved ones. Additional savings had been reported for salaried individuals due to reduced spending opportunities leading to potentially increased happiness levels. Traffic and lack of commuting expenses could also be additional explanations for this result.
In summary, what changed when the lockdown regulations to curb the spread of the COVID-19 virus were implemented? Peoples' happiness levels decreased significantly, as new factors came to the fore, which were not previously relevant or known to affect happiness levels. These include the lack of alcohol, social events and gatherings and concerns about schooling and future employment. What was concerning is that sales, a well-established determinant of happiness, were not significant after lockdown, implying that happiness levels were not increased by higher levels of consumption. This is against the standard utility theory of economics, which shows that there is a positive relationship between consumption and happiness. The main finding, however, is that the number of COVID-19 cases, although negatively related to happiness, became less of a threat to happiness after lockdown. This confirms the findings of the studies conducted by Jones and Salathe (2009) and De Pedraza et al. (2020), although they investigated mental well-being and life satisfaction.
Results on the probability of reaching 2019 happiness levels
To measure the probability that South Africa could reach the same levels of happiness in the year 2020 as experienced in 2019, we used the same models as estimated using ordinary least squares (OLS). However, with the difference that we collapsed the happiness variable to a binary variable. Now, 1 indicated a level of happiness equal to or more than the mean happiness level of 6.35 in 2019, and 0 indicated the opposite. Furthermore, we excluded the stay-at-home variable from the probit estimations to make the before and after lockdown models comparable (the reader is reminded that this variable had a value of 0 before the lockdown).
Probability to be happy for the period from 01 January to 08 May 2020 (real-life scenario)
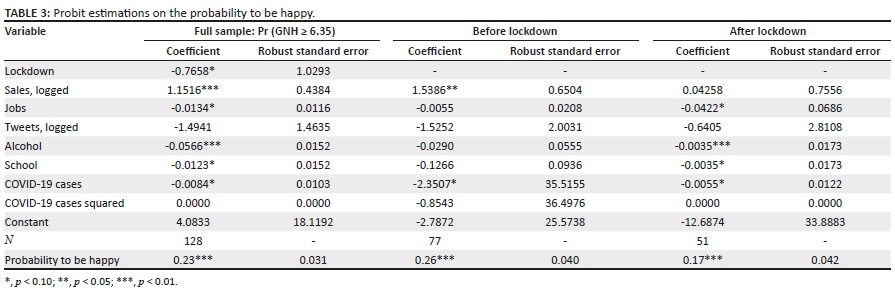
Table 3, showing the results for the whole time period from 01 January 2020 to 08 May 2020, strengthens the OLS estimation results (see Table 2) as the results were very similar, with all signs having the same direction as in the OLS estimations.
This indicates that the direction of the relationships did not change; the similarity of the results held for the period before and after the lockdown. However, the number of tweets was no longer significant in the model. We found that if we increased the cut-off point, of the happiness variable to greater than 6.35, tweets became significant (negative relationship). This implies that the probability of being very happy is negatively related to the number of tweets (re-emphasising the findings in the literature).
Thus, similar to the OLS results, sales increased the probability of being happy. In contrast, increased searches for alcohol, school and jobs decreased the probability of happiness. Additionally, as expected, the number of COVID-19 cases also decreased the probability of happiness (see Table 3). Interestingly, in the probability estimations, the squared COVID-19 cases were positive, but no longer significant, re-emphasising the OLS results.
Table 3 shows that the predicted probability of reaching the same mean happiness levels in 2020 (01 January to 08 May), as experienced in 2019, is only 23%. Thus, there is a relatively low probability that people will be as happy in 2020 as they were in 2019.
Probability to be happy for the period before lockdown, 01 January to 17 March 2020 (real-life scenario) and after lockdown, 18 March to 08 May 2020 (real-life scenario)
As mentioned, we found similar results in the probability estimations as in the OLS estimations for the period before and after the implemented lockdown.
Before the lockdown period, we found that sales increased the probability of happiness, whereas the number of COVID-19 cases decreased the probability of happiness. Let us consider the predicted probabilities of being happy before the lockdown. We found that the probability of reaching the same mean levels of happiness in 2020, as experienced in 2019 was 26%.
After the lockdown, we found that searches for jobs, alcohol, schools and COVID-19 cases decreased the probability of being happy. The probability of being as happy as in 2019 after the lockdown was only 17%. Thus, South Africans had less than a one in four chance to be as happy as they were in 2019 with the lockdown regulations in place.
Let us consider the real-life scenarios and compare the probabilities to be happy before and after lockdown. It seems that after the lockdown the probability of being happy was much lower than before: the difference between the probability of 26% and only 17%. These results reflect both (1) the observed pattern of the spread of the disease post lockdown, although it seems as if peoples' fear of the disease was dissipating, and (2) the negative effects of lockdown regulations.
Simulation of probability to be happy for the period from 01 January to 08 May 2020, if there were no lockdown
Table 4 gives the predicted probabilities from our simulation exercise in the event of no lockdown for the entire time period under consideration (01 January - 08 May 2020). The details of the simulation can be found in the methodology section. We assumed that the number of COVID-19 cases followed a similar trajectory to that in Spain, which did not impose a South African-style lockdown, whereas we assume that the other covariates had similar levels (values) to those in 2019. We estimated the probability of being happy if no lockdown were imposed, but with the presence of COVID-19. Furthermore, we assumed due to no lockdown regulations that the number of COVID-19 cases would be significantly higher than in the real-life scenario.
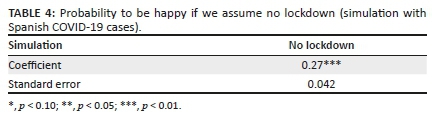
With these considerations in mind, we found that the probability of being as happy in 2020 as in 2019 was 27%. Thus, if we compared the real-life probability of happiness to that found in the simulation model, it was 23% compared to 27%. Therefore, we have a loss in the probability of happiness of 4%; we can ascribe this loss to the lockdown regulations. This indicated that even if we consider the threat of COVID-19, the stringent lockdown regulations further decreased happiness.
We do acknowledge that our assumptions were quite strict. As cases increased, so would the number of deaths and that would reduce the happiness levels. However, given the differences in the healthcare systems between South Africa and Spain, it was hard to simulate the number of deaths. Additionally, our simulations were based on behaviour of people which in 2019 was assumed to be 'normal'. As the pandemic goes on, we know that people's behaviour would change. Thus, the probability estimates we got, are to be understood against this backdrop.
One caveat holds: the population of South Africa is approximately 9.5 million more than that of Spain (46 million in 2020), so it is plausible that the number of cases in South Africa could be higher, which would make the probability of being happy, slightly lower than our estimations. But in general, even considering some margin of error, it seems that the lockdown regulations created a loss in the probability to be happy.
Conclusion
In this article, we used the GNH to explore the factors associated with happiness during the COVID-19 pandemic, and we investigate if these factors differed for the period before and after the lockdown. Furthermore, we investigated the probabilities to reach the mean happiness levels of 2019, considering the time period before and after the lockdown. Additionally, we simulated the probability of happiness if there were no lockdown in South Africa and an increased number of COVID-19 cases.
This is one of the first studies to use a real-time measure of well-being, derived from Twitter together with other variables derived from Google Trends, to estimate the factors related to well-being during a pandemic and provide timely results to policymakers. It is also one of the very few studies that focus on a developing country or a country as an extreme case, such as South Africa, which has low levels of well-being and has had very stringent lockdown regulations. In addition, this is the first study that compares the probabilities to be happy in 2020, considering the mean levels of happiness in 2019. Lastly, this is the first study to simulate happiness levels if we assume that there were no lockdown in 2020 amid an increase in the number of COVID-19 cases.
Our results indicate that, for a country as an extreme case, what significantly contributes to happiness under lockdown are the factors directly linked to the regulations that were implemented. These factors can be classified as: (1) social capital issues: lack of access to alcohol, concerns about schooling and increased social media usage, and (2) economic issues: employment concerns, the threat of retrenchments and lower levels of consumption. As expected, the number of daily COVID-19 cases was negatively related to happiness. Surprisingly, we found that the stay-at-home variable is positively related to happiness, implying that spending more time at home, without considering the other negative effects of a lockdown, increased happiness.
We found the probability of being as happy as in the year 2019 with lockdown regulations implemented to be 17% and 26% without the lockdown. Thus, lockdown likely had a happiness cost of 9%. The simulation study revealed that, even considering a margin of error, people in South Africa would likely have been happier with an increased number of COVID-19 cases and no lockdown regulations (a probability of 27%), than with a lower number of COVID-19 cases and lockdown regulations (a probability of 23%).
Considering the results mentioned above, it ultimately means that if policymakers want to increase happiness levels and increase the probability to achieve the happiness levels of 2019, they must consider those factors that significantly contribute to peoples' happiness. These factors include allowing people some of their lost comforts by reinstating the sale of alcohol and tobacco. People should be allowed to return to work, or the circumstances for working from home should be enhanced. Furthermore, making it possible for children to be schooled (online teaching or schooling that allows for social distancing) and allowing people to restore a certain degree of their consumption patterns while being careful to prevent the spread of COVID-19.
Additionally, policymakers should assure citizens that there is a credible plan to get the economy, which is currently in dire straits, back on track. Such an economic plan should stimulate growth, create job opportunities and increase employment rates, supply the necessary infrastructure and deal with curbing vast budget deficits and debt burdens.
One shortcoming of this study is the inability to draw heterogeneous within-country conclusions, seeing that we employ country-level representative indicators for happiness. Thus, it is important to interpret our results as the mean effect on happiness.
Acknowledgements
We thank AFSTEREO for the IT support in the construction of the happiness index and accompanied emotions.
Competing interests
The authors declare that they have no financial or personal relationships that may have inappropriately influenced them in writing this article.
Authors' contributions
S.R., T.G. and T.A. contributed equally to the design, formulation and execution of the study.
Ethical considerations
This article followed all ethical standards for research without direct contact with human or animal subjects.
Funding information
This work was supported by the University Research Committee Funding of the University of Johannesburg. The funders had no role in study design, data collection and analysis, decision to publish, or preparation of the manuscript.
Data availability
Data will be made available upon reasonable request to the corresponding author, S.R., but the algorithms used for the calculation of the happiness index remain under the stewardship of the authors.
Disclaimer
The views and opinions expressed in this article are those of the authors and do not necessarily reflect the official policy or position of any affiliated agency of the authors.
References
Algan, Y., Murtin, F., Beasley, E., Higa, K. & Senik, C., 2019, 'Well-being through the lens of the Internet', PLoS One 14(1), e0209562. https://doi.org/10.1371/journal.pone.0209562 [ Links ]
Anik, L., Aknin, L.B, Norton, M.I. &. Dunn, E.W., 2009, Feeling good about giving: The benefits (and costs) of self-interested charitable behavior, Harvard Business School Marketing Unit Working Paper No. 10-012, viewed 15 May 2020, from https://ssrn.com/abstract=1444831. [ Links ]
BETI, 2020, Coronavirus causes massive declines in the BETI, viewed 07 May 2020, from https://www.bankservafrica.com/api/public/blogblob/5e96d10c671966004398dfb5. [ Links ]
Brodeur, A., Clark, A.E., Fleche, S. & Powdthavee, N., 2020, 'Assessing the impact of the coronavirus lockdown on unhappiness, loneliness, and boredom using Google Trends', arXiv 2004, 12129, viewed 18 May 2020, from https://ui.adsabs.harvard.edu/abs/2020arXiv200412129B/abstract. [ Links ]
Bryson, A., Clark, A.E., Freeman, R.B. & Green, C., 2016, 'Share capitalism and worker well-being', Labour Economics 42, 151-158. https://doi.org/10.1016/j.labeco.2016.09.002 [ Links ]
Bureau of Economic Analysis, 2020, Gross domestic product, 1st quarter 2020 (advance estimate), viewed 20 April 2020, from https://www.bea.gov/news/2020/gross-domestic-product-1st-quarter-2020-advance-estimate. [ Links ]
Chae, J., 2018, 'Re-examining the relationship between social media and happiness: The effects of various social media platforms on reconceptualised happiness', Telematics and Informatics 35(6), 1656-1664. https://doi.org/10.1016/j.tele.2018.04.011 [ Links ]
De Pedraza, P., Guzi, M. & Tijdens, K., 2020, Life dissatisfaction and anxiety in COVID-19 pandemic, GLO Discussion Paper No. 544, Global Labor Organization, Essen. [ Links ]
European Centre for Disease Prevention and Control, 2020, Data on COVID-19, viewed 08 May 2020, from https://www.ecdc.europa.eu/en/publications-data/download-todays-data-geographic-distribution-covid-19-cases-worldwide. [ Links ]
Farge, E., 2020, 'U.N. raises alarm about police brutality in lockdowns', Reuters Events, 28 April, 2020, viewed 02 May 2020, from https://www.reuters.com/article/us-health-coronavirus-un-rights-idUSKCN2291X9. [ Links ]
Google, 2020, COVID-19 community mobility report, viewed 07 May 2020, from https://www.gstatic.com/Covid-19/mobility/2020-05-07_ZA_Mobility_Report_en.pdf. [ Links ]
Green, S.B., 1991, 'How many subjects does it take to do a regression analysis?', Multivariate Behavioral Research 26(3), 499-510, viewed 20 May 2020, from https://doi.org/10.1207/s15327906mbr2603_7. [ Links ]
Greyling, T., Rossouw, S. & Afstereo, 2019, Gross National Happiness Index, viewed 08 May 2020, from http://gnh.today. [ Links ]
Greyling, T., Rossouw, S. & Adhikari, T., 2020a, A tale of three countries: How did Covid-19 lockdown impact happiness?, GLO Discussion Paper No. 584, Essen, viewed n.d., from http://hdl.handle.net/10419/221748. [ Links ]
Greyling, T., Rossouw, S. & Adhikarim, T., 2020b, Happiness-lost: Did governments make the right decisions to combat Covid-19? A new GLO Discussion Paper, GLO Discussion Paper No. 556 [Preprint], viewed n.d., from https://glabor.org/happiness-lost-did-governments-make-the-right-decisions-to-combat-covid-19-a-new-glo-discussion-paper/. [ Links ]
Hale, T., Petherick, A., Phillips, T. & Webster, S., 2020, Variation in government responses to COVID-19, Working Paper 31, Blavatnik School of Government, Oxford. [ Links ]
Hamermesh, D.S., 2020, Lockdowns, loneliness and life satisfaction, IZA Discussion Paper Series No. 13140, Institute of Labor Economics, Bonn. [ Links ]
Helliwell, J. & Wang, S., 2011, 'Weekends and subjective well-being', Social Indicators Research 116, 389-407. https://doi.org/10.1007/s11205-013-0306-y [ Links ]
Jones, J.H. & Salathe, M., 2009, 'Early assessment of anxiety and behavioral response to novel swine-origin influenza A(H1N1)', PLoS One 4(12), e8032. https://doi.org/10.1371/journal.pone.0008032 [ Links ]
Kelly, T., 2018, 'The mid-week effect and why Thursdays are blue: The weekly rhythm of satisfaction in Hungary', Czech Sociological Review 54(3), 371-400. https://doi.org/10.13060/00380288.2018.54.3.411 [ Links ]
Lau, A.L.D., Chi, I., Cummins, R.A., Lee, T.M.C., Chou K.L. & Chung, L.W.M., 2008, 'The SARS (Severe Acute Respiratory Syndrome) pandemic in Hong Kong: Effects on the subjective well-being of elderly and younger people', Ageing and Mental Health 12(6), 746-760. [ Links ]
Lyubomirsky, S., Sheldon, K.M. & Schkade, D., 2005, 'Pursuing happiness: The architecture of sustainable change', Review of General Psychology 9(2), 111-131. https://doi.org/10.1037/1089-2680.9.2.111 [ Links ]
National Treasury, 2020, Briefing by the National Treasury on financial implications of Covid-19 on both the economy and budget, viewed 08 May 2020, from http://www.treasury.gov.za/comm_media/press/2020/JT%20SCoF%20and%20SCoA%20briefing%20COV19.pdf. [ Links ]
Nuti, S.V., Wayda, B., Ranasinghe, I., Wang, S., Dreyer, R.P., Chen, S.I. & Murugiah, K., 2014, 'The use of Google trends in health care research: A systematic review', PLoS One 9(10), e109583. https://doi.org/10.1371/journal.pone.0109583 [ Links ]
Omnicore, 2020, Omnicore agency, viewed 06 March 2020, from https://www.omnicoreagency.com/. [ Links ]
OSF, 2020, Global behaviors and perceptions in the COVID-19 pandemic, viewed 08 May 2020, from https://osf.io/g7fn9/. [ Links ]
Perovic, L. & Golem, S., 2010, Investigating macroeconomic determinants of happiness in transition countries: How important is government expenditure? Eastern European Economics 48(4), 59-75. [ Links ]
Piekalkiewicz, M., 2017, 'Why do economists study happiness?', Economic and Labour Relations Review 28(3), 361-377. https://doi.org/10.1177/1035304617717130 [ Links ]
Rossouw, S. & Greyling, T., 2020, 'Big data and happiness', in K.F. Zimmermann (ed.), Handbook of labor, human resources and population economics, pp. 1-35, Springer, Cham. https://doi.org/10.1007/978-3-319-57365-6_183-1 [ Links ]
Rossouw, S., Greyling, T., Adhikari, T. & Morrison, P.S., 2020, Markov switching models for happiness during a pandemic: The New-Zealand experience, GLO Discussion Paper No. 494, Global Labor Organization, Essen. [ Links ]
Sachs, J., Schmidt-Traub, G., Kroll, C., Lafortune, G. & Fuller, G., 2018, SDG index and dashboards report 2018, Bertelsmann Stiftung and Sustainable Development Solutions Network, New York, NY. [ Links ]
Sacks, D.W., Stevenson, B. & Wolfers, J., 2010, Subjective well-being, income, economic development and growth, Federal Reserve Bank of San Francisco Working Paper Series 2010-28, viewed 12 May 2020, from http://www.frbsf.org/publications/economics/papers/2010/wp10-28bk.pdf. [ Links ]
Sibley, C.G., Greaves, L., Satherley, N., Wilson, M., Lee, C., Milojev, P. et al., 2020, 'Short-term effects of the COVID-19 pandemic and a nationwide lockdown on institutional trust, attitudes to government, health and well-being', American Psychological Association 75(5), 618-663. [ Links ]
Simionescu, M. & Zimmermann, K.F., 2017, Big data and unemployment analysis, Global Labor Organization, Maastricht. [ Links ]
Sommer, T., Hübner, H., E Kerdawy, A., 2017, 'Identification of the beer component hordenine as food-derived dopamine D2 receptor agonist by virtual screening a 3D compound database', Scientific Reports 7, 44201. https://doi.org/10.1038/srep44201 [ Links ]
Stanca, L. & Veenhoven, R., 2015, 'Consumption and happiness: An introduction', International Review of Economics 62, 91-99. https://doi.org/10.1007/s12232-015-0236-x [ Links ]
Statistics South Africa, 2017, Beer more popular than vegetables, viewed 04 May 2020, from http://www.statssa.gov.za/?p=10269. [ Links ]
Stevenson, B. & Wolfers, J., 2008, Economic growth and subjective well-being: Reassessing the Easterlin paradox, Working Paper No. w14282, National Bureau of Economic Research, Cambridge, MA. [ Links ]
Stiglitz, J.E., Sen, A.K. & Fitoussi, J.P., 2009, Report by the commission on the measurement of economic performance and social progress, Commission on the Measurement of Economic Performance and Social Progress, Paris. [ Links ]
Wang, H., Cheng, Z. & Smyth, R., 2019, 'Consumption and happiness', The Journal of Development Studies 55(1), 120-136. [ Links ]
Wilson, R.E., Gosling, S.D. & Graham, L.T., 2012, 'A review of Facebook research in the social sciences', Perspectives on Psychological Science 7(3), 203-220. https://doi.org/10.1177/1745691612442904 [ Links ]
 Correspondence:
Stephanié Rossouw
stephanie.rossouw@aut.ac.nz
Received: 07 Aug. 2020
Accepted: 13 Dec. 2020
Published: 28 Apr. 2021
Note: Dr Tamanna Adhikari is a Research Associate at the School of Economics, College of Business and Economics, University of Johannesburg, Johannesburg, South Africa.

