


Serviços Personalizados
Artigo
 Inglês (pdf)
 Artigo em XML
 Referências do artigo
Indicadores

Links relacionados
-
 Citado por Google
 -
 Similares em Google
Compartilhar

 Permalink
South African Journal of Economic and Management Sciences
versão On-line ISSN 2222-3436
versão impressa ISSN 1015-8812
S. Afr. j. econ. manag. sci. vol.24 no.1 Pretoria 2021
http://dx.doi.org/10.4102/sajems.v24i1.3652
ORIGINAL RESEARCH
Broad-Based Black Economic Empowerment and corporate financial health
Jan A. DreyerI; Suzette ViviersII; Nadia Mans-KempII
ISchool of Accountancy, Stellenbosch University, Stellenbosch, South Africa
IIDepartment of Business Management, Stellenbosch University, Stellenbosch, South Africa
ABSTRACT
BACKGROUND: Legislation was implemented in South Africa in 2003 and revised in 2013 to promote Broad-Based Black Economic Empowerment (B-BBEE).
AIM: To investigate the relationship between B-BBEE compliance and a range of financial health measures among publicly listed companies.
SETTING: Altogether 379 companies listed on the Johannesburg Stock Exchange over the period 2004-2015.
METHODS: Data on the sampled companies' B-BBEE scores (in total and per element) were sourced from Empowerdex, whereas financial data were downloaded from Bloomberg. Panel regressions were computed to investigate hypothesised relationships
RESULTS: A significant increasing trend was noted in B-BBEE compliance over the research period. No significant relationships were found between the total B-BBEE score, individual B-BBEE elements and any of the considered accounting-based measures (annual percentage change in turnover, return on sales, return on assets and return on equity). A significant negative relationship was observed between the market-based price/earnings ratio and total B-BBEE score, while a significant positive relationship was noted with the cost of equity. The latter seems to indicate a negative perception among shareholders towards B-BBEE.
CONCLUSION: Although B-BBEE legislation has been partially successful, more can be done to achieve its goal of empowering black employees and small business owners. Management teams should be more diverse and greater emphasis should be placed on socio-economic development and skills development. Companies should caution against overemphasising the importance of black ownership, as shareholders seem to view this B-BBEE element in a somewhat negative light.
Keywords: Broad-Based Black Economic Empowerment; social justice; financial performance; cost of equity; risk.
Introduction
A new era dawned in South Africa in 1994 as the apartheid regime was replaced by a democratic one and freedom for all citizens seemed possible at last. Amidst the changing political landscape, the late president Nelson Mandela pleaded for reconciliation among all racial groups. He stated that physical freedom was not sufficient, and that economic freedom had to be cultivated (Ponte, Roberts & Van Sittert 2007; Tangri & Southall 2008). A staggering 80% of black business owners felt that their foundation was weak at the end of apartheid, and that they could not compete fairly with white individuals (Masito 2007). One suggestion to level the playing field was to introduce legislation to promote Black Economic Empowerment (Acemoglu, Gelb & Robinson 2007; Jeffrey 2014).
Legislation has been introduced in other contexts to address race and gender imbalances in the labour force in general and at board level in particular. For example, in 2003, only 9% of all directors of listed companies in Norway were women. To address this imbalance, a 40% mandatory quota was introduced (Ahern & Dittmar 2012). Although the legislation was initially opposed (Wiesema & Mors 2016), attitudes have since changed (Seierstad 2016).
A number of laws were promulgated in South Africa to promote racial equality, the most prominent being the Employment Equity Act (No. 55 of 1998) and the Broad-Based Black Economic Empowerment (B-BBEE) Act (No. 53 of 2003) (hereafter referred to as the 2003 Act). In drafting the latter, the Black Economic Empowerment (BEE) Commission (2001) advocated that B-BBEE should be a 'people-centred strategy' which should empower all black people in every sphere of life.
In contrast to Norway's board gender quotas, compliance with the 2003 Act is only mandatory for companies doing business with the South African government. As non-compliance does not result in penalties, a mere 60% of companies surveyed in 2016 achieved a desirable score (BEE Commission 2017). Although the average score increased slightly from the previous year, it does suggest that some companies are not taking B-BBEE compliance seriously.
As B-BBEE is aimed at rectifying the injustices of the past, Pike, Puchert and Chinyamurindi (2018) argued that the phenomenon should be studied through the lens of the social justice theory. Governments should accordingly aim to provide economic systems that promote the principles of equality and fairness (Rawls 1999). Sartorius and Botha (2008) reported that compliance soon after the promulgation of the 2003 Act was primarily driven by the view that B-BBEE is a necessary and important step in rebuilding the South African economy. Scholars have, however, become more critical as the years passed with many claiming that legislation only benefits a few elite citizens (Hoffman 2008; Patel & Graham 2012; Tangri & Southall 2008), while creating very little wealth for the disadvantaged majority in the country (Andrews 2008; Krüger 2011).
Compliance with the 2003 Act can furthermore be motivated by the organisational legitimacy theory. As initially explained by Dowling and Pfeffer (1975), organisational legitimacy refers to the combination of a company's values and objectives, and the values and objectives of the broader environment of which they form part. In the context of B-BBEE, attention should thus be given to economic upliftment and corrective action to amend past injustices to gain organisational legitimacy.
Apart from the social justice and legitimacy perspectives, South African and foreign companies are increasingly questioning whether there is a clear financial motivation to comply and improve compliance with the 2003 Act (De Wet 2016; Kleynhans & Kruger 2014). Contradictory results have been reported on the relationship between B-BBEE and financial performance in previous studies (Acemoglu et al. 2007; Kleynhans & Kruger 2014; Mathura 2009; Morris 2018; Van der Merwe & Ferreira 2014). It should, however, be noted that these authors utilised relatively small samples, mainly employed accounting-based and market-based performance measures and, with the exception of Morris (2018) and Van der Merwe and Ferreira (2014), focused on total B-BBEE scores without accounting for the individual elements of the scorecard.
In this study, a more comprehensive analysis was therefore conducted. Attention was not only given to the total B-BBEE score that a company achieved on the Department of Trade and Industry's (DTI) scorecard, but also to the individual elements of the scorecard, including ownership, management, employment equity, skills development, preferential procurement, enterprise development and socio-economic development. The study covered a large sample of 379 companies that were listed on the Johannesburg Stock Exchange (JSE) for more than a decade (2004-2015). Broad-Based Black Economic Empowerment data were sourced from Empowerdex, a leading B-BBEE rating agency in South Africa. Financial health was measured in terms of accounting, market-based and value-based performance, a company's cost of equity and default risk probability. Data on all of these measures were downloaded from the Bloomberg (2018) database.
The aim of the study was to investigate the relationship between B-BBEE scores (in total and per element) and various financial health measures. Directors and managers are more likely to implement B-BBEE strategies if increased compliance is associated with improved financial results. Wider acceptance of B-BBEE among locally listed companies could have a positive economic impact in many ways. A discussion on the rationale and application of B-BBEE will be presented next, followed by pertinent research on the financial motives to enhance B-BBEE compliance. Thereafter the methods used to collect and analyse secondary data will be outlined, followed by pertinent findings. Recommendations will then be offered to policymakers, corporate decision-makers and shareholders.
The rationale and application of Broad-Based Black Economic Empowerment codes in South Africa
Following the transition from the apartheid government to a democratic government in 1994, political equality was deemed insufficient to rectify the social and economic inequalities permeating South African society at the time (Acemoglu et al. 2007). In line with the belief that policy was vital to affect economic transformation, the 2003 Act was promulgated, and revised in 2013 (DTI 2013; Republic of South Africa 2003).
The 2003 Act compelled all companies with a turnover of more than R10 million per year to comply with a set of requirements to promote equality and increase broad-based and effective participation of black people in the local economy (Republic of South Africa 2003). The 2004 draft of the Codes of Good Practice focused on seven elements of economic empowerment, namely ownership, management, employment equity, skills development, preferential procurement, enterprise development and other elements (collated as the residual element) (DTI 2004). These elements provide a common base for measuring compliance with the 2003 Act.
The 2004 Codes were adjusted in 2007 and 2013 to promote companies' level of participation. The latest 2013 Codes came into effect on 01 May 2015 (Empowerdex 2016). The weightings and requirements of the compliance levels were amended. According to Empowerdex (2016), the 2013 Codes were likely to have a negative impact on the B-BBEE ratings of businesses, as the requirements became stricter. The difference in elements and weighting for the respective elements of the 2004, 2007 and 2013 Codes are shown in Table 1.
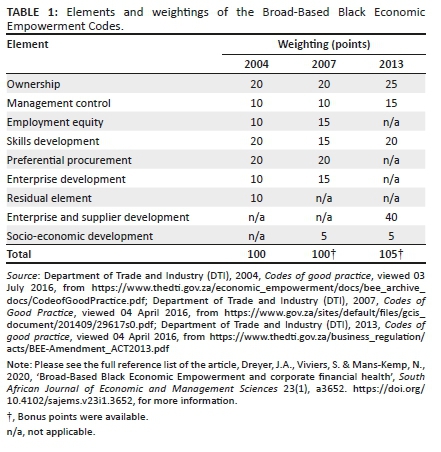
Perusal of Table 1 reveals that there has been limited change in the weightings of the elements in the 2004 draft Codes compared to the 2007 Codes. There were only slight changes in the employment equity and skills development weightings. The 2004 Codes also made provision for a residual element, which entailed a company's corporate social investment activities. In the 2007 Codes, the residual element was renamed socio-economic development initiatives.
A number of changes occurred in 2013. The entire weighting for employment equity was distributed to ownership, management control and skills development in equal proportions. Emphasis shifted to a representative workforce and the empowerment of black owners and managers. Preferential procurement and enterprise development were consolidated into enterprise and supplier development. The aim is to assist and accelerate the development of small to medium enterprises owned by black people (DTI 2013).
According to Magure (2012), reformative policy should be a by-product of economic policy focusing on economic growth. Marazanye (2016) added that stakeholder buy-in is critical for the success of any reforming act. Without stakeholder buy-in, the act becomes a legal and financial burden to conducting business and is likely to result in failure. Chidede and Warikandwa (2017) added that foreign direct investment is critical to economic growth. As such, a reformative Act should be implemented in such a way that foreign direct investors are not deterred from investing in a country.
According to De Wet (2016), investors allocating capital to companies with high B-BBEE scores are typically interested in the potential financial benefit in addition to the moral justification. In this study focus is therefore placed on the possible financial motives for companies to engage in B-BBEE compliance.
Prior studies on the financial motives for companies to engage in Broad-Based Black Economic Empowerment activities
Financial benefits that are related to B-BBEE compliance can be measured by using accounting-based, market-based, value-based and risk-based metrics. While accounting-based metrics measure the historic profitability of a company, market-based measures account for the creation of shareholder wealth and expectations regarding future profits (Verweire & Van den Berghe 2004). Value-based measures reflect profit relative to the cost of the capital. Default risk probability indicates whether companies with increased B-BBEE compliance would be more or less likely to meet their debt repayments (Bloomberg 2018).
A number of researchers considered the relationship between a company's total B-BBEE score and accounting-based financial performance (Acemoglu et al. 2007; Kleynhans & Kruger 2014), and between total B-BBEE score and market-based financial performance (De Villiers & Ferreira 2011; Mathura 2009; Morris 2018; Van der Merwe & Ferreira 2014). These scholars reported inconclusive results. In their evaluation of the individual elements of the B-BBEE scorecard, Van der Merwe and Ferreira (2014) also reported conflicting observations. Whereas a significant positive association existed between management control and total share returns for the top empowerment companies over the period 2005-2011, significant negative associations were noted between the ownership and preferential procurement elements of the B-BBEE scorecard and total share returns. The authors concluded that the costs relating to these two B-BBEE elements exceeded the perceived benefits of being compliant in the short term.
Morris (2018) took a slightly different approach and evaluated the link between business risk and the individual elements of the DTI's B-BBEE scorecard. She found no significant relationships between any of the elements and the sampled companies' unleveraged betas (which she used as a proxy for business risk). This study covered 137 industrial firms listed on the JSE over the period 01 January 2010 to 30 April 2015. Based on the empirical evidence, Morris (2018) concluded that B-BBEE:
… should not be classified as a business risk factor [for JSE-listed industrial companies] and should not be treated with underlying bias (racial or otherwise) as a problematic issue to be addressed as part of an entity's corporate risk management strategy. (p. 115)
Other authors in the field performed event studies to compute cumulative abnormal returns before and after B-BBEE equity deal announcements. With the exception of Mehta and Ward (2017) who reported a significant positive short-term and significant negative long-term impact, others reported insignificant results (Chipeta & Vokwana 2011; Strydom, Christison & Matias 2009; Ward & Muller 2010; Wolmarans & Sartorius 2009). Akinsomi (2016) compared the risk-adjusted returns between listed B-BBEE compliant and non-compliant property companies in South Africa from 2006 to 2012. The author found that investors are more likely to provide capital to compliant companies as they have significantly higher returns than their non-compliant counterparts. The growing number of scholars evaluating the market impact of B-BBEE activities (which are reflected in companies' B-BBEE scores) attest to the importance that local and foreign investors attach to the topic.
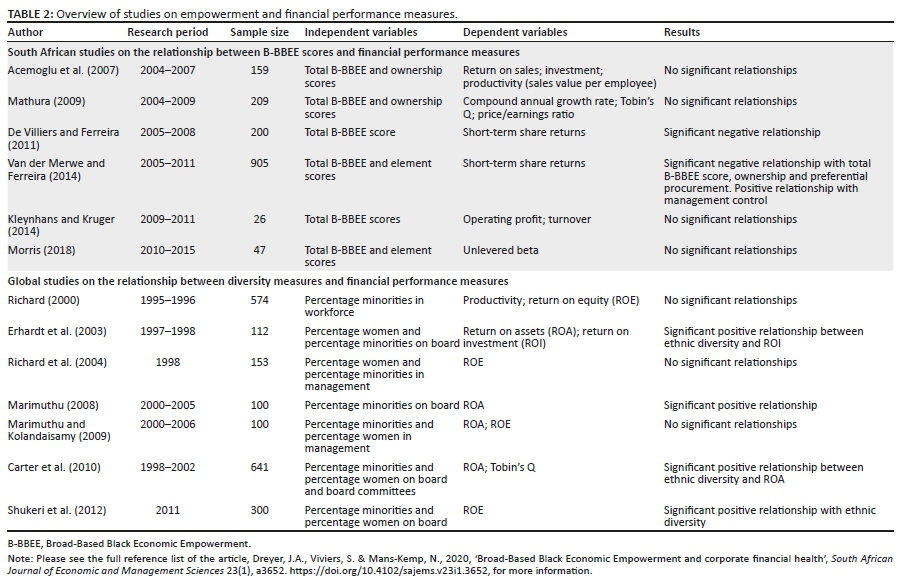
The mixed evidence presented by prior researchers compelled the authors to look at more aspects of financial health. This more holistic approach provided a different perspective on financial performance and risk. As far as could be established, no previous studies employed a combination of accounting-based, market-based, value-based and risk-based measures when assessing B-BBEE compliance. A summary of local and international studies on the relationship between B-BBEE (in the South African context) and ethnic diversity (in the international context) and various financial performance measures are presented in Table 2.
Care should be taken when interpreting some of the results indicated in Table 2, given the small sample sizes that were considered. Kleynhans and Kruger (2014) rightfully suggested that a longer-term study should be conducted to draw valid conclusions on the relationship between profitability and B-BBEE. As indicated in Table 2, international authors typically measured ethnic diversity in terms of the percentage of minority directors serving on boards. The majority of these studies yielded positive results. In contrast, Mans-Kemp and Viviers (2015) reported a negative relationship between the percentage of black directors and total share returns for a sample of JSE-listed companies.
Given the stated gaps in the literature, a comprehensive analysis was conducted by including B-BBEE scores in total and per element. The relationships between these B-BBEE measures and a range of accounting-based, market-based and value-based measures, cost of equity and default risk probability were investigated over a longer study period and for a larger sample in comparison to previous authors. The following hypotheses were formulated:
Ha1: There was a relationship between total B-BBEE scores and the financial health of selected JSE-listed companies over the period 2004-2015.
Ha2: There was a relationship between the individual B-BBEE element scores and the financial health of selected JSE-listed companies over the period 2004-2015.
Methods
In this section, the collection and analysis of quantitative B-BBEE and financial health data for 379 companies (1767 observations over 12 years) will be explained.
Sample selection
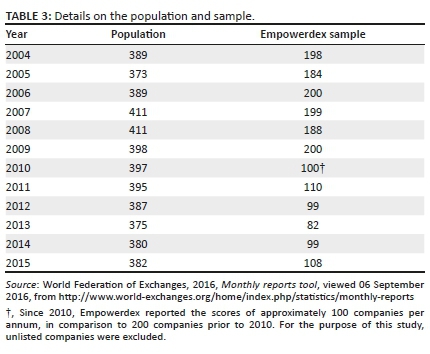
Since the study focused on the financial health of companies listed on the JSE, the population included all companies listed on the bourse over the study period (see Table 3). The sample included all companies that were included in Empowerdex's list of most empowered companies from 2004 to 2015. The list is annually populated based on voluntary participation by companies. Empowerdex ranks these companies based on their total B-BBEE scores and releases the scores of the most empowered companies.
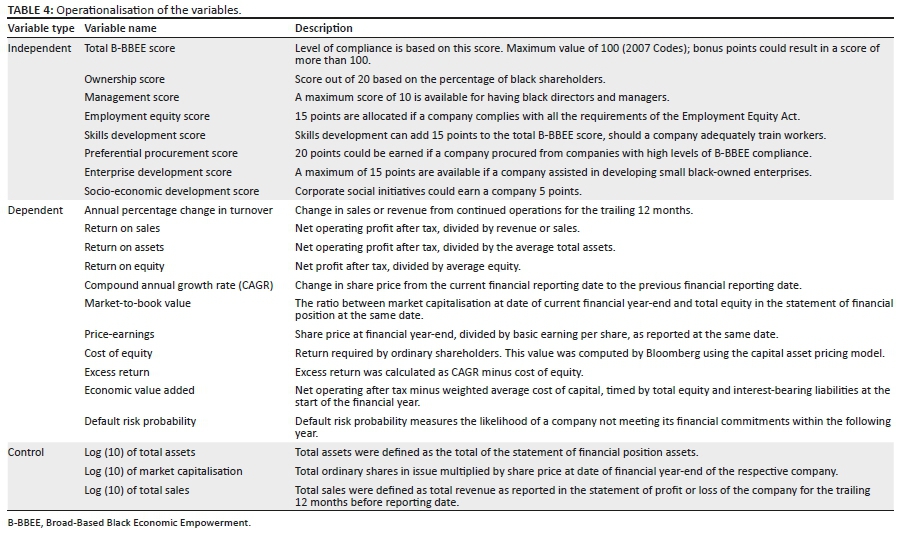
As the B-BBEE scores were not available for all the sampled companies for the entire study period, an unbalanced panel design was used. As indicated earlier, the financial health data were downloaded from the Bloomberg database, whereas the B-BBEE scores were sourced from Empowerdex (measured based on the 2007 Codes). The operationalisation of the variables is explained in Table 4.
Fixed, random and pooled ordinary least square (OLS) panel regression models were employed to investigate the nature of the relationships between the dependent, independent and control variables. The F-test and Hausman test were used to determine the appropriate regression model. The equations for the pooled OLS model (Equation 1), fixed effects panel regression (Equation 2) and random effects panel regression (Equation 3) are presented below:

In Equation 1:
-
yit = dependent variable
-
β0 = intercept
-
β1 = regression coefficient
-
xit = independent variable
-
∈it = error term
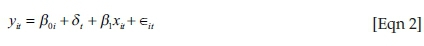
In Equation 2:
-
yit = dependent variable for entity i at time t
-
b0i = (i = 1…n), the intercept for each entity (separate intercepts are indicated for each unit)
-
dt = dummy variable for each time period
-
b1= regression coefficient
-
xit = independent variable for entity i at time t
-
∈it = error term
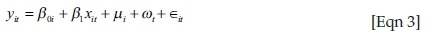
In Equation 3:
-
yit = dependent variable for entity i at time t
-
b0 = intercept
-
b1 = regression coefficient
-
xit = independent variable for entity i at time t
-
µi and ωt = separate error terms for entity i and time t
-
∈it = within-entity error
Where applicable, the results were adjusted for heteroskedasticity. In an attempt to address autocorrelation, a 1-year lag was used in line with the release of the B-BBEE scores. The Empowerdex lists of most empowered companies reflected scores that were measured for companies during the previous year, whereas the financial health data were used for the year in which the list was published (e.g. the 2012 B-BBEE activities of a company were measured in 2013 and the scores released in 2013. The 2013 financial health data were then used, since the potential financial health effect should be dependent on the B-BBEE score). Multicollinearity was addressed by calculating variance inflation factors and were all found to be less than 10.
To ensure the reliability and validity of the financial data, checks were conducted in instances where the parameters changed considerably over time, and parameters that were deemed very high or low. Extreme values were winsorised. The cost of equity analysis was reperformed removing the low and negative values, with the results not differing. Delisted companies were included for the years that they were listed on the bourse. Empowerdex's B-BBEE scores were verified, where available, against the audited B-BBEE certificates. The robustness of the results was improved by including several control variables, and testing and adjusting for specification errors.
Results
An overview of the B-BBEE scores will be provided, followed by a discussion of the financial health measures. The panel regression results will then be presented.
Descriptive overview
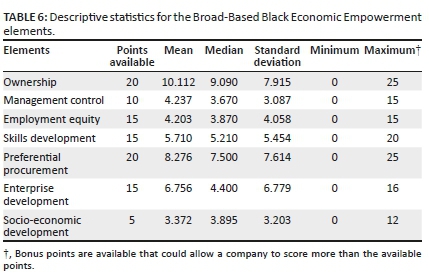
The descriptive statistics for the total B-BBEE score are provided in Table 5 and the B-BBEE elements are provided in Table 6. The total B-BBEE score is divided per year, while the B-BBEE elements are presented in total.
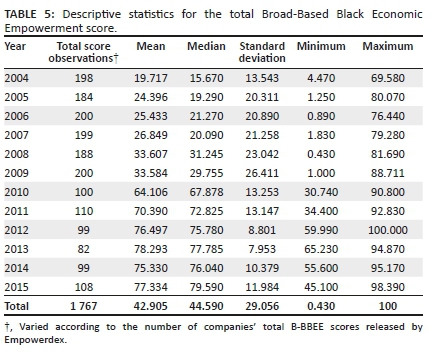
As seen in Table 5, the total B-BBEE scores were widely distributed for the sample companies. During 2012, one company had a very high B-BBEE score. This achievement could be ascribed to the bonus points available in the 2007 Codes. This company managed to comply with some of the additional criteria for bonus points, which enhanced its total B-BBEE score.
Based on the mean scores, companies almost doubled their compliance scores from 2009 to 2010. The 2010 scores were based on approximately the 100 most empowered companies, as opposed to approximately the 200 most empowered companies prior to 2010. A slight reduction in the mean and median total B-BBEE scores was noted during the last part of the study period. The revised Codes were published in 2013. Companies could arguably have spent more time understanding the newly released 2013 Codes, as opposed to focusing their efforts on compliance with the 2007 Codes. As mentioned earlier, the 2013 Codes were stricter and could arguably have required more time from companies to fully understand the new requirements.
Except for enterprise development, the mean and median for all the elements of the B-BBEE scorecard were close to each other. The standard deviations indicate considerable variation in the elements' scores. The maximum values typically correspond with the maximum points available as per the B-BBEE scorecard. In some cases, more points than the maximum were achieved due to bonus points available through certain sector charters, and through the 2007 Codes. The financial health descriptive statistics are shown in Table 7.
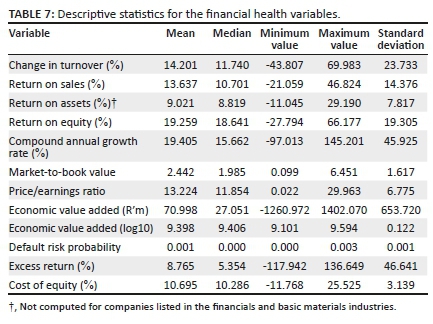
The relatively large standard deviations, in comparison with the mean and median values of the respective measures, were expected due to the diverse industries represented within the sample and the unstable economic climate during the period under review. The 2004-2007 period represented the commodity boom, while from 2008 to 2010 the global financial crisis had a detrimental impact on the financial results of local companies. The effect the economic climate could have had on the sampled companies' performance was moderated, to a certain extent, by controlling for variables such as market capitalisation, total revenue and total assets.
The sampled companies generated approximately 19% return on equity on average over the duration of the study period, which is in excess of the required return (cost of equity). This difference resulted in an average excess return percentage of almost 9%. The market values of shares were, on average, double the book values, which is an indication of a positive market sentiment (Damodaran 2007). This positive sentiment is also reflected in the economic value-added mean value. The likelihood of the sample companies not being able to meet their future financial commitments is small, given the low default risk probability.
Panel regression results
Significant panel regression results were reported for three financial health variables, namely the price/earnings (P/E) ratio, cost of equity and default risk probability. The results adjusted for heteroskedasticity will now be presented. The panel regression results for total B-BBEE score and the B-BBEE elements as the independent variables and the P/E ratio as the dependent variable are shown in Table 8.
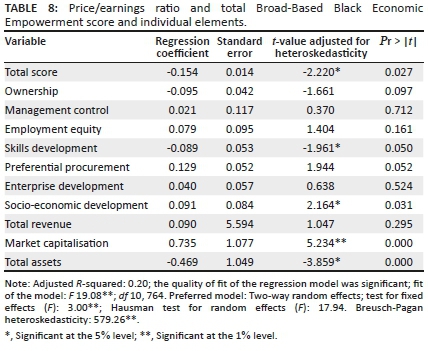
In Table 8, a significant negative relationship is observed between the sampled companies' P/E ratios and total B-BBEE scores. The negative link could indicate that investors were not willing to pay more for the shares of companies with high B-BBEE scores. Van der Merwe and Ferreira (2014) also found a negative relationship between a price-based measure (total share return) and B-BBEE scores which seemingly confirms negative sentiment among market participants No prior studies investigated the relationship between B-BBEE and earnings per share (the numerator in the P/E ratio). A possible explanation could be that earnings per share is susceptible to manipulation and hence not a very reliable accounting-based performance measure (The CFA Institute 2016).
Significant relationships are also reported in Table 8 between the sampled companies' P/E ratios and two of the individual scorecard elements. Whereas a significant negative relationship was observed between P/E ratio and skills development, a positive relationship existed between P/E ratio and socio-economic development. There is no apparent reason for this contradiction, as both of these elements require financial commitments from companies. To further investigate whether the observed negative relationships could be attributed to risk, default risk probability was evaluated (refer to Table 9).
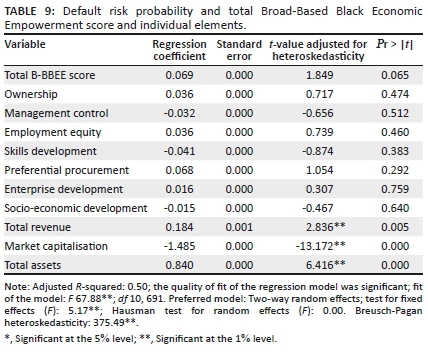
A positive relationship is noted between the total B-BBEE score and default risk probability (Table 9). The result was, however, only significant at the 10% level. This result could partly explain the low P/E ratio (as reported in Table 8), as companies with higher risk of default would be likely to have a lower market valuation (Correia et al. 2013). Another measure that can be impacted by risk is cost of equity. The analyses reported in Table 10 were performed to investigate whether this perceived higher risk is reflected in a higher cost of equity. The cost of equity of a company indicates the return that ordinary shareholders require on their investment. If a company has higher risk, it would most likely result in a higher cost of equity. In this study, the capital asset pricing model (CAPM) was used. Despite several shortcomings, CAPM is often used in the South African context (Nel 2011).
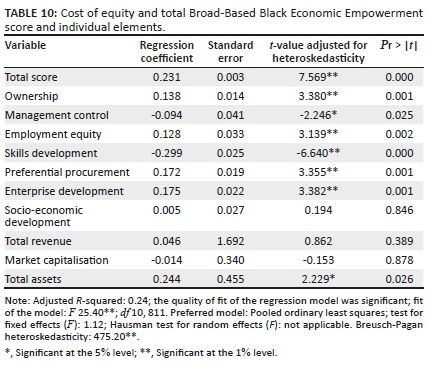
A significant positive relationship is noted between the total B-BBEE score and cost of equity in Table 10. This finding seems to corroborate the significant negative regression coefficient reported for the P/E ratio (Table 8) and the positive regression coefficient for default risk probability (Table 9). An increase in default risk probability (especially in emerging economies) often results in higher cost of equity and a lower P/E ratio. Significant positive relationships are furthermore noted between the cost of equity and ownership, employment equity, preferential procurement and enterprise development (Table 10). The empirical evidence suggests that ordinary shareholders in this sample may have regarded the companies with higher total B-BBEE scores as having more risk, resulting in a higher cost of equity. The findings contradict those of Morris (2018) who found no relationship between B-BBEE scores and risk and Akinsomi (2016) who showed that B-BBEE compliant companies had less risk than their non-compliant counterparts did. Cost of equity was negatively correlated with management control and with skills development.
The significant positive relationship between cost of equity and employment equity came as a surprise, given that a negative relationship existed between management control and cost of equity. Even though these results may seem to contradict each other, they are in line with the findings of Bouslah, Kryzanowski and M'Zali (2012) who investigated the link between employee diversity concerns and company risk. The significant negative relationship between cost of equity and management control appears to be in line with findings of Marimuthu (2008), albeit for different measures. Marimuthu found a positive association between board diversity and return on assets, but it could be seen as a similarity to the decrease in cost of equity as both point towards improved financial health. A significant positive relationship between cost of equity and preferential procurement was also noted, indicating that the sentiment towards preferential procurement could be negative. The significant negative link between cost of equity and skills development could be seen as contradicting the negative relationship noted between the P/E ratio and skills development. This ambiguity may point towards positive and negative perceptions towards skills development. It could also indicate that either the association with P/E ratio or the relationship with cost of equity, or both, might be spurious. Significant relationships with the control variables were also typically reported, strengthening the notion that these control variables could have a moderating effect on the results, had they not been controlled for.
Both alternative hypotheses (Ha1 and Ha2) were accepted. A significant positive relationship between total B-BBEE score and cost of equity was reported, and a significant negative relationship between total B-BBEE score and P/E ratio was observed. These two observations were further supported by a positive (significant at the 10% level) relationship between total B-BBEE score and default risk probability. Significant relationships between the elements of the B-BBEE scorecard and cost of equity, and between the elements of the B-BBEE scorecard and P/E ratio were noted. A significant positive relationship between socio-economic development and P/E ratio was noted. Similarly, positive relationships with cost of equity were observed between ownership, employment equity, enterprise development and preferential procurement. Based on the findings of Van der Merwe and Ferreira (2014), it could be assumed that certain investors do look at the B-BBEE activities and scorecards of companies. Therefore, based on the empirical results, it is deduced that stakeholders yield a positive sentiment towards management control, skills development and socio-economic development. Stakeholders do not, however, seem favourable towards ownership, employment equity, preferential procurement and enterprise development.
Despite the fact that the relationships with total B-BBEE score indicate a negative relationship with financial health, there are elements that were positively related to economic health, as discussed above. As such, directors should strive to have a more diverse management team, invest in socio-economic development and skills development. Directors should be wary of the negative associations between ownership, employment equity, preferential procurement, enterprise development and financial health.
Conclusion
Broad-Based Black Economic Empowerment legislation was implemented in 2003 to redress the adverse economic impact of the apartheid regime on ordinary citizens. The Act was revised in 2013 and three Codes of Good Practice were published since 2004. Since the introduction of B-BBEE legislation, the question is increasingly being raised whether there is a financial motivation for companies to achieve a higher level of compliance.
Previous authors reported inconclusive evidence of the nature of the relationship between B-BBEE and financial performance. The authors of this study investigated the relationships between B-BBEE scores (in total and per element) and a range of financial health measures for 379 JSE-listed companies over the period 2004-2015. The sample consisted of all the listed companies for which Empowerdex provided compliance scores. A larger sample, a longer time frame and more comprehensive measures were used than those considered by previous authors.
An increasing trend was noted in B-BBEE compliance over time.
The panel regression analyses revealed no significant relationship between the total B-BBEE scores, or any of the respective B-BBEE elements, and the considered accounting-based measures. In contrast, a significant negative relationship was observed between the market-based P/E ratio and total B-BBEE score, while a significant positive relationship was noted for the cost of equity. This negative association might indicate a negative perception of shareholders regarding B-BBEE. Companies with high B-BBEE scores may be perceived to have more risk, as is shown by the positive link with default risk probability.
Compliance with B-BBEE can be seen as one of the ways in which companies can be good corporate citizens who promote social justice. It is, however, not the only way in which companies can contribute to sustainable development. Corporate leaders and policymakers are encouraged to reflect on how they can truly contribute to a more empowered South African society. Directors who are responsible for developing and implementing empowerment strategies play an integral role in the sustainable future of B-BBEE.
Directors could focus on the elements of the B-BBEE scorecard that seem to be viewed in a positive light by shareholders. Based on the findings of this study, a more diverse management team should be pursued, and a greater emphasis should be placed on socio-economic development and skills development. Corporate decision-makers should caution against overemphasising the importance of ownership, given that shareholders seem to view this element in a negative light, based on the link with cost of equity.
The provision of capital by shareholders is essential to ensure a sustainable future for companies. Meaningful engagements between shareholders and managers could lead to enhanced B-BBEE practices. The importance of B-BBEE compliance should not only be stressed in private, as is currently the case (see Viviers, Mans-Kemp & Fawcett 2017), but should also be raised at companies' annual general meetings. It is foreseen that an engagement regarding race diversity will eventually lead to discussions on enhanced gender and age diversity as well, following international trends.
Future researchers can take a closer look at some of the contradictory relationships observed in this study and could use one or more multi-factor asset pricing models to compute cost of equity in a follow-up study. Broad-Based Black Economic Empowerment can also be studied from a qualitative perspective by conducting interviews with foreign and South African investors and companies to gauge their views on the effectiveness of empowerment initiatives. For the purpose of this study, the sample was limited to Empowerdex's list of most empowered companies. In future, a B-BBEE compliance index can also be compiled for small, medium and large companies based on their reporting on the matter.
Broad-Based Black Economic Empowerment appears to have positive and negative dimensions. If the positive dimensions are embraced and the negative ones addressed, the reformatory Act can truly help South Africa to become more equal.
Acknowledgements
Prof. Martin Kidd for the statistical analysis; Ms Elizma Beets for the language editing.
Competing interests
The authors have declared that no competing interest exists.
Authors' contributions
All authors contributed equally to this work.
Ethical consideration
This article followed all ethical standards for research.
Funding information
This research received no specific grant from any funding agency in the public, commercial or not-for-profit sectors.
Data availability statement
Data sharing is not applicable to this article as no new data were created or analysed in this study.
Disclaimer
The views and opinions expressed in this article are those of the authors and do not necessarily reflect the official policy or position of any affiliated agency of the authors.
References
Acemoglu, D., Gelb, S. & Robinson, J.A., 2007, 'Black Economic Empowerment and economic performance in South Africa', Treasury, viewed 26 February 2016, from http://www.treasury.gov.za/publications/other/growth/06-Procurement%20and%20bee/02-black%20economic%20empowerment%20and%20economic%20performance%20in%20so.pdf [ Links ]
Ahern, K.R. & Dittmar, A.K., 2012, 'The changing of the boards: The impact on firm valuation of mandated female board representation', The Quarterly Journal of Economics 127(1), 137-197. https://doi.org/10.1093/qje/qjr049 [ Links ]
Akinsomi, O.K., 2016, 'The performance of the Broad Based Black Economic Empowerment compliant listed property firms in South Africa', Journal of Property Investment and Finance 34(1), 3-26. https://doi.org/10.1108/JPIF-09-2014-0061 [ Links ]
Andrews, M., 2008, 'Is Black Economic Empowerment a South African growth catalyst? (Or could it be…)', SSRN, viewed 07 August 2016, from http://ssrn.com/abstract=1266797 [ Links ]
BEE Commission, 2001, BEE Commission report of 2001, viewed 04 October 2016, from https://www.westerncape.gov.za/text/2004/5/beecomreport.pdf [ Links ]
BEE Commission, 2017, National state of transformation and trend analysis national report, viewed 08 December 2019, from https://bbbeecommission.co.za/wp-content/uploads/2017/05/B-BBEE-Commission-National-State-of-Transformation-and-Trend-Analysis-National-Report-Booklet.pdf [ Links ]
Bloomberg, L.P., 2018, Research domain, Software and database, New York, NY. [ Links ]
Bouslah, K., Kryzanowski, L. & M'Zali, B., 2012, 'The impact of the dimensions of social performance on firm risk', Journal of Banking & Finance 37(2013), 1258-1273. https://doi.org/10.1016/j.jbankfin.2012.12.004 [ Links ]
Carter, D., D'Souza, F., Simkins, B. & Simpson, G., 2010, 'The gender and ethnic diversity of US boards and board committees and firm financial performance', Corporate Governance: An International Review 18(5), 396-414. https://doi.org/10.1111/j.1467-8683.2010.00809.x [ Links ]
Chidede, T. & Warikwanda, T.V., 2017, 'Foreign direct investment and Zimbabwe's indigenisation and economic empowerment act: Friends or foes?', Midlands State University Law Review 3(1), 2-22. https://doi.org/10.1111/1468-0106.12202 [ Links ]
Chipeta, C. & Vokwana, T.C.Z., 2011, 'The impact of Black Economic Empowerment transactions on shareholder wealth and firm profitability: Evidence from the JSE', African Finance Journal 13, 71-91. [ Links ]
Correia, C., Flynn, D., Uliana, E. & Wormald, E., 2013, Financial management, Juta, Cape Town. [ Links ]
Damodaran, A., 2007, 'Return on capital (ROC), return on invested capital (ROIC) and return on equity (ROE): Measurement and implications', SSRN, viewed 17 February 2018, from http://ssrn.com/abstract=1105499 [ Links ]
Department of Trade and Industry (DTI), 2004, Codes of good practice, viewed 03 July 2016, from https://www.thedti.gov.za/economic_empowerment/docs/bee_archive_docs/CodeofGoodPractice.pdf [ Links ]
Department of Trade and Industry (DTI), 2007, Codes of Good Practice, viewed 04 April 2016, from https://www.gov.za/sites/default/files/gcis_document/201409/29617s0.pdf [ Links ]
Department of Trade and Industry (DTI), 2013, Codes of good practice, viewed 04 April 2016, from https://www.thedti.gov.za/business_regulation/acts/BEE-Amendment_ACT2013.pdf [ Links ]
De Villiers, C. & Ferreira, P., 2011, 'The association between South African listed companies' BEE scores and market performance: An introductory study', Meditari Accountancy Research 19(1/2), 22-38. https://doi.org/10.1108/10222521111178619 [ Links ]
De Wet, A., 2016, 'To BEE, or Not to BEE? A vital question', Accountancy SA 1(4), 20. [ Links ]
Dowling, J. & Pfeffer, J., 1975, 'Organisational legitimacy: Social values and organizational behaviour', Pacific Sociological Review 18(1), 122-136. https://doi.org/10.2307/1388226 [ Links ]
Empowerdex, 2016, Implication of B-BBEE codes of good practice, viewed 06 September 2016, from http://www.empowerdex.com/~empowerdex/bee-legislation/b-bbee-codes-of-good-practice [ Links ]
Erhardt, N., Werbel, J. & Shrader, C., 2003, 'Board of director diversity and firm financial performance', Corporate Governance: An International Review 11(2), 102-111. https://doi.org/10.1111/1467-8683.00011 [ Links ]
Hoffman, E., 2008, 'A wolf in sheep's clothing', Syracuse Journal of International Law and Commerce 36(87), 87-115. [ Links ]
Jeffrey, A., 2014, BEE: Helping or hurting? Tafelberg, Cape Town. [ Links ]
Kleynhans, E.P.J. & Kruger, M.C., 2014, 'Effect of Black Economic Empowerment on profit and competitiveness of firms in South Africa', Acta Commercii 14(1), 1-10. https://doi.org/10.4102/ac.v14i1.200 [ Links ]
Krüger, L.P., 2011, 'The impact of Black Economic Empowerment (BEE) on South African businesses: Focusing on ten dimensions of business performance', Southern African Business Review 15(3), 207-233. [ Links ]
Magure, B., 2012, 'Foreign investment, Black Economic Empowerment and militarised patronage politics in Zimbabwe', Journal of Contempory African Studies 30(1), 67-82. https://doi.org/10.1080/02589001.2011.638154 [ Links ]
Mans-Kemp, N. & Viviers, S., 2014, 'Investigating board diversity in South Africa', Journal of Economic and Financial Sciences 8(2), 392-414. https://doi.org/10.4102/jef.v8i2.100 [ Links ]
Marazanye, K., 2016, 'An analysis of indigenisation and economic empowerment in Zimbabwe', Master's thesis, Gordon Institute of Business Science, University of Pretoria, South Africa. [ Links ]
Marimuthu, M., 2008, 'Ethnic and gender diversity in boards of directors and their relevance to financial performance of Malaysian companies', Journal of Sustainable Development 2(3), 139-148. https://doi.org/10.5539/jsd.v2n3p139 [ Links ]
Marimuthu, M. & Kolandaisamy, I., 2009, 'Can demographic diversity in top management team contribute for greater financial performance? An empirical discussion', The Journal of International Social Research 2(8), 273-286. [ Links ]
Masito, M., 2007, 'Afrikaner Economic Empowerment (1890-1990) and lessons for Black Economic Empowerment', Master's thesis, Gordon Institute of Business Science, University of Pretoria, South Africa. [ Links ]
Mathura, A., 2009, 'The impact of Broad Based Black Economic Empowerment on the financial performance of companies listed on the JSE', Master's thesis, Gordon Institute of Business Science, University of Pretoria, South Africa. [ Links ]
Mehta, U. & Ward, M., 2017, 'The relationship between a Black Economic Empowerment score and shareholder returns in Johannesburg Stock Exchange-listed companies', South African Business Review 21(1), 85-97. [ Links ]
Morris, C., 2018, 'The impact of Black Economic Empowerment on business risk - Evidence from the South African industrial sector', African Journal of Business and Economic Research 13(2), 99-120. https://doi.org/10.31920/1750-4562/2018/v13n2a5 [ Links ]
Nel, W.S., 2011, 'The application of the Capital Asset Pricing Model (CAPM): A South African perspective', African Journal of Business Management 5(13), 5336-5347. [ Links ]
Ngwenya, N.X., 2019, 'Time for a new wave of B-BBEE', Fin24, 25 February, viewed 30 May 2019, from https://www.fin24.com/Opinion/time-for-a-new-wave-of-bee-20190225 [ Links ]
Patel, L. & Graham, L., 2012, 'How broad-based is Broad-Based Black Economic Empowerment', Development Southern Africa 29(2), 193-207. https://doi.org/10.1080/0376835X.2012.675692 [ Links ]
Pike, A., Puchert, J. & Chinyamurindi, W.T., 2018, 'Analysing the future of Broad-Based Black Economic Empowerment through the lens of small and medium enterprises', Acta Commercii 18(1), 1-10. https://doi.org/10.4102/ac.v18i1.566 [ Links ]
Ponte, S., Roberts, S. & Van Sittert, L., 2007, 'Black Economic Empowerment, business and the state in South Africa', Development and Change 38(5), 933-955. https://doi.org/10.1111/j.1467-7660.2007.00440.x [ Links ]
Rawls, J., 1999, A theory of justice, Revised edn., Oxford University Press, Oxford. [ Links ]
Republic of South Africa, 2003, Broad-Based Black Economic Empowerment Act (No. 53 of 2003), viewed 15 February 2016, from https://www.thedti.gov.za/economic_empowerment/BEEAct-2003-2004.pdf [ Links ]
Richard, O., 2000, 'Racial diversity, business strategy, and firm performance: A resource-based view', The Academy of Management Journal 43(2), 164-177. https://doi.org/10.2307/1556374 [ Links ]
Richard, O., Barnett, T., Dwyer, S. & Chadwick, K., 2004, 'Cultural diversity in management, firm performance, and the moderating role of entrepreneurial orientation dimensions', The Academy of Management Journal 47(2), 255-266. [ Links ]
Sartorius, K. & Botha, G., 2008, 'Black Economic Empowerment ownership initiatives: A Johannesburg Stock Exchange perspective', Development Southern Africa 25(4), 437-453. https://doi.org/10.1080/03768350802318530 [ Links ]
Seierstad, C., 2016, 'Beyond the business case: The need for both utility and justice rationales for increasing the share of women on boards', Corporate Governance: An International Review 24(4), 390-405. https://doi.org/10.1111/corg.12117 [ Links ]
Shukeri, S., Shin, O. & Shaari, M, 2012, 'Does board of director's characteristics affect firm performance? Evidence from Malaysian public listed companies', International Business Research 5(9), 120-127. https://doi.org/10.5539/ibr.v5n9p120 [ Links ]
Strydom, B., Christison, A. & Matias, J., 2009, 'An empirical investigation of the effect of Black Economic Empowerment transactions on share prices: 1996 to 2006', African Journal of Accounting, Economics, Finance and Banking Research 5(5), 67-76. [ Links ]
Tangri, R. & Southall, R., 2008, 'The politics of Black Economic Empowerment in South Africa', Journal of Southern African Studies 34(3), 699-716. https://doi.org/10.1080/03057070802295856 [ Links ]
The CFA Institute, 2016, CFA Program Curriculum 2017 Level 1 Volumes 1-6, CFA Institute, Charlottesville, VA. [ Links ]
Van der Merwe, C.M. & Ferreira, P., 2014, 'The association of the seven elements of the Black Economic Empowerment score and market performance', South African Journal of Economic and Management Sciences 17(5), 544-556. https://doi.org/10.4102/sajems.v17i5.627 [ Links ]
Verweire, K. & Van den Berghe, L., 2004, Integrated performance management: A guide to strategy implementation, Sage, London. [ Links ]
Viviers, S., Mans-Kemp, N. & Fawcett, R., 2017, 'Mechanisms to promote board gender diversity in South Africa', Acta Commercii 17(1), 1-10. https://doi.org/10.4102/ac.v17i1.489 [ Links ]
Ward, M. & Muller, C., 2010, 'The long-term share price reaction to Black Economic Empowerment announcements on the JSE', Investment Analysts Journal 39(71), 27-36. https://doi.org/10.1080/10293523.2010.11082517 [ Links ]
Wiesema, M. & Mors, M., 2016, 'What board directors really think of gender quotas', Harvard Business Review, viewed 13 February 2017, from https://hbr.org/2016/11/what-board-directors-really-think-of-gender-quotas [ Links ]
Wolmarans, H. & Sartorius, K., 2009, 'Corporate social responsibility: The financial impact of Black Economic Empowerment transactions in South Africa', South African Journal of Economic and Management Sciences 12(2), 180-193. https://doi.org/10.4102/sajems.v12i2.275 [ Links ]
World Federation of Exchanges, 2016, Monthly reports tool, viewed 06 September 2016, from http://www.world-exchanges.org/home/index.php/statistics/monthly-reports [ Links ]
 Correspondence:
Suzette Viviers
sviviers@sun.ac.za
Received: 08 Apr. 2020
Accepted: 29 Sept. 2020
Published: 21 Jan. 2021

