


Services on Demand
Article
 English (pdf)
 Article in xml format
 Article references
Indicators

Related links
-
 Cited by Google
 -
 Similars in Google
Share

 Permalink
South African Journal of Economic and Management Sciences
On-line version ISSN 2222-3436
Print version ISSN 1015-8812
S. Afr. j. econ. manag. sci. vol.23 n.1 Pretoria 2020
http://dx.doi.org/10.4102/sajems.v23i1.3413
ORIGINAL RESEARCH
Investment in electricity distribution capital infrastructure in South Africa: The role of regulation
Bongani Khonjelwayo; Thilivhali Nthakheni
National Energy Regulator of South Africa, Pretoria, South Africa
ABSTRACT
BACKGROUND: The electricity distribution industry in South Africa is faced with numerous challenges that include distribution capacity shortages and backlog in investments
AIM: This study was carried out to investigate the role of regulation in enabling investment in distribution capital expenditure
SETTING: The study focusses on the licensed electricity distributors and the energy regulation institution in South Africa
METHODS: Primary data for the study was collected through interviews with 16 Energy Regulator officials responsible for analysing and approving electricity distributor tariff applications. Secondary data was collected and analysed through a sample of 112 electricity distributors in South Africa
RESULTS: It is established that the National Energy Regulator of South Africa has put a number of processes and methods in place to ensure that electricity distributors (EDs) are efficient in their operations and that the tariffs they charge customers are not excessive and are aligned to specific benchmarks as approved by the regulator. However, a majority of EDs are not performing according to the benchmarks. For instance, they are operating at a negative surplus, which does not allow them to make sufficient investment in infrastructure refurbishment and acquire new infrastructure. The study also discovered that EDs are spending the minimum 6% required by regulation on repairs and maintenance
CONCLUSION: The conclusion of the study is that in the absence of a regulatory methodology that allows EDs to earn a required return on assets, benchmarks play a big role in ensuring that they are performing at the level required and that through the surpluses they generate, they can invest in the acquisition of new infrastructure for capital gain. However, regulation alone is not sufficient to ensure that capital investment is adequate; government intervention through infrastructure grants is also necessary and a private sector capital injection
Keywords: Capital expenditure; electricity distributors; infrastructure backlogs; regulation; benchmarks; repairs and maintenance and infrastructure capital.
Introduction
The purpose of this study is to assist the South African electricity supply industry to be sustainable through investment in infrastructure by determining the role of regulation. This section of the study covers the background, aim of the study and research questions.
Background
At the municipal sphere of government, revenue from electricity constitutes a major proportion of municipality's income, followed by property rates. Municipalities that sell electricity generated at least 40% of their revenues from the sale of electricity in 2017 (Statistics South Africa [Stats SA] 2017). The electricity pricing policy (No. 31741) of 2008 states that the electricity distribution industry (EDI) in South Africa is faced with several challenges that include capacity shortages and backlog in investments. According to Eskom (2019), municipalities accounted for 42% of electricity sales in South Africa in 2018, while Eskom was responsible for the difference. Eskom also states that networks are inadequately maintained which results in refurbishment and maintenance backlogs. This has led to a rise in electricity supply disruptions. A 2010 study (reviewed in 2016) conducted by the Department of Energy (DOE) showed that the investment backlog in electricity distribution infrastructure investment stands at R68 billion. De Beer (2016) investigated the role of regulation in supporting and ensuring that electricity distributors (EDs) generate sufficient revenue to earn a required return to be able to invest in infrastructure and capital expansion to meet the demand from customers. This study revealed several reasons for the failure of electricity distribution systems in South Africa, which included the following:
-
Lack of planned or preventative maintenance.
-
Lack of asset databases, suitable spares and contingency arrangements.
-
A bottom-up planning approach that does not inform maintenance budget.
-
When there are budget deficits, the readjusting maintenance expenditure downwards becomes the easiest option to close the gap.
Aim of the study
The aim of this study is to investigate the role of regulation in enabling investment in distribution capital expenditure by EDs to enable sustainable electricity supply in South Africa.
The objectives of the study
The primary objective of the study is to determine the role of regulation in supporting infrastructure investment and monitoring the performance. To achieve these, the following specific objective were developed:
-
To determine the role of regulation in facilitating investment in capital infrastructure acquisition.
-
To determine regulatory mechanisms that are at the disposal of the energy regulator to ensure that there is sufficient investment in the electricity infrastructure by distributors.
-
To determine the correlation between the financial performance measures used by the energy regulator and the ability of municipalities to invest in capital expenditure (capex).
-
To determine electricity tariffs and revenues that are sufficient for electricity distributors to contribute towards capital expenditure.
To achieve these objectives the following questions were developed:
-
What is the role of regulation in facilitating investment in capital infrastructure acquisition?
-
What regulatory mechanisms are at the disposal of the energy regulator to ensure that there is sufficient investment in electricity infrastructure by distributors?
-
What is the correlation between the financial performance measures used by the energy regulator and the ability of municipalities to invest in capex?
-
Are electricity tariffs and revenues sufficient for electricity distributors to contribute towards capital expenditure?
Literature review
This section discusses various literature concepts, theories and practices that are relevant to the topic under review. Literature relating to electricity distribution and investment, challenges to infrastructure regulation and investment were discussed.
Electricity distribution and capital investment
The national government discloses several challenges faced by the distribution sector in South Africa. These include backlogs in infrastructure investment in maintenance and expansion, fragmentation in terms of investments, inadequate budgeting and management practices and lack of skills and human capital (Palmer et al. 2016). Infrastructure investment is the expenditure to purchase, replace or construct fixed assets or facilities that will provide a service for more than a year. These are fixtures such as buildings, land, streetlights and transmission lines (Mahabir & Mabena 2015). According to the South African Local Government Association (2018), the country's distribution infrastructure is very old, with some of the assets older than 40 years. The Financial and Fiscal Commission (2013) estimates that investment in electricity infrastructure is insufficient and only 60% of what is required for adequate investment has been invested. This is equivalent to R10 billion in underinvestment per annum since 2011. Palmer et al. (2016) put the electricity infrastructure investment backlog at 43% by 2016. This lack of investment has led to increased localised blackouts that impact on economy and livelihoods of many citizens. Some of the reasons put forward for insufficient investment were lack of skills and institutional capacity within municipalities to spend the allocated funding on infrastructure projects. The Financial and Fiscal Commission stated that local government was responsible for infrastructure worth R1.2 trillion in 2012, of which electricity infrastructure accounted for R398 billion. The report also estimated the backlog to be between RZAR 8 billion and R41 billion per annum. A report by the Development Bank of Southern Africa (2012) estimated that between 2013 and 2023, municipalities would require an investment of R176 billion in electricity infrastructure, 15% of which will be channelled towards addressing backlogs, 42% towards catering for the expected growth, and 43% to rehabilitating existing infrastructure (Palmer et al. 2016), as shown in Table 1. Eberhard (2012) estimated the investment backlog in infrastructure to be growing at R2.5 billion per annum.

The Department of Energy (DOE 2015) of South Africa acknowledged that the demand for electricity has been increasing and capital investment was required to meet the demand from agriculture, commerce and industrial customers. A balance is needed between the construction of a new infrastructure and refurbishment of the existing infrastructure. According to De Beer (2016), distribution companies should be investing at a rate of 10% of asset value per year; however, current investment is at 1% - 2%. Even though electricity infrastructure budgets have increased, they are not increasing at a pace required to reduce backlogs. Most municipalities' capital budgeting capacity is weak as municipalities' budget is over the short term instead of long-term planning. The quality of planning is poor, resulting in under expenditure on capex budgets (National Treasury 2015).
Challenges to infrastructure investment in electricity distribution
At global level, fewer countries can afford to fund fully public acquisition of energy infrastructure. Investing in distribution infrastructure poses several challenges and risks. This is because governments must choose which projects to finance, subject to limited resources. Often, they choose to exit the energy sector and surrender it to the private sector and instead focus on projects that are less attractive to private investors (Statham 2008). Additionally, emerging countries have challenges to attract investment because of perceived risks associated with investing in these countries. Stratham (2008) stated that the electricity industry is moderately capital intensive with payback periods of 10-20 years. The points of production and consumption are far apart, creating a geographical imbalance. Access to deep rural areas exacerbates the situation and increase the cost of distribution. Mahabir and Mabena (2015) identified funding constraints to municipal investment and discovered that local economic circumstances and internal municipal planning ability are the primary drivers of the ability of municipalities to make their own contributions towards capital infrastructure investment. Municipalities with high unemployment, for example, have a lower contribution of own revenue towards capital infrastructure investment. Municipalities that have better management abilities, as measured by the financial audit performance, are more likely to contribute revenue towards capital infrastructure investment. This is because they can prepare budgets, determine their capital costs and be able to design tariffs to fund capital needs. The Financial and Fiscal Commission (2013) stated that municipalities scored less than 50% in asset management in 2012. Asset management refers to all the facets of acquisition, maintenance, refurbishment, disposal and replacement of an asset.
The main finding of the report was that municipalities were not aware 'of the assets at their disposal, the value and specifications of those assets, their location, composition, physical attributes, and maintenance needs of the assets' (Financial and Fiscal Commission 2013:5). The Centre for Scientific and Industrial Research (2007) contended that one of the reasons for backlogs in electricity infrastructure refurbishment by municipalities was database deficits for municipal assets. The government has embarked on several initiatives to assist municipalities in addressing the infrastructure-related challenges facing them. These include the establishment of a President's Infrastructure Coordinating Committee (PICC), the establishment of Municipal Infrastructure Support Agency (MISA), as well as the Approach to Distribution Asset Management (ADAM) programme. The ADAM is a multiyear initiative intended to assist municipalities with maintenance and refurbishment of key electricity infrastructure. The national government is also assisting with the provision of conditional grants, such as the Infrastructure Skills Development Grant (National Treasury 2017). There are three main sources of funding for capital expenditure in South Africa: municipal taxes and tariffs, intergovernmental fiscal transfers and municipal borrowing. Tariffs are considered the best option to fund operating and capital expenditure, including maintenance, metering and connection costs, and a return on investment and profit (Mahabir & Mabena 2015). The funding for electricity infrastructure has largely been done through municipal infrastructure grants (MIG), which are conditional grants from the national government, as well as international organisations such as the European Union, the World Bank, and United States Agency for International Development (USAID), and the German Development Corporation. Municipalities still largely depend on government transfers to finance capital expenditure. Over the 2015 Medium Term Expenditure Framework, R313.7 billion was transferred directly to municipalities, while R31.9 billion was transferred as indirect grants. Only 22% of capital budgets for municipalities came from their own revenue (National Treasury 2015). Eberhard (2012) suggested that one of the ways to address the infrastructure backlog include the need to focus on the municipalities that make the biggest contribution towards the electricity distribution by applying the 80:20 principle. This means focusing on the 20% of municipalities that contribute 80% of the electricity distribution. The study also contended that revenues, accounts and assets from electricity be ring-fenced from other municipal businesses. The role of the regulator should be to establish national norms and standards for minimum electricity infrastructure. The National Energy Regulator of South Africa (NERSA) can also recover revenues from municipalities that are not spending on infrastructure upgrades. According to De Beer (2016), one of the challenges facing the South African EDI is the lack of skills to carry out repairs, maintenance and infrastructure refurbishment projects. This is exacerbated by the prohibitive costs of upgrading and expanding training facilities, severe shortage of qualified technical instructors and shortage of workplace assessors and mentors. (De Beer 2016). Voss et al. (2018) asserted that the constitution makes provision for municipal electricity reticulation and administration. The White Paper on energy (2008) requires that electricity reticulation must be linked to municipalities' infrastructure investment plan by incorporating it into the electricity master plan, in the municipality's Integrated Development Plan (IDP), and municipal budgeting process. The infrastructure master plan forms the basis for the development of bulk municipal electricity infrastructure. The plan is part of the IDP and capital funds are allocated annually in accordance with the approved IDP (Zietsman 2014). Intergovernmental transfers are suitable for the provision of capital assets that spill over into more than one municipal jurisdiction and where costs cannot be assigned to individual users. There are two types of intergovernmental transfers: general purpose (unconditional) and specific purpose (conditional). Capital expenditure is normally funded through conditional grant (Mahabir & Mabena 2015). According to the South African National Treasury (2017), municipalities are allocated a share from revenue raised by national government through the Division of National Revenue Act (which is approved every year for the implementation of the annual budget). The purpose of the equitable share for local government is to assist municipalities fill the fiscus gap to provide basic services and perform functions allocated through Section 227(1) of the constitution (National Treasury 2016).
Electricity distribution regulation and investment
According to Stratham (2008), regulation plays a pivotal role in attracting investment to the energy sector. The primary role of regulation is to oversee and define the context around the organisation of the energy sector. Regulation also protects and balances the interest of both the investor and the consumer over the short term and long term (Stratham 2008). The regulatory mechanism and institution should strive to bring stability and efficiency over the long term. This system should also be transparent, predictable and independent, and ensure that regulation occurs at generation, distribution and transmission levels. Some of the mechanisms to ensure this are licensing and putting in place predictable and cost reflective tariffs (Doulet 2016). This view was supported by Felsmann (2013)'s assertion that a clear and transparent regulatory framework was necessary to support the implementation of tariffs that promote new investment in the electricity distribution sector. According to Khan (2018), there are two types of regulatory methodologies: performance based or incentive regulation, which is based on rewards and penalties to induce good performance, and hybrid approach, which uses a cost-plus approach but specifies certain normative parameters such as benchmarks.
Khan (2018) defined performance-based regulation as regulation that encourages licenses to be efficient by regulating, for instance, quality of service, plant load factors, transmission and distribution losses, operation and maintenance expenses and outages. There are three types of performance regulation: rate of return, price cap and revenue cap regulation. Rate of return sets the price level based on a fair return of the cost of capital. Price cap regulation uses a formula to determine the maximum allowable price increase for a product or basket of products over a fixed period. Revenue cap allows a firm to change prices if the revenue did not exceed cap. Doulet (2016) also added another method to regulate tariffs: cost indexation, which links the price of tariffs to specific input costs such as commodities. This method is usually utilised with some other method, creating a hybrid method. According to Egert (2009), the regulatory regime that is adopted has an impact on investment decision of firms. It may lead to either underinvestment or overinvestment. This view is supported by Cullmann and Nieswand (2015) who postulated that empirical studies show that rate of return regulation can lead to overinvestment or underinvestment in certain instances. Firms may choose to underinvest if the timing of regulation is too short to allow the recovery of investment costs. Firms may also choose not to invest, to delay investment or invest sequentially under conditions of regulatory uncertainty. The use of ex-post rather than ex-ante information in the decisions on the inclusion of assets in the regulator base may also impact on the decision to invest. Nezlobin, Raja and Reichelstein (2012) agreed that rate of return does not allow for the implementation of prices and quantities that are close to the marginal cost pricing, due to the fact that prices are often higher that the welfare maximising price. This is attributable to the fact that fixed historical costs are not aligned to long-run marginal costs. Alexander and Irwin (1996) stated that price cap regulation was assumed to encourage utilities to be more efficient because businesses are incentivised to lower their costs because they can keep their cost savings; however, they are exposed to more risks should the cost rise dramatically. Felsmann (2013) stated that empirical evidence has also shown incentive price regulation was effective in eliminating short-run cost inefficiencies. It may lead to depressed investment if the regulatory cycle is not long enough to break even or if the regulator sets unrealistic targets or revised the targets before the end of the cycle. Firms would shift this risk to consumers through higher required rate of return and higher cost of capital. However, if regulation allows opportunities to generate higher profit by investing in cost-reducing technologies, utilities will invest to upgrade existing infrastructure. The non-confidential information on processes and operation of each municipality should become available to consumers and should be monitored by the energy regulator. Consumers should have access to information pertaining to the electricity tariff detail, the cost structure of the electricity distribution network, outage performance, backlogs and investment plans (Kaziboni, Rustomnjee & Steuart 2018). Eberhard (2006) concurred in that one of the goals of economic regulation is investment and extension of service. It also ensures that infrastructure investment is enabled and ensures that goods and services are provided in a cost-efficient, fair and sustainable manner. Tariff setting should improve operational management and private sector investment through transparent decision-making.
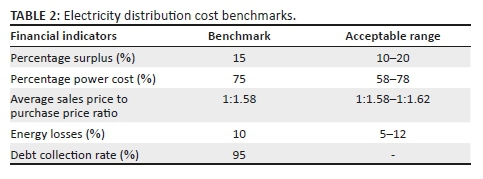
Regulation of the electricity sector in South Africa is the responsilility of NERSA in respect of the licensing of electricity providers and the regulation of electricity tariffs (Palmer et al. 2016). The South African distribution tariff code that was developed by Eskom (2014a) and approved by NERSA stated that the design of distribution tariffs and connection charges should take into account the need to recover the regulated revenue requirement in the most cost-effective way so that a business is financially viable and customers are provided an acceptable level of service. The code also stated that distribution tariffs should be designed in a way that allows for the recovery of annual interest and depreciation on invested capital employed to provide the existing network, as well as a return on assets. Between 2009 and 2012 municipalities increased their surplus on electricity by R7.3 billion, an increase of 68% in real terms. Municipal tariffs are regulated by NERSA through the annual guideline and benchmarks that are published and used to determine increases applicable to electricity distributors. The guideline increase is determined from Eskom's approved bulk increase to municipalities and an increase to municipalities' cost structures. The average cost structures and benchmarks are determined from a stratified random sample of municipal information from distribution forms (D-forms) submitted by municipalities every year to NERSA (NERSA 2018), who determines the average cost structure for EDs. The average cost structure shows that municipalities expended 74% of their revenue on bulk purchases, 10% on salaries and wages, 6% on repairs and maintenance (R&M), 5% on capital charges and 5% on other costs. Capital charges are expended on debt repayments for municipal repairs and capital infrastructure investments. NERSA also determined the financial benchmarks that municipalities must comply with and expects EDs to ensure that their costs are aligned to this benchmark. Tariff applications are assessed against this benchmark (NERSA 2018). Table 2 shows the financial benchmarks that NERSA uses to assess the performance of EDs. Electricity distributors are expected to utilise 75% of their revenue for bulk purchases, with an acceptable range of 58% - 78%. They are also expected to generate a surplus of between 10% and 20%, keep losses between 5% and 12% and maintain an average sales price to purchase price ratio of 1:1.58 - 1:1.62. The debt collection rate should be maintained at 95%.
NERSA also produces tariff benchmarks that are based on the average consumption on five tariff categories: residential, commercial, agricultural, industrial and time of use tariffs. Electricity distributors that submit applications that are outside the benchmark must provide a motivation and support why these should be kept higher. Table 3 shows an example of a tariff benchmark for a domestic inclining block tariff (IBT). Distributors are expected to sell domestic IBT at between 83.82c/kWh and 194.85c/kWh.

Kelly (2016) disapproved of benchmarks because NERSA does not provide benchmarks for charges such as service charges, network access charges, seasonal or time of use charges. Kelly further argued that municipalities also contend that the use of standard tariffs does not consider the cost base of local authorities and customer base mix, which might require cross-subsidisation to occur. Where communities have a higher proportion of residential customers, the cost of supplying them might be higher because it requires a higher number of connections. Nair, Montgomery-Clair and Rynan (2014) concurred that larger urban municipalities are in a better position to finance refurbishment of infrastructure through borrowing as they have access to capital. Rural municipalities must depend on grants as they have a high proportion of poor customers. The South African Distribution Code by Eskom (2014) requires tariffs to be designed in a way that recovers the revenue requirement and that the cost should be allocated into purchase costs, transmission costs and distribution costs. The distribution costs include recovery of annual interest and depreciation on invested capital employed to provide the existing network, allowed operation and maintenance costs, regulated return on assets, other allowed costs, and technical and non-technical losses. Muratovic (2017) stated that to recover all these costs, utilities design several tariffs that may be grouped into four categories:
-
Connection charges for customer specific requirements that are not shared by customers.
-
Demand and capacity charges to cover a portion of the revenue requirement though a price that measures a customer's maximum demand for electricity.
-
Energy charges based on consumption and covers marginal cost of production.
-
Fixed charges to cover customers' monthly specific costs such as billing, metering and service provision.
With these tariff components, licensees can recover their operating and capital costs from different customers, depending on network usage. They can also aggregate these costs among their customers. Capacity charges and fixed basic charges are ideal for recovering capital costs of electricity distribution. NERSA identifies four tariff components: fixed charges, energy charges, time of use tariffs and capacity charges. The electricity pricing policy requires EDs to conduct a cost of supply (CoS) study every five years or when the licensee has cost structure changes, for example to customer base. The CoS framework is based on a cost-plus methodology that allows an efficient licensee to recover its total cost to supply electricity, plus a reasonable return. It also allows licensees to earn a return on investment and depreciation on assets. Licensees must, therefore, keep up-to-date asset registers to earn a depreciation and a return (NERSA 2016). NERSA requires electricity distributors to conduct a CoS study as it will form an objective basis to determine tariff increases. Very few municipalities have carried out the CoS (Kaziboni et al. 2018). Amra (2013) noted that the CoS has a risk of allowing licensees to either over-recover or under-recover their cost if it is not subjected to independent verification and rigorous testing. Kelly (2016) stated that only large municipalities have been able to conduct CoS because they have the capacity and resources. NERSA relies on Eskom's cost base to determine municipal tariffs; NERSA also looks at the investments municipalities make into R&M of distribution infrastructure. These should be funded through electricity tariffs (Nair et al. 2014). There is a requirement that if the investment in R&M is not aligned to the benchmark of 6% of a municipality's value of property plant and equipment, it should be substantiated by an explanation. NERSA approves applications for tariff increases above benchmarks for municipalities if they are supported by information that the funds would be used for capital infrastructure programmes. These funds must be ring-fenced for use on the intended capex projects. Montgomery-Clair and Rynan (2014) contended that the biggest role NERSA plays in infrastructure investment is by giving municipalities an incentive to invest in distribution infrastructure, as well as skills and resources to carry out infrastructure refurbishment projects. This can be achieved through a stakeholder approach that involves the DOE and the National Treasury. NERSA could also introduce norms and standards such as minimum maintenance levels and measures to penalise municipalities that do not spend allocated capex and maintenance budgets.
Eskom on the other hand is regulated through the multiyear price determination (MYPD) rate of return methodology. This method allows Eskom to earn a return on its assets, including distribution assets. This allows Eskom to earn a return on its regulatory asset base (RAB) to allow it to recoup the investment on capital employed (Eberhard 2012). For example, in the 2018/2019 revenue application, Eskom was allowed RAB value of R702 billion, for property plant and equipment, work under construction and working capital. From this RAB Eskom was allowed a return on assets of R4.3 billion for its electricity distribution assets, as well as depreciation of R5.9 billion on a weighted average cost of capital (WACC) of 4%. This return and depreciation was allowed after an assessment of efficiency and prudency of its capital expenditure programme by NERSA (2019). This approach is different from how municipal EDs are regulated where they are allowed to spend 1% on finance charges to repay loans and 6% for repairs and maintenance from their revenue from electricity.
As discussed above, some of the advantages with this approach are that it ensures that the utility earns a return on investment and reduces the risk for investors by providing certainty to the market. The method also provides a high level of oversight and ensures transparency and due process. However, utilities could overinvest in non-productive assets or gold plate. It is also difficult to determine a fair rate of return using this method (National Ports Authority 2017).
The literature review highlighted the fact that investment in electricity distribution infrastructure is not sufficient; thus, there has been increase in supply disruptions due to backlogs in investment and insufficient repairs. The regulation of municipal EDs is based on benchmarks for costs and tariffs. The expectation is that this will allow these licensees to recover revenues to invest in capital infrastructure development projects and earn a surplus. Eskom is regulated through a return of investment approach, which allows it to earn a return on assets as well as the depreciation for future asset replacement. This study emanates from a need to investigate if the regulatory methodology in place is adequate to allow for investment in assets. This study is necessary to establish the regulator methodology role in facilitating adequate investment in distribution infrastructure using empirical data. The following section discusses the results of both secondary and primary data collection.
Research methodology
Introduction
This section discusses the research method used for the study. The role of regulation in supporting infrastructure investment and monitoring the performance of EDs was examined through literature review, secondary data collection of distribution data (D-Forms, used by distribution licensees when submitting their annual tariff application for approval), as well as interviews with officials involved in analysis and approval of ED tariffs at NERSA. The present study was conducted through both primary and secondary methods of research. Primary data were collected through interviews with officials of NERSA that are involved in analysing and recommending EDs' tariff applications for approval by the Energy Regulatory Board members. Interviews are useful to collect data that explain or describe a phenomenon from the point of view of respondents (Alshenqeeti 2015). Secondary data of financial and technical information of EDs were collected and analysed from the D-forms that are submitted by EDs as part of tariff applications. These data are used by NERSA to analyse tariff applications and to monitor the performance of electricity distribution licensees. The use of secondary data has a potential to reduce the costs of research and to enhance or refute the conclusions derived from primary data. It also helps to entrench the validity of the research if reliable data sources were used (Nicholson & Bennett 2008).
Data collection
Data were collected using both qualitative and quantitative methods. Statistical data were collected from the six metropolitan D-forms and 106 local municipalities and the interviews were conducted with 10 NERSA officials.
Quantitative data were collected through a stratified sample of municipal EDs in South Africa. NERSA's records stated that there were 168 such municipalities in South Africa in 2016/2017. The present study then stratified these municipalities and categorised them based on size of the population within each municipality, as presented in Table 4.

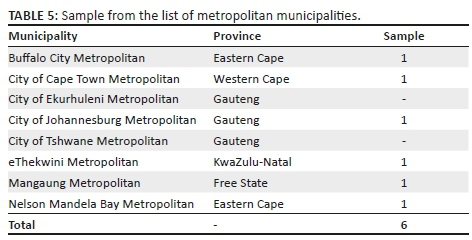
A municipality was selected from each population group for each province to ensure a representative sample of municipalities. A total of 112 municipalities were selected for this study. South Africa also has eight metros; a metro was selected from each province for inclusion into the list based on the population parameters. Six metros were selected in total, as depicted in Table 5.
Eskom sold 81 000 GWh to municipalities. The municipalities selected, represent 73 000 GWh, 90% of the municipal consumption for 2016/2017. Secondary data were collected through interviews with the officials of NERSA that are involved in the monitoring of EDs and approval of tariffs. These officials are organised into six clusters covering EDs throughout South Africa. Each cluster consists of a senior analyst that is in charge of a cluster and 3-4 analysts within each cluster. A total of 16 respondents participated from all six clusters, representing 67% of all analysts and senior analysts in the clusters.
Ethical consideration
This article followed all ethical standards for carrying out research.
Discussion of the results
Introduction
This section provides an analysis of primary and secondary data. Saunders et al. (2016) stated that quantitative data need to be interpreted and analysed to provide meaningful results to a reader, as unprocessed data give no meaning to the users. In quantitative method there are various analysis approaches including graphs and tables to help in examining relationships and trends of data for better presentation of information.
Findings and analysis
Correlation analysis
Table 6 provides a summary of the revenue from the sale of electricity of the sampled EDs. The minimum revenue earned by the smallest ED in 2016/2017 was R20.3 million, and the maximum was R16.03 billion. The average revenue was R79.7 million, as depicted in Table 6.
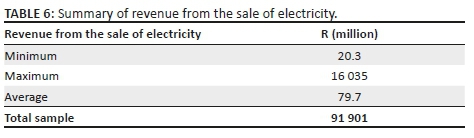
Table 7 summarises the financial performance of EDs.

The average surplus for the EDs in the study was −2.5%. NERSA's benchmark requires the surplus to be in a range of 10% - 20% to be acceptable. This means that the EDs are not generating enough surplus to invest in capex. This is in spite of the fact that the mark-up they are allowed from electricity tariffs is 57%, slightly below the benchmark range of 58% - 62%. The low surplus can be attributed to the fact that the energy losses are higher than the allowed losses at 18.31%, against a range of 5% - 12%. The surplus amounts of selected EDs range from -65% to 40%.
The percentage power costs measure how much of the revenue received from customers is spent on electricity purchases in relation to all other costs. If the percentage power cost is within the range, it is an indication that an ED is not subsiding other businesses from revenue from electricity business. This might mean that funds that should be used for infrastructure investment are not redirected to other services. The average power cost was 68% against a benchmark of 58% - 78%. The average selling price was 139c/KWh for 2016/2017. The average sales price to average purchase price ratio is 1:1.58 - 1:1.62. Electricity distributors are expected to spend at least 6% of their budget on R&M. The average expenditure on R&M for 2016/2017 was 7.4%.
The researcher tried to establish if the financial performance data collected from the sample could be used to perform certain statistical analysis to assess, for instance, if there is any correlation between the variables. The researcher also tried to investigate whether the data set could be used to predict certain trends, by predicting a relationship between variables.
As Table 8 depicts, there is a strong negative correlation between surplus and energy losses, which means that when losses increase, the surplus decreases. The analysis also established that there is a weak negative correlation between revenues collected and R&M investment, which means that on a small scale EDs that collect higher revenues do not necessarily spend more on R&M. Lastly, there is a weak negative correlation between revenues and losses, which means that on a small scale EDs that have higher revenues just experience lower losses.

Primary data collected suggest that there is almost no correlation between the numerous financial benchmarks that are used to assess the performance of EDs. For example, there is almost no correlation between energy losses and the revenue size of EDs. This means that even though EDs with large revenues might be expected to have resources to address losses, this is not necessarily the case, as depicted in Table 8.
The researcher also tried to test other variables such as surplus and R&M, power purchase costs and R&M, and losses and R&M. The statistical analysis of these variables showed that there is a low correlation between these variables and a relationship between them could not be established.
The researcher also conducted a regression analysis to ascertain if any of the financial variables can be used to predict any of dependent variables, for example whether revenues of the ED can be used as a predictor of investment in R&M. None of the results was sufficiently significant to be included in the study.
Interview analysis
In this article, an interview was conducted with NERSA officials of different ages, genders and areas of employment (technical and financial employees). Interview data were coded and interpreted using descriptive codes that emanated from responses. In vivo descriptive codes come directly from statements of respondents and are based on an analysis of common statements from subjects or are common phrases found in statements being examined (Cope 2010). From these common phrases key emerging themes were analysed. These are summarised below.
Respondents were asked if NERSA monitors the investment of EDs in capital expenditure. Respondents stated that licensees are expected to submit regulatory financial reports as part of their application for annual tariff increases based on bulk purchase increase from Eskom. Respondents stated that they are aware of the existence of infrastructure backlogs in EDs under the cluster as evidenced by the regular power outages and interruptions that occur in some of the EDs in their clusters.
Respondents also stated that the financial benchmarks used by NERSA do not provide for licensees to earn a return on assets. They are allowed a mark-up on purchases from Eskom thus allowing them to earn a surplus. This is because EDs do not have up-to-date regulated asset registers that would allow them to earn a return and depreciation on their assets.
Respondents were asked if the tariffs are cost reflective and if licensees can use revenue from sale of electricity alone to meet their infrastructure needs. Respondents stated that the tariffs that EDs charge are not cost reflective in that they do not allow them to cover their costs and earn a return on their assets. This, they state, emanates from the fact that the financial reports of the EDs show that they are not enough to cover their costs and generate a surplus. Respondents also stated that it is hard to determine that EDs are not generating a surplus because they have not concluded the CoS studies that are required by NERSA. Therefore, without these studies, cost reflective tariffs cannot be implemented by EDs.
Respondents stated that tariffs alone are not sufficient to ensure that capital infrastructure is maintained and refurbished. That is why there is a need for government funding in the form of MIGs to finance the acquisition of capital assets. Electricity distributors are also allowed to apply for above average tariff increases to finance capital infrastructure acquisition. Once NERSA grants this increase, the funds should be ring-fenced for specific asset acquisitions, for example substations, transformers or 11 KV lines.
Respondents were asked how NERSA monitors the information submitted on R&M expenditure. Respondents stated that NERSA required licenses to report annually on their R&M budget to ensure that they spend a minimum of 6% of their revenue from the sale of electricity on R&M costs, both material and labour. Respondents stated that R&M could be of a short-term (operational) or long-term nature (capex). The energy regulator does not the capacity to distinguish between short-term refurbishment and capex in the current regulator reporting methodology. Respondents stated that an accurate measure for R&M efficiency is an ED's ability to reduce energy losses.
Recommendations
-
It was found that NERSA relies on information provided by distributors in making decisions thereby performing its role of regulation in facilitating investment in capital infrastructure acquisition. It is therefore recommended that data that NERSA rely on when making decisions that facilitate investment in capital expenditure are accurate and reliable.
-
Electricity distributors must develop a CoS study to achieve a cost reflective tariff to enable them to invest in infrastructure expansion and refurbishment.
-
Electricity tariffs are not sufficient for electricity distributors to contribute towards capex. It was found that tariffs alone are not the only mechanism to ensure that capital infrastructure is maintained and refurbished. It is therefore recommended that other mechanisms such as infrastructure finance grants be considered to facilitate investment in capital infrastructure.
-
It was found that when losses increase, surpluses for distributors decreases. It is recommended that distributors comply with financial performance measures used by NERSA to be able to invest in capital investments.
Conclusion
Benchmarks determined by NERSA assist in ensuring that EDs are efficient in their operations so that through the surpluses they generate, they can invest in the acquisition of new capital infrastructure. Benchmarks provide a yardstick to measure performance of regulated entities; however, for earning a return on assets, benchmarks alone are not sufficient. The regulator is in the process of implementing CoS studies that will allow EDs to earn a reasonable return to be able to generate revenues to invest in new assets. Electricity distributors also need to address and reduce high-energy losses, as they are an obstacle towards the collection of more revenue to allow for more capital investment.
The role of regulation in facilitating capital investment is important to ensure the financial sustainability of electricity distributors and thereby achieve security of supply in South Africa. The energy regulator in making its decision needs to rely on credible and accurate information provided by electricity distributors.
Municipal infrastructure grants need to be considered for infrastructure expansion at municipal level since tariffs alone are not sufficient to enable the capital investment. These grants are conditional in nature and are gazetted based on registered capital projected.
This article focused on the role of regulation in investment in electricity distribution capital infrastructure in South Africa. Further study is suggested to be conducted in the following areas:
-
The role of CoS to achieve cost reflective tariffs.
-
Impact of non-technical losses on municipal surpluses.
-
Impact of technical losses on municipal surpluses.
-
The rise of renewable energy and their impact on the electricity supply in South Africa.
-
Relevancy and adequacy of an infrastructure grant in financing capital expansion.
Acknowledgements
The National Energy Regulator of South Africa made it possible for this study to be conducted.
Competing interests
The authors have declared that no competing interest exists.
Authors' contributions
All authors contributed equally to this work.
Funding information
This study did not receive any specific grant from any agency in the public, commercial and not-for profit sectors.
Data availability statement
The data used for this study are available for sharing.
Disclaimer
The views and opinions expressed in this article are those of the authors and do not necessarily represent the official policy or position of any affiliated agency of the authors.
References
Alexander, I. & Irwin, T., 1996, Price caps, rate of return regulation and the cost of capital, viewed 10 September 2019, from http://regulationbodyofknowledge.org/wp-content/uploads/2013/03/Alexander_Price_Caps_Rate.pdf. [ Links ]
Alshenqeeti, H., 2015, Interviewing as a data collection method: A critical review, viewed 18 December 2018, from https://www.researchgate.net/publication/269869369_Interviewing_as _a_Data_Collection_Method_A_Critical_Review. [ Links ]
Amra, R., 2013, Back to the drawing board? A critical evaluation of South Africa's electricity tariff setting methodology, viewed 14 November 2018, from http://www.google.co.za/url?sa=t&rct=j&q=&esrc=s&source=web&cd=13&cad=rja&uact=8&ve d=2ahUKEwicpNG3mtTeAhVwsosKHaQGDGAQFjAMegQIBxAC&url=http%3A%2F%2Fww w.essa2013.org.za%2Ffullpaper%2Fessa2013_2671.pdf&usg=AOvVaw2tbyZ_koxG_Zf52bdMQHLT. [ Links ]
Cope, M., 2010, Coding qualitative data, Researchgate Publications, viewed 10 March 2019, from https://www.researchgate.net/publication/284143585_Coding_qualitative_data. [ Links ]
Cullmann, A. & Nieswand, M., 2015, Regulation and investment incentives in electricity distribution: An empirical assessment, viewed 02 November 2018, from https://www.sciencedirect.com/science/article/pii/S0140988316301256. [ Links ]
De Beer, W., 2016, Maintenance backlog impact on service delivery, EE Publishers, viewed 14 October 2018, from http://www.ee.co.za/article/distribution-infrastructure-maintenance-backlog-impact-service-delivery.html. [ Links ]
Development Bank of Southern Africa, 2012, Infrastructure Barometer, viewed 22 October 2018, from https://www.dbsa.org/EN/AboutUs/Publications/Documents/Infrastructure%20Barometer%202012.pdf. [ Links ]
Doulet, A., 2016, Electricity supply cost, tariff level and structure, viewed 20 November 2018, from https://www.afurnet.org/en/publications/category/12-guidelines-electricity-supply-cost-tariff-level-and-structure. [ Links ]
Eberhard A., 2006, Infrastructure regulation in developing countries: An exploration of hybrid and transitional models, African Forum of Utility Regulators Conference Paper, 15-16 March 2006, Windhoek, viewed 02 August 2018, from http://www.gsb.uct.ac.za/files/AFURHybridandTransitionalModels.pdf. [ Links ]
Eberhard, A., 2012, Rethinking economic regulation of infrastructure industries, viewed 02 November 2018, from https://www.gsb.uct.ac.za/files/SAEconomicRegulatorsConference.pdf. [ Links ]
Egert, 2009, Infrastructure investment in network industries: The role of incentive regulation and regulatory independence, viewed 02 November 2018, from http://www.oecd.org/officialdocuments/publicdisplaydocumentpdf/?doclanguag e=en&cote=eco/wkp(2009)29. [ Links ]
Electricity Pricing Policy, 2008, Department of Energy of South Africa, viewed 14 October 2018, from http://www.eskom.co.za/CustomerCare/TariffsAndCharges/Documents/18671_not13981.pdf. [ Links ]
Eskom, 2014a, The South African distribution code: Tariff code, viewed 20 November 2018, from http://www.nersa.org.za/Admin/Document/Editor/file/Electricity/IndustryStandards/RSA%20Distr ibution%20Tariff%20Code%20%20Ver%206.pdf. [ Links ]
Eskom, 2014b, South African distribution tariff code version 6.0, viewed 16 October 2018, from http://www.nersa.org.za/Admin/Document/Editor/file/Electricity/IndustryStandards /RSA%20Distribution%20Tariff%20Code%20%20Ver%206.pdf. [ Links ]
Eskom, 2019, Presentation for Rustenburg public hearings, unpublished presentation, Eskom, Johannesburg. [ Links ]
Felsmann, B., 2013, Africa energy cooperation- lessons and the way forward: V4 energy policy recommendations for Southern Africa region, viewed 08 November 2018, from http://eafes.eu/AFRICAENERGYCOOPERATION.pdf. [ Links ]
Kaziboni, L., Rustomnjee, Z. & Steuart, I., 2018, Structural transformation: The impact of municipal electricity pricing policy on the foundry industry, Centre for Competition, Regulation and Economic Development, viewed 27 October 2018, from https://static1.squarespace.com/static/52246331e4b0a46e5f1b8ce5/t/5aaa4b4d08522 91a6831808e/1521109842594/Policy+Brief+4.pdf. [ Links ]
Kelly, P.J., 2016, Who pushes the buttons? Investigating the regulatory governance of retail electricity tariff setting in South Africa through institutional analysis and development, viewed 17 November 2018, from https://onlinelibrary.wiley.com/doi/abs/10.1111/rsp3.12126. [ Links ]
Khan, I.A., 2018, 'Electricity tariff determination methodologies', in 15th SAFIR core course paper, viewed 14 November 2018, from http://www.safirasia.org/sites/default/files/ELECTRICITY%20TARIFF%20DETER MINATION%20METHODOLOGIES_1.pdf. [ Links ]
Mahabir, J. & Mabena, N., 2015, Identifying the funding constraints in municipal capital investments, viewed 11 November 2018, from http://www.google.co.za/url?sa=t&rct=j&q=&esrc=s&source=web&cd=1&ved=2ahUKEwjP7oSAw sveAhXEzoUKHQlkDlgQFjAAegQIABAC&url=http%3A%2F%2Fwww.ffc.co.za%2Fdocman-menu-item%2Fcommission-submissions%2F2015-2016-technical-report%2F833-2015-2016-tr-chapter-9-identifying-the-funding-constraints-in-municipal-capital-investment&usg=AOvVaw1NvvYOo7tzZC8dLK9eRBTN. [ Links ]
Muratovic, 2017, Technical assistance to develop policy guidelines for the distribution network tariffs, viewed 20 November 2018, from https://www.energy-community.org/dam/jcr:fde76489-9cf4-4d56-83b3-47426e9ce609/Muratovic-Tariffs_2017.pdf. [ Links ]
Nair, R., Montmasson-Clair, G. & Ryan, G., 2014, Regulatory entities capacity building project review of regulators orientation and performance: Review of regulation in the electricity supply industry, viewed 17 November 2018, from http://www.tips.org.za/files/u72/edd-uj_recbp_project_report_renewable_energy_review_final.pdf. [ Links ]
National Ports Regulator of South Africa, 2017, Issues for consideration in the review of port tariff review methodology, viewed 20 April 2020, from https://www.portsregulator.org/images/documents/Issues-for-consideration-in-the-review-of-the-tariff-methodology-2016-17.pdf. [ Links ]
National Treasury of South Africa, 2015, Unpacking infrastructure development spending in local government: Municipal infrastructure summit, viewed 17 November 2018, from http://lgbn.co.za/home/attachments/article/71/Municipal%20Capital%20Expenditure%20MIS.pdf. [ Links ]
National Treasury of South Africa, 2016, Explanatory memorandum to the division of revenue, viewed 07 September 2019, from http://www.treasury.gov.za/documents/national%20budget/2016/review/Annexure%20W1.pdf. [ Links ]
National Treasury of South Africa, 2017, State of municipal finances and expenditure as at 30 June 2017, viewed 31 October 2018, from https://www.salga.org.za/SALGA%20Municipal%20Managers%20Forum/Presentatio ns/MMs%20Forum%20%20State%20of%20LG%20Finances%2031%20Aug%202017.pdf. [ Links ]
National Energy Regulator of South Africa (NERSA), 2016, Cost of supply framework, viewed 14 November 2018, from http://www.nersa.org.za/Admin/Document/Editor/file/Electricity/Legislation/Methodologies %20and%20Guidelines/Cost%20of%20Supply%20Framework.pdf. [ Links ]
National Energy Regulator of South Africa (NERSA), 2018, Determination of the municipal tariff guideline for the financial year 2018/19 and the revision of municipal tariff benchmarks, viewed 19 November 2018, from http://www.nersa.org.za/Admin/DocumentUpload/UploadFiles/RFD%20Municipal %20Tariff%20Guideline%202018-19.pdf. [ Links ]
National Energy Regulator of South Africa (NERSA), 2019, Decision and reasons for decision, Eskom Holdings SOC Limited: Eskom's revenue application for 2018/19, viewed 22 April 2020, from http://www.nersa.org.za/Admin/DocumentUpload/UploadFiles/Reasons%20for%20Decision%20-%20Eskom%20Holdings%20SOC%20Limited%20-%20Eskom's%20revenue%20application%20for%202018196307022018030706.pdf. [ Links ]
Nezlobin, A., Rajan, M.V. & Reichelstein, S., 2012, Dynamics of rate of return regulation, viewed 10 September 2019, from https://pubsonline.informs.org/doi/abs/10.1287/mnsc.1110.1464. [ Links ]
Nicholson, S.W. & Bennett, T.B., 2008, Transparent practices: Primary and secondary data in business ethics dissertations, viewed 18 December 2018, from http://staff.lib.msu.edu/nicho147/Research/fulltext.pdf. [ Links ]
Palmer, I., Graham, N., Swilling, M., Robinson, B., Eales, K., Fisher-Jeffres, L. et al., 2016, Contribution to the integrated urban development framework: South Africa's urban infrastructure challenge, viewed 31 October 2018, from http://www.cogta.gov.za/cgta_2016/wp-content/uploads/2016/05/IUDF-INFRASTRUCTURE-PAPER.pdf. [ Links ]
South African Local Government Association (SALGA), 2018, The role of government in the energy landscape, Local Government Energy Summit Papers, viewed 22 September 2018, from https://www.salga.org.za/SALGA%20Energy%20Summit%202018/Energy%20Summit%20Web/ Document/Energy%20Summit_09%20Nov%2017.pdf. [ Links ]
Stats SA, 2017, Electricity big business for municipalities, viewed 20 March 2019, from http://www.statssa.gov.za/?p=10186. [ Links ]
Stratham, B.A., 2008, Funding and investment in electricity distribution infrastructure - Extracts from the World Energy Council study on Energy Policy Scenarios to 2050, viewed 06 November 2018, from http://www.nersa.org.za/Admin/Document/Editor/file/Electricity/Compliance%20Monitoring/ Paper%20by%20Brian%20A%20Statham.pdf. [ Links ]
The Centre for Scientific and Industrial Research, 2007, The state of municipal infrastructure in South Africa and its operation and maintenance; An overview, viewed 29 October 2018, from http://www.cidb.org.za/publications/Documents/State%20of%20Municipal %20Iinfrastructure%20in%20South%20Africa.pdf. [ Links ]
The Department of Energy (DOE), 2015, Electricity bulk infrastructure policy issues, viewed 01 October 2018, from http://www.energy.gov.za/files/policies/Electrification-Bulk-Infrastructure-Policy-Guidelines-2015.pdf. [ Links ]
The Financial and Fiscal Commission, 2013, FFC briefing to the Portfolio Committee on energy, viewed 29 October 2018, from http://www.google.co.za/url?sa=t&rct=j&q=&esrc=s&source=web& cd=2&cad=rja&uact=8&ved=2ahUKEwjeqOfu-aveAhVEsKQKHfH7D8sQFjABegQICBAC&url=http%3A%2F%2Fwww.ffc.co.za%2Fdocman-menu-item%2Fpresentations-2%2F677-ffc-presentation-to-pcoe&usg=AOvVaw3H2EzpKZc23aAB_Q1KQlGS. [ Links ]
Voss, J.O., Malcher, M., Puffe, M., Umlauf, F. & Grunder, C., 2018, The electricity distribution industry in Germany and South Africa - A review of policy and regulation, viewed 10 November 2018, from http://www.cityenergy.org.za/uploads/resource_463.pdf. [ Links ]
Zietsman, R.E., 2014, Provision of bulk municipal infrastructure by developers: A model that works, viewed 22 October 2018, from http://www.ameu.co.za/Portals/16/Conventions/Convention%202010/Papers/Provi sion%20of%20Bulk%20Municipal%20Infrastructure%20by%20Developers%20-%20Rob%20Zietsman%20Geopower.pdf. [ Links ]
 Correspondence:
Bongani Khonjelwayo
bonganikhonjelwayo@gmail.com
Received: 03 Oct. 2019
Accepted: 08 Apr. 2020
Published: 28 July 2020

