


Serviços Personalizados
Artigo
 Inglês (pdf)
 Artigo em XML
 Referências do artigo
Indicadores

Links relacionados
-
 Citado por Google
 -
 Similares em Google
Compartilhar

 Permalink
South African Journal of Economic and Management Sciences
versão On-line ISSN 2222-3436
versão impressa ISSN 1015-8812
S. Afr. j. econ. manag. sci. vol.23 no.1 Pretoria 2020
http://dx.doi.org/10.4102/sajems.v23i1.3350
ORIGINAL RESEARCH
Macroeconomic implications of uncertainty in South Africa
Theshne Kisten
Department of Economics, Faculty of Economics and Management Science, University of Pretoria, Pretoria, South Africa
ABSTRACT
AIM: This article explores the extent to which economic policy uncertainty (EPU) influences selected macroeconomic variables in South Africa (SA).
METHODS: To this end, I construct a constant parameter vector autoregressive (VAR) model and a time-varying parameter (TVP) VAR model, where the latter model evaluates if the impact of uncertainty on the macroeconomic variables has changed over time
SETTING: The models are estimated using quarterly South African data over the period 1990 to 2015, which include industrial production growth, consumer price inflation, 10-year government bond yield, real effective exchange rate, and economic policy uncertainty. Cholesky ordering of the variables are imposed to recover the orthogonal shocks.
RESULTS: The results of the constant parameter VAR model suggest that an unanticipated positive shock to the uncertainty index results in a decline in industrial production and real effective exchange rate, while fostering an increase in the general price level and 10-year government bond yield. Time-varying impulse responses show that the impact of uncertainty shocks on the selected macroeconomic variables has declined systematically over time. This is perhaps intuitive as the new unanticipated information is gradually picked up by media over time and incorporated into rational agents' decision-making.
CONCLUSION: The transmission of a positive uncertainty shock to the real economy has time-varying implications.
Keywords: uncertainty; South Africa; VAR; time-varying; macroeconomic.
Introduction
Over the past few years, a growing number of official local and international publications have mentioned political uncertainty as a major factor influencing macroeconomic dynamics in South Africa (SA). For instance, the most recent International Monetary Fund (IMF) World Economic Outlook publication released in October 2017 stated that 'in South Africa, growth is projected to remain subdued … as heightened political uncertainty saps consumer and business confidence'. Given this, my article will attempt to quantify the impact of economic policy uncertainty (EPU) on selected macroeconomic variables in SA by constructing a constant parameter vector autoregressive (VAR) model. In addition, I will attempt to examine if this impact changes over time, by constructing a time-varying parameter (TVP) VAR model.
My article contributes to the emerging market literature in two ways. Firstly, it extends the evidence that uncertainty shocks result in drops in real activity in developing countries. Secondly, it provides evidence on the time-varying impact of EPU shocks on the macroeconomic dynamics of an emerging market economy (SA in this case), by allowing for the variance of the structural shock, as well as the coefficients to vary over time. To my knowledge, the analysis of the time-varying impact of uncertainty, especially within a South African context, has not been examined in previous studies. Redl (2015) examined the impact of uncertainty shocks on the South African economy by means of a constant parameter VAR, finding that an unanticipated shock in the uncertainty index is linked to a decline in investment, private sector employment, output and industrial production, while resulting in an inflationary shock. However, the author did not examine if this impact changes over time.
As such, my article aims to fill the gap in literature by estimating a constant parameter VAR model and a TVP VAR model for the South African economy, employing a measure of uncertainty constructed by Hlatshwayo and Saxegaard (2016). A five-variable VAR system using quarterly data over the period 1990-2015 is estimated for both the constant and time-varying specifications. The models include industrial production, inflation, 10-year government bond yield, real effective exchange rate (REER), and the EPU index.
The impulse responses in the constant parameter VAR model suggest that an unanticipated positive shock to the uncertainty index is associated with a decline in industrial production and REER, while fostering an increase in the general price level and 10-year government bond yield. Markov Chain Monte Carlo (MCMC) methods in the context of a Bayesian inference are employed, following Primiceri (2005) and Nakajima (2011), to estimate a precise and efficient TVP VAR model with stochastic volatility. The dynamics of volatility over time is presented by the posterior estimates for stochastic volatility of the structural shock, which differ across variables. In this case, the constant parameter VAR model estimates would be biased in terms of the error covariance matrix and the autoregressive coefficients due to the misspecification of the dynamics of the parameters. The time-varying impulse responses for the specified dates (1994Q4, 1999Q4, 2004Q4 and 2009Q4) show that the impact of uncertainty shocks on industrial production, the REER and the price level has moderated slightly over time (with the timing of the change of the price level coinciding with the introduction of inflation targeting in the economy), while the impact on the bond yield has remained fairly stable. While the time-varying impulse responses of the macroeconomic variables for the 2, 4, 8 and 12 period ahead, following an unanticipated shock to the economic policy uncertainty index, show a diminishing impact over time, as the new unanticipated information is gradually picked up by media and incorporated into rational agents' decision-making.
The remainder of the article is organised as follows. In Section 2, I review the literature on uncertainty shocks. Section 3 describes the EPU index used and its construction. Section 4 presents the estimation procedure and empirical results of the constant parameter VAR model. Section 5 presents the estimation procedure and results of the TVP VAR model, and Section 6 concludes.
Literature review
Theoretical literature highlights three broad reasons for why uncertainty matters, which include real options, risk aversion and growth options effect. Uncertainty influences growth via negative channels (real options and risk aversion) and positive channels (growth options) (Bloom 2014). However, the majority of empirical studies tend to lend support to the negative channels rather the positive channel.
The idea of the real options effect is that firms face a number of investment projects that they may delay in the event of uncertainty. However, certain prerequisites are needed for this to have macroeconomic implications: firms must be subject to adjustment costs that cannot be easily reversible, must have the ability to wait in terms of bringing their product to the market, and finally firms' investment actions today should influence the returns to actions taken tomorrow (for example, operate in an environment characterised by decreasing-returns-to-scale technology). When uncertainty is high, these effects can dampen the reallocation of resources across firms aimed at enhancing productivity, as productive firms expand less, while unproductive firms contract less as both are now cautious. According to Bloom, Baker and Davis (2015), this can result in pro-cyclical productivity and link these uncertainty shocks to the business cycle.
Since risk averse investors require a higher return in the event of uncertainty, this means that greater uncertainty results in increasing risk premia, which raises the cost of borrowing and hence the probability of defaulting. The increase in the cost of borrowing has negative microeconomic and macroeconomic growth implications, due to the amplification of financial stress (Arellano, Bai & Kehoe 2016; Caldara et al. 2013; Christiano, Motto & Rostagno 2013). Considering an increase in uncertainty from the households' perspective, risk aversion causes households to increase their precautionary savings, reducing consumption expenditure. This is likely to have a contractionary effect on the economy in the short run but stimulate growth in the long run through rising investment. However, in small highly open economies there could be a substantial reduction in domestic demand as much of the households' savings flows abroad (Fernandez-Villaverde et al. 2011 cited in Bloom 2014). If nominal rigidities are strong, prices and interest rates will not decline sufficiently following the drop in demand, leading to a recession in any economy (Leduc & Liu 2015).
An increase in uncertainty can also be interpreted as positive on a macroeconomic level, although empirical literature has consistently proved otherwise. The growth options effect hinges on the idea that uncertainty can encourage investment to the extent that it increases the size of the potential return (by creating call options). The possible reason for why this effect is rarely observed in empirical studies is perhaps due to the 'ambiguity aversion' of agents. Such agents tend to assume the worst case scenario of the possible distributions they consider, thus an increase in uncertainty concerning future profits would lower the worst-case return on the investments (Bianchi, Ilut & Schneider 2017).
Since the global financial crisis of 2008, a growing amount of empirical literature has dealt with the measurement of uncertainty and how it affects macroeconomic variables. Bloom (2009) initiated the development of proxies for uncertainty by using United States (US) stock market volatility as a measure of uncertainty. He found stock market volatility to be a leading indicator for declines in employment, industrial production, and federal funds rate (FFR) which tend to display a short recessionary effect (however, FFR experienced a much more persistent drop). However, a period of positive catch-up growth recovery followed this decline. This pattern occurs since following higher uncertainty, real activity drops as hiring and investment plans are paused, but can be quickly recovered as this uncertainty dissipates.
Baker, Bloom and Davis (2013) developed an EPU index for the US, based on newspaper-coverage frequency on uncertainty stories about the economy, monetary and regulatory policy, the number of federal tax code provisions set to expire, and the extent of forecaster disagreement over future inflation and government purchases. Employing a VAR analysis, the authors find that increases in the EPU index result in sizable persistent declines in output, investment, consumption expenditure and employment. A similar methodology was conducted for the United Kingdom (UK) by Dendy et al. (2013) cited in Redl (2015), however, based on economic rather than policy uncertainty composed of disagreements among forecasters on economic variables, a news-based index, and remarks pertaining to uncertainty in Financial Stability Reports (FSRs) and Monetary Policy Committee (MPC) minutes of the Bank of England. The findings of the study were similar to Baker et al. (2013), while there was no evidence of positive growth catch-up as in Bloom (2009).
An index of economic uncertainty for SA was developed by Redl (2015), using a similar methodology proposed by Baker et al. (2013). Redl employed three sources to construct the economic uncertainty index, including data on professional forecaster disagreement concerning macroeconomic conditions, mentions of uncertainty in the quarterly economic review of the South African Reserve Bank (SARB) and a count of newspaper articles (domestic and international) discussing economic uncertainty in SA. The author finds that an anticipated shock in the uncertainty index is linked to a decline in investment, private sector employment, output and industrial production, while resulting in an inflationary shock contradictory to US and UK evidence. Similar results were found when the author included control variables related to financial stress and consumer confidence. Similarly, Gupta, Bonga-Bonga and Jooste (2015) investigated the macroeconomic effects of uncertainty shocks in India, constructing a structural model that decomposes uncertainty into positive and negative contributions. They find that an increase in uncertainty results in a reduction in prices and industrial production, increases interest rates and fosters exchange rate depreciation, while a decrease in uncertainty reduces prices, increases industrial production, fosters exchange rate appreciation and slightly increases interest rates. However, they find that the macroeconomic response to uncertainty is insignificant.
Baker, Bloom and Davis (2016) extend their analysis by constructing country-specific measures of economic policy uncertainty. These measures are based on newspaper-coverage frequency, and are found to be positively correlated with fluctuations in policy-related economic uncertainty. For instance, the US EPU index peaked during wars, tight presidential elections, the 9/11 terror attack, the failure of Lehman Brothers, and a number fiscal policy encounters. In their analysis, the authors find that increased policy uncertainty in the US foreshadows a reduction in output, investment and employment while resulting in an increase in stock price volatility in the country. This result was largely confirmed by a panel VAR modelling 12 major economies.
Hlatshwayo and Saxegaard (2016) construct a news-based measure of South African EPU by counting the number of articles that match a certain search algorithm containing words related to aggregate economic and aggregate policy uncertainty. The authors explore the relationship between exports, foreign demand, REER and the uncertainty index and they discover that the responsiveness of exports to relative price changes diminishes following an increase in policy uncertainty. This is because the increase in uncertainty increases the real option value of firms adopting a 'wait and see' approach when it comes to making large, exporting-related fixed cost investments (which supports the idea of the real options effect explained by Bloom 2014). The results were found to be robust to alternative explanations that consider credit constraints, supply chains, and threshold boundary effects. Furthermore, the unadjusted REER was outperformed by a measure of competitiveness that adjusts for uncertainty and supply-side constraints in tracking exports performance in SA.
The exploration of the time-varying nature of macroeconomic dynamics to uncertainty shocks have been quite limited, especially for emerging market economies. Alessandri and Mumtaz (2014) investigate the potential non-linearities related to the impact of uncertainty shocks but do not examine whether the impact experiences gradual changes over time. While Benati (2014) employs a time-varying VAR to estimate the importance of policy uncertainty shocks but focuses on the great recession rather than considering structural changes over an expanded time period. Mumtaz and Theodoridis (2014) fill these gaps by developing an extended factor augmented VAR to investigate the time-varying impact of uncertainty shocks on the US economy by allowing for both the parameters and error variances to vary over time. They find that the impact of uncertainty shocks on US financial and real activity variables has moderated over time, while the impact on the short-term interest rate and inflation has remained fairly stable. A similar study obtaining similar results was constructed for the UK by Mumtaz (2016). However, the author finds that the impact of uncertainty shocks on interest rates and inflation has also moderated over time, with the timing of the change coinciding with the introduction of inflation targeting in the economy.
Economic policy uncertainty index
I make use of the 'news chatter' EPU index constructed by Hlatshwayo and Saxegaard (2016) for the purpose of investigating the macroeconomic implications of uncertainty.1 The index, which is standardised to range between 0 and 100, is based on a count of articles related to aggregate economic and aggregate policy uncertainty. Search algorithms were employed by the authors (via the Dow Jones Factiva news aggregator) sourcing articles that contain words related to 'economics', 'policy', 'government', 'politics' and 'uncertainty' within 10 words of 'South Africa'. The methodology of constructing the index was similar to that employed by Baker et al. (2016) - the authors championed the 'news chatter' approach to measuring uncertainty in the press, as such a measure has the ability to detect the threat or anticipation of volatility, irrespective of whether it comes to fruition or not.
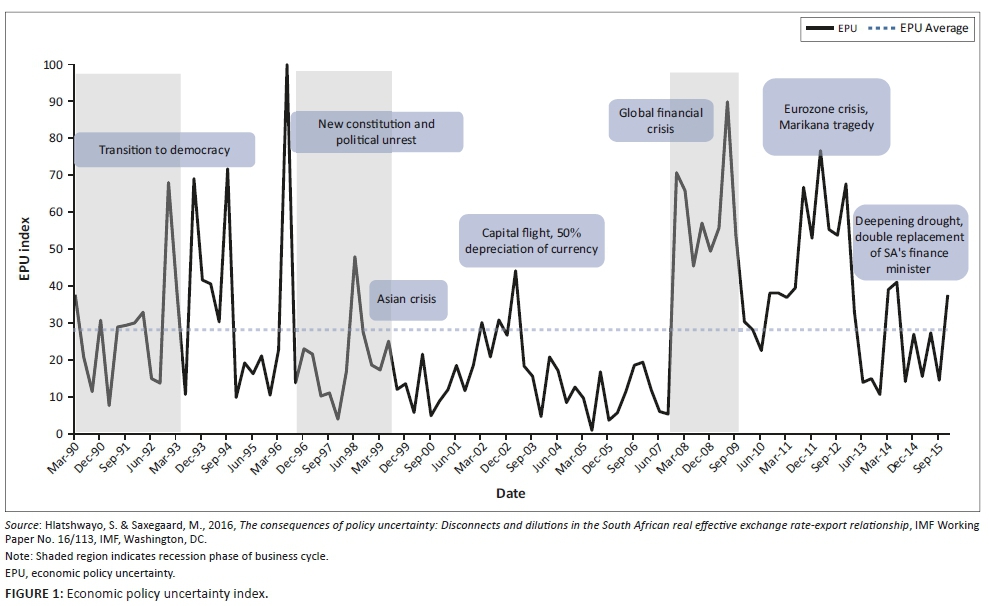
Figure 1 shows the periods during which the uncertainty index reached its peaked levels above its average level for the period 1990-2015. The 1990s was clouded by a high degree of political turbulence, resulting in the index peaking during the 1992-1994 period of democratic transition (release of political prisoners and the unbanning of political organisations, Convention for a Democratic South Africa negotiations to end apartheid) and 1996 (new constitution and violent political unrest). The South African currency depreciated by almost 50% during the 2000-2002 period following capital flight associated with the destabilising effects of the earlier Asian crisis and collapse of Long Term Capital Management in 2000. Economic policy uncertainty spiked again in the late 2000s due to external pressure, investment regulatory uncertainty and an energy crisis.
While global pressures loomed large during 2008-2009 due to the global financial crisis, domestic pressures were also present. Domestic pressures in 2008 included electricity shortages during the early part of the year, due to the near collapse of the national electricity grid, and the split of the African National Congress (ANC) into various parties which aroused concerns by many as to whether South Africa would adopt more populist policies. Uncertainty increased in 2012 due to domestic pressure emerging from the heavy protest- infested Marikana mining tragedy (worse strike action since post-apartheid era), and external pressure from the Eurozone crisis (sparked concerns related to central banks of developed economies raising interest rates above zero). Concerns loomed in South Africa during the 2014-2015 period following deepening drought conditions affecting food production and prices, and the double replacement of the Finance Minister in four days in late 2015. The figure also displays the recessionary periods of the South African economy, which do not necessarily coincide with spikes in uncertainty, suggesting that the measure picks up aspects of uncertainty beyond economic volatility.
Constant parameter vector autoregressive model
Data and estimation procedure
In this section, I estimate a structural vector autoregressive (SVAR) model with constant parameters to analyse the extent to which uncertainty impacts upon selected macroeconomic variables. The benchmark model that is estimated is represented as:

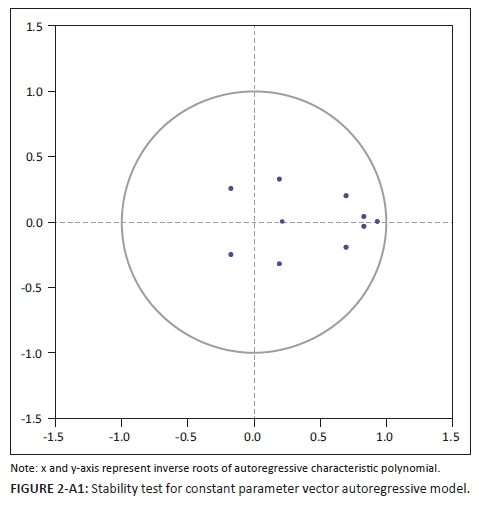
Zt is a vector of (k × 1) observed variables which include log of industrial production ('ip'), log of consumer price inflation (CPI) index ('cpi'), 10-year government bond yield ('yield'), log of REER ('reer') and the economic policy uncertainty (EPU) index. C0 is an intercept term, B1,…… . …,Bs are (k × k) matrices of constant coefficients, t is a linear time trend, and et ~ N(0: ∑). The data is obtained from various sources on a quarterly basis for the period 1990Q1 to 2015Q4.2 All variables with the exception of the EPU index (stationary in level) were found to be trend stationary, hence I include a linear time trend (t) in the specification to de-trend the data. Three of the criteria (LR test statistic, final prediction error, Akaike information criterion) of the lag length criteria test suggest inclusion of two lags in the model. Estimation of the VAR with two lags produces fairly robust results, which is confirmed by the diagnostic tests for the residuals, and furthermore the stability condition is satisfied as all roots of the characteristic polynomial lie within the unit circle.3
To recover orthogonal shocks, I use the Cholesky ordering of variables as above, ordering slower moving variables first before faster moving variables (Redl 2015 and related literature). The EPU index is ordered last as it mainly accounts for agents' expectations, which can change quickly.
Empirical results
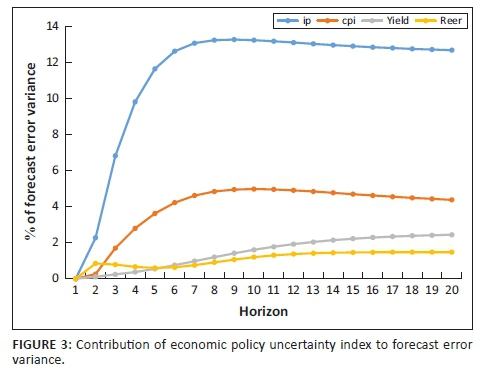
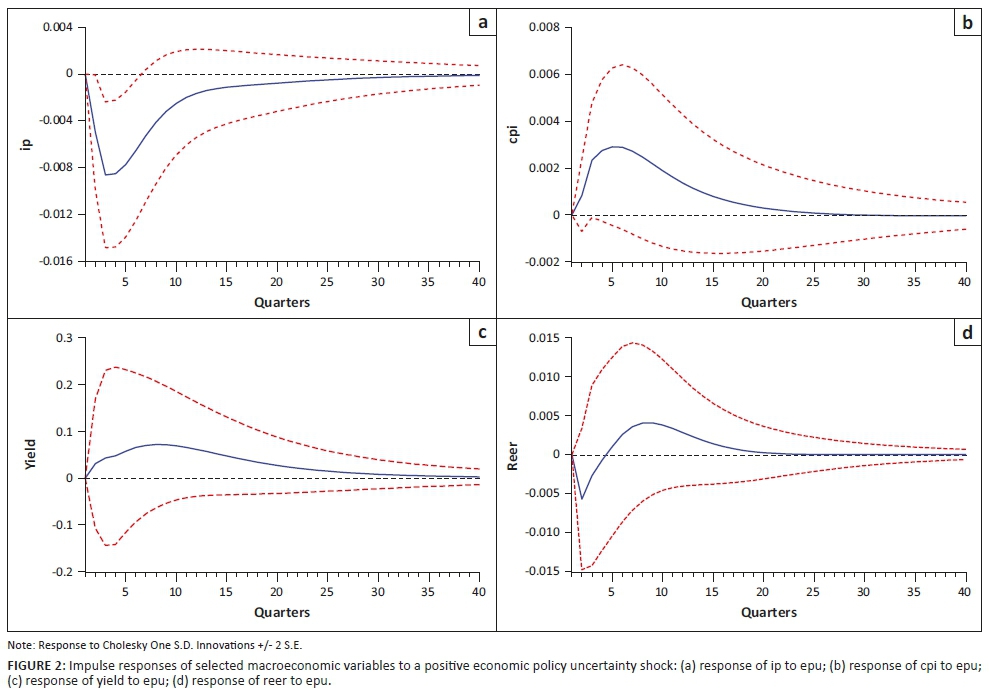
Figure 2 and Figure 3 display the quantitative empirical results for the time-invariant VAR model, analysing the response of the macroeconomic dynamics in SA to shocks to EPU, and the contribution of uncertainty in explaining the forecast error variance of the selected variables.
The impulse responses in Figure 2 suggest that an unanticipated positive shock to the uncertainty index (i.e. a 1% increase in the uncertainty index) is associated with a decline in industrial production and REER, while fostering an increase in the general price level and 10-year government bond yield. Industrial production experiences a more pronounced decline with a peak fall of about 0.8% after 1 year, before increasing and returning to equilibrium after 10 years. The response of industrial production to uncertainty is largely in line with literature (Bloom 2009; Gupta et al. 2015; Redl 2015). The REER experiences a more immediate impact of about 0.5% decline after two quarters, before increasing by 0.4% in two years and thereafter moderating to equilibrium after about five years. This finding of the immediate depreciation in the exchange rate following a positive shock to uncertainty is supported by Gupta et al. (2015). In support of the study by Redl (2015) but in contrast to Gupta et al., the price level experiences a peaked increase of about 0.3% after five quarters, before returning to equilibrium after six years. The yield on 10-year government bonds rises by close to 0.1% after 2 years following an increase in uncertainty, before moderating and returning to equilibrium in around 10 years. This supports the risk-aversion effect of uncertainty as increased uncertainty results in increasing risk premia, which raises the cost of borrowing and hence the probability of defaulting.
Variance decompositions in Figure 3 show that almost 14% of the forecast error variance of industrial production is explained by uncertainty shocks. The uncertainty index is also an important component of the variance of the price level (explains almost 5% of its variation) but explains less than 2% of the forecast error variance of the REER and 10-year government bond yield.
Time-varying parameter vector autoregressive model
Data and estimation procedure
In order to capture the possible time-varying nature of macroeconomic dynamics in the South African economy to shocks in uncertainty, I estimate a time-varying parameter VAR model with stochastic volatility.4 Since stochastic volatility imposes difficulty in estimating a precise and efficient TVP VAR model because the likelihood function becomes intractable, I employ MCMC methods in the context of a Bayesian inference, in order to overcome the difficulty.5
The five-variable TVP VAR model that is estimated for the period 1990Q1-2015Q4 is specified by:

t = s + 1, ………, n, Zt is a (k × 1) vector of observed variables which include the same variables that were specified in the time-invariant parameter VAR model - however, all variables with the exception of EPU (in natural log terms) are in natural log-differenced terms (10-year government bond yield is differenced but not in natural log terms given that it is a rate), as non-stationary variables with trends do not fit TVP VAR models well. B1t,…… . …,Bst are (k × k) matrices of time-varying coefficients, , and et ~ N(0: Ωt). where Ωt is a (k × k) time-varying covariance matrix. An assumption pertaining to a recursive identification is made by the breakdown of Ωt i.e.
 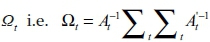 , where At represents a lower-triangular matrix with the diagonal elements equal to 1, and ∑t is a matrix with diagonal elements σ1t, … . . σkt, and off-diagonal elements equal to 0. In this VAR specification, the coefficients B1t,…… . …,Bst, the parameters At and ∑t are all time-varying. To model the process for these time-varying parameters (following Primiceri 2005 and Nakajima 2011), let βt be a stacked row vector of B1t,…… . …, Bst, simultaneous relations
  be a stacked row vector of the lower-triangular elements in At and
  with stochastic volatility
  , for j=1, ………, k, t = s + 1, ………, n. The time-varying parameters in Equation 2 are assumed to follow a random walk process as follows:
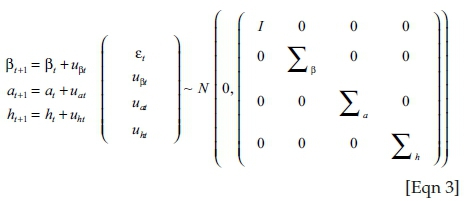
Equation 3 applies for t = s+1, ……… , n where 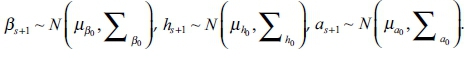 . Since the TVP VAR model has a number of parameters to estimate, employing the random walk assumption effectively decreases the number of parameters. It is assumed that Σβ, Σh and Σa are diagonal matrices (that govern the variance and covariance structure for the innovations of the time-varying parameters) and that the shocks to the innovations of the time-varying parameters are uncorrelated among the parameters βt, ht, at.
The model is specified with two lags as in the constant parameter VAR model, and the following priors (which provide reasonable identification) are assumed for the ith diagonals of the covariance matrices:
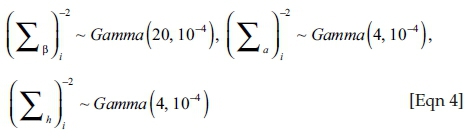
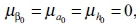 , and
, and 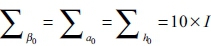 , implying that rather flat priors are set for the initial state of the time-varying parameter. A much tighter prior is set for the time-varying coefficient (β) compared to the simultaneous relations (a) and the volatility (h) of the structural shock for the variance of the disturbance in their time-varying process. M = 10 000 samples are drawn to compute the posterior estimates after discarding the initial 1000 samples.6
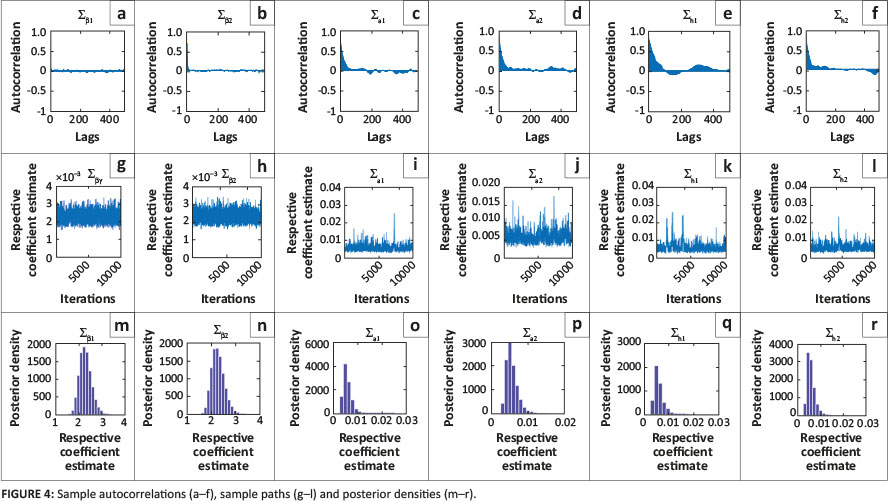
Figure 4 and Table 1 output the estimation results for selected parameters in the TVP VAR model specified above. Figure 4 illustrates the sample autocorrelation function, the sample paths and the posterior densities for selected parameters. Inspecting the figure reveals stable sample paths and stable decaying autocorrelation functions, after discarding the sample in the burn-in period (initial 1000 samples). This implies that uncorrelated samples are efficiently produced by the sampling method. Table 1 shows the estimates for posterior means, standard deviations, the 95% credible intervals (describes the uncertainty of the parameters), the Geweke (1992) convergence diagnostics (CD) and the inefficiency factors. The Geweke CD analyses individual chains by dividing the chain into two 'windows' containing a set fraction of the first and last iterations, dropping out the middle iterations.
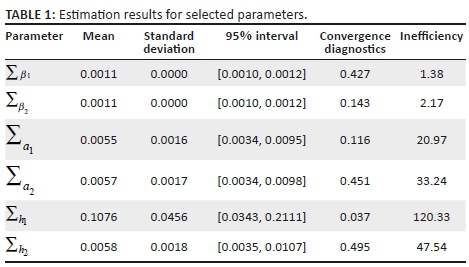
The mean of the sampled values in the two windows are then compared. However, there should be a sufficient number of iterations between the two windows to reasonably assume that the two means are approximately independent. This method then produces a CD statistic that is computed as the difference between the two means divided by the asymptotic standard error of the difference.7 As the number of iterations increase, the MCMC sampling converges in distribution to a standard normal (N(0,1)) if its sequence is stationary.
The p-value of the CD statistic in Table 1 provides evidence of convergence of the sequence of the MCMC sampling to the posterior distribution as the null hypothesis of convergence for the parameters cannot be rejected at the 1% level of significance. The inefficiency factor is computed as the numerical variance of the posterior sample mean divided by the variance of the sample mean from uncorrelated draws.8 Geweke (1992) cited in Nakajima (2011) states that the relative numerical efficiency is defined as the inverse of the inefficiency factor. The estimation results for the inefficiency factors are quite low for the parameters, with the exception of ∑h1, which nevertheless indicates an overall efficient sampling for the parameters and state variables. Even for the parameter ∑h1, the inefficiency factor is about 120, which implies that I obtain M/100 = 100 uncorrelated samples, which is considered to be enough for the posterior inference.
Empirical results
This section presents the quantitative empirical results for the TVP VAR model analysing the time-varying structure of the macroeconomic dynamics to shocks to EPU within a South African context. The South African economy experienced several different periods over the sample period from 1990Q1 to 2015Q4, from the transition period to democracy to the global financial crisis. Employing the TVP VAR, I investigate the time-varying structure of South African macroeconomic dynamics to shocks to uncertainty, as follows.
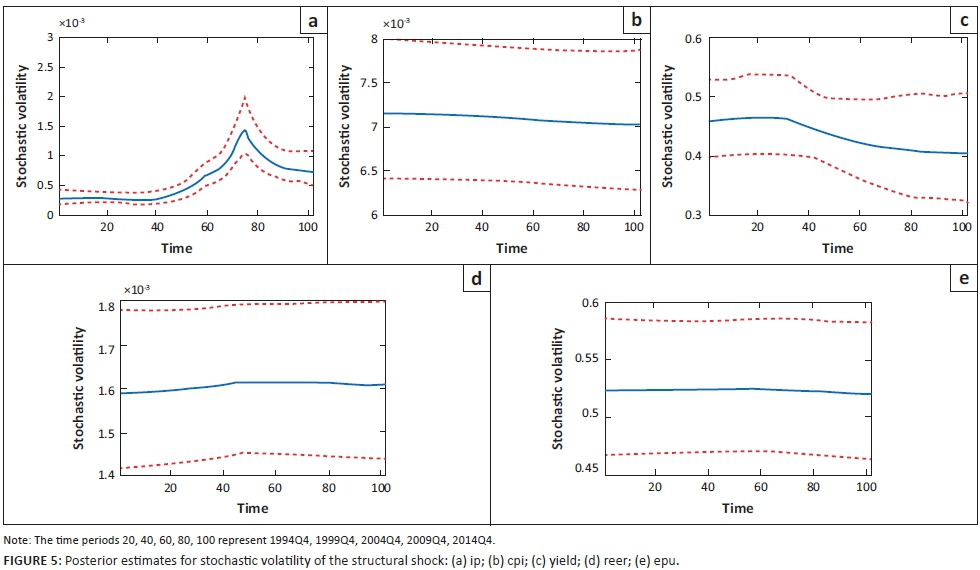
Time-varying volatility
Figure 5 plots the series for estimated stochastic (time-varying) volatility of the structural shock on the five variables specified, based on the posterior mean (solid line) and 95% credible intervals (dotted line). The time-series plots consist of posterior draws on each date, presenting the dynamics of volatility over time, which differ across variables. Stochastic volatility of industrial production (ip) remained low and stable in the period before 1999 before increasing and peaking around the 2008-2009 period of the global financial crisis. The higher volatility of industrial production was mainly as a result of manufacturing production which was hit hard by the global economic crisis, and the industry's subsequent recovery has been insufficient for the volume of manufacturing production to return to its pre-crisis level. The time-varying volatility of industrial production declined following the crisis period and stabilised at levels above the pre-crisis period, due mainly to the severe social unrest within the mining sector and energy issues. Stochastic volatility of inflation (cpi) and the EPU (epu) index display moderate movements over the period with inflation volatility showing a very gradual downward trend (specifically following the formal introduction of inflation targeting in February 2000) and the volatility of the uncertainty index remaining fairly flat overall. The REER exhibited a moderate increase in volatility since the emerging markets crisis in 1998 after which successive speculative attacks pushed it to its low of 2001. Local factors such as increasing debt, sociopolitical unrest, and energy issues, as well as global events, such as the global financial crisis and Eurozone crisis, kept the stochastic volatility of the REER at a slightly elevated level post 2001-2002. Stochastic volatility of 10-year government bond yield (yield) was at its highest level around the period 1998 amid the emerging markets crisis, before moderating gradually and remaining fairly stable during the crisis period of 2008-2009 and 2012.
Overall, stochastic volatility contributes to the VAR estimation, identifying the structural shock with the appropriate variance of the shock size. In this case, the time-invariant VAR model estimates would result in biases in the error covariance matrix and the autoregressive coefficients because of misspecification of the dynamics of the parameters.
Time-varying impulse responses
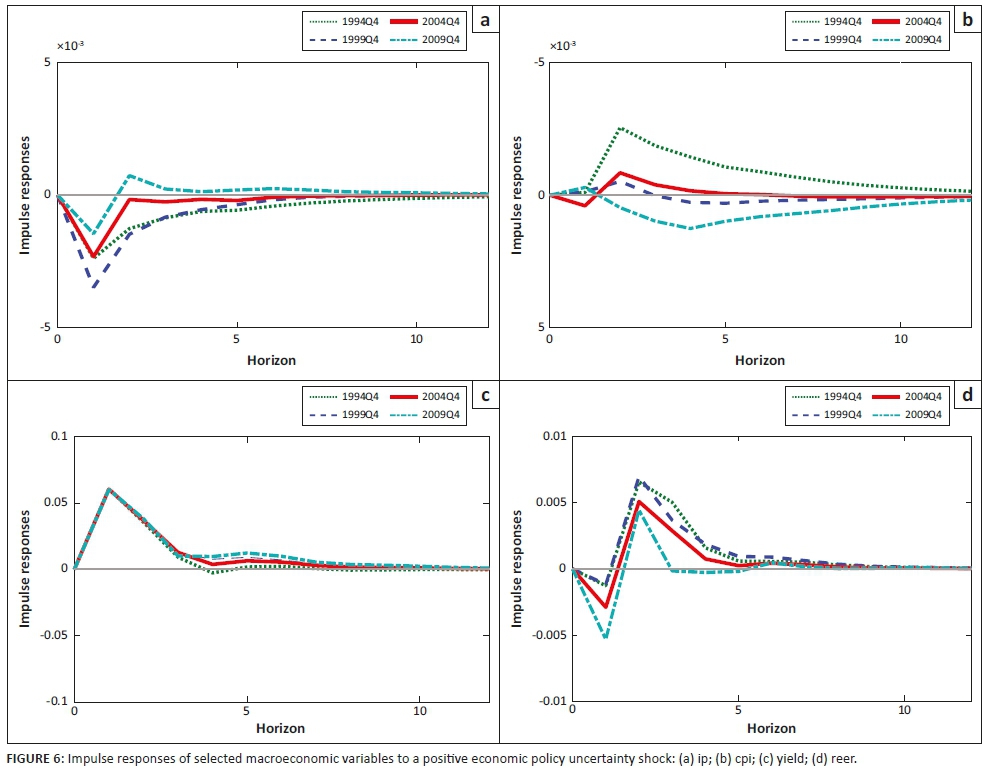
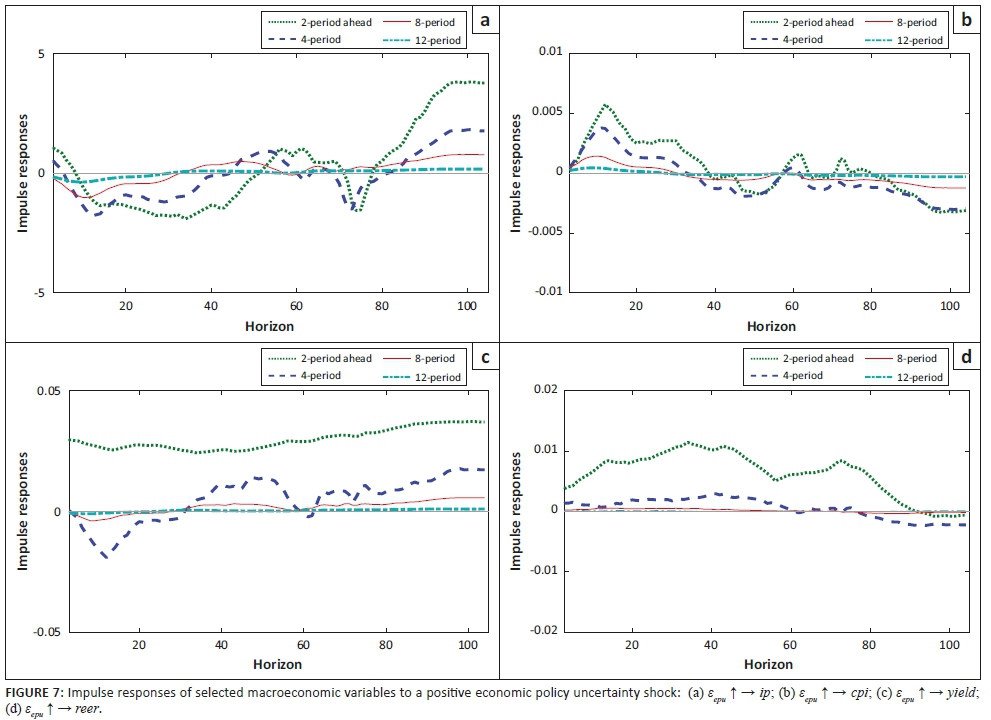
The impulse response analyses for the times series in the TVP VAR model specified above are provided in Figure 6 and Figure 7. Since the coefficients are time varying, the impulse responses are calculated at each date over the sample period. However, in my study I arbitrarily present the responses of industrial production (ip), inflation (cpi), 10-year government bond yield (yield), and REER (reer) to an unanticipated shock to the uncertainty index (epu) for the dates 1994Q4, 1999Q4, 2004Q4 and 2009Q4 (Figure 6). These periods inadvertently coincide with the rise of democracy in SA, the period between the East Asian financial crisis and the dotcom bubble bursting, the general elections and large capital inflows in SA, and the global financial crisis. Figure 7 presents the impulse responses of the macroeconomic variables for 2, 4, 8 and 12 period ahead, following an unanticipated shock to the EPU index. Considering the comparability over time, the impulse responses (based on parameter estimates of the TVP VAR model) are computed by setting the shock size for the responses equal to the time-series average of the stochastic volatility for each series over the sample period.
Figure 6 shows that the impact of the uncertainty index upon the selected macroeconomic variables seems to exhibit time variation, with the exception of the less pronounced time-varying impact of 10-year government bond yield. The uncertainty shock has a negative effect on industrial production, with the impact being much more pronounced in the 1990s. International sanctions in the early 1990s ensured SA's isolation from international markets and the period was characterised by one of the longest recessions in the country's history which lasted from 1989 to 1993, thus demand was restrained in these periods and beyond. The period around 1999Q4 represents the typical economic conditions after the East Asian economic crisis when countries in East Asia experienced substantial currency devaluations but the rand was largely unaffected by turbulence in these markets, resulting in SA's manufactured exports being less competitive, adversely impacting on industrial production. Industrial production responded much more strongly to an increase in uncertainty during 2004Q4 than 2009Q4. The low interest rates in the West and rising commodity prices (due to Chinese industrialisation) supported the rand in the 2004 period, but impacted negatively upon SA's competitiveness and hence production in the mining and manufacturing sector were restrained.
Industrial production at the end of 2009 was supported by the collapse of the rand and commodity prices emanating from the global financial crisis. The response of inflation to uncertainty has time variation and the impact of the response is initially negative in 2004Q4 (subdued external demand), while demonstrating slight inflationary pressure in the comparative periods. Thereafter, inflationary impact turned negative during 2009, amid the subdued domestic and global demand inflicted by the financial crisis, and turned positive by varying magnitudes in the other periods investigated. A 10-year government bond yield does not exhibit much time variation in response to an uncertainty shock, with the magnitude of the positive response of the yield following an unanticipated shock to uncertainty being more or less the same for the comparative periods. A positive shock to uncertainty is associated with an initial decline in the REER in all the comparative periods. However, the magnitude of the response differs across the periods, with the 2009Q4 period of the financial crisis displaying a more pronounced decline. Thereafter, the REER increases later on in the comparative periods, displaying varying magnitudes, before moderating to equilibrium.
Overall, the impact of uncertainty shocks on industrial production, the REER and the price level has moderated slightly over time (with the timing of the change in the price level coinciding with the introduction of inflation targeting in the economy), while the impact on the bond yield has remained fairly stable.
Figure 7 shows that the impact of the uncertainty index upon the selected macroeconomic variables is more pronounced after two quarters following the unanticipated shock. This impact seems to be less pronounced after four quarters, and more or less flattens out after 8 and 12 quarters. The initial response of industrial production and inflation is the same as in Figure 6, as following a shock to the uncertainty index, industrial production declines while the CPI index increases. Industrial production tends to rebound significantly after the 80th forecast horizon for each of the periods specified. The general price level shows an overall downward trend after around the 40th forecast horizon, remaining below equilibrium for most parts of each period. The direction of impact on the 10-year government bond yield and the REER differs from Figure 6. Figure 7 shows that following an uncertainty shock, 10-year government bond yield experiences a jump and is quite persistent after two quarters, but declines initially after four and eight quarters, before rebounding after the 40th forecast horizon. The jump in the yield after two quarters could be attributed to the high probability of sovereign credit rating downgrades (hence higher borrowing costs for government), as more political uncertainty plagues the economy. The REER initially increases after two quarters, but remains rather flat for the remainder of the periods, following an anticipated uncertainty shock. The 2 period ahead response of the REER declines and reverts to equilibrium after the 80th forecast horizon.
Table 2 shows the respective macroeconomic variable elasticities at the 10th period forecast horizon for the 2, 4, 8 and 12 quarters ahead responses, following a 1% shock to the uncertainty index. A 1% unanticipated shock to the uncertainty index in the current period is expected to result in a 0.19% decline in industrial production, 0.5% increase in the general price level, 0.025% increase in the yield on 10-year government bonds, and 1% increase in the REER, after two quarters. This suggests that the responsiveness of the selected macroeconomic variables to an unanticipated uncertainty shock is inelastic, with the exception of the REER which shows an initial unit elastic response.
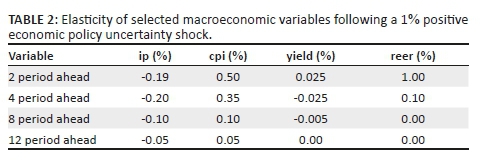
The elasticities, especially for the 4, 8 12 period ahead, suggest that the CPI index appears to be more sensitive to uncertainty shocks compared to the other macroeconomic variables analysed. The elasticities of the macroeconomic variables to the 1% unanticipated EPU shock diminishes by quarter 12. Overall, Figure 7 and Table 2 show that the impact of uncertainty shocks on the macroeconomic variables declines over time, following an initial EPU shock. This result is perhaps intuitive, given that the new information (initial unanticipated shock) is gradually picked up by the media over time, and hence the unanticipated shock will have less of an impact over the long term, as rational agents incorporate the new information into their decision-making.
Concluding remarks
The contribution of my article to emerging market empirical literature is twofold. Firstly, it extends the evidence that uncertainty shocks result in drops in real activity in developing countries, in this case the South African economy. Secondly, it provides evidence of the time-varying impact of EPU shocks on the macroeconomic dynamics of the South African economy, by allowing for both the coefficients and the variance of structural shock to vary over time.
The constant parameter VAR model shows that an unanticipated positive shock to the uncertainty index is associated with a decline in industrial production and REER, while fostering an increase in the general price level and 10-year government bond yield. The TVP VAR model reports posterior estimates for stochastic volatility of the structural shock, displaying the dynamics of volatility over time, which differ across variables. In this case, the estimates of the constant parameter VAR model would result in biases in the covariance matrix for the disturbances and at the same time in the autoregressive coefficients because of the misspecification of the dynamics of the parameters. The time-varying impulse responses for the specified dates (1994Q4, 1999Q4, 2004Q4 and 2009Q4) show that the impact of uncertainty shocks on industrial production, the REER and the price level has moderated slightly over time (with the timing of the change of the price level coinciding with the introduction of inflation targeting in the economy), while the impact on the bond yield has remained fairly stable. Meanwhile, the time-varying impulse responses and associated elasticities of the macroeconomic variables for 2, 4, 8 and 12 period ahead show a diminishing impact over time, following an unanticipated shock to the EPU index. This is perhaps intuitive, as the new unanticipated information is gradually picked up by media and incorporated into rational agents' decision-making.
Acknowledgements
I would like to thank Professor Nicola Viegi for his supervisory support.
Competing interests
The author has declared that no competing interest exist.
Author's contributions
The author contributed wholly to the acquisition of data, analysis and interpretation of findings.
Funding information
This research received no specific grant from any funding agency in the public, commercial, or not-for-profit sectors.
Ethical considerations
Ethical clearance was not required for the study.
Data availability statement
Data sharing is not applicable to this article as no new data were created or analysed in this study.
Disclaimer
The views and opinions expressed in this article are those of the authors and do not necessarily reflect the views of the University of Pretoria.
References
Alessandri, P. & Mumtaz, H., 2014, Financial regimes and uncertainty shocks, Working Paper 729, Queen Mary University of London, viewed 15 July 2017, from http://www.econ.qmul.ac.uk/media/econ/research/workingpapers/2014/items/wp729.pdf. [ Links ]
Arellano, C., Bai, Y. & Kehoe, P.J., 2016, Financial frictions and fluctuations in volatility, Federal Reserve Bank of Minnesota Research Department Staff Report, viewed 13 July 2017, from https://www.minneapolisfed.org/research/sr/sr466.pdf. [ Links ]
Baker, S.R., Bloom, N. & Davis, S.J., 2016, 'Measuring economic policy uncertainty', The Quarterly Journal of Economics 131(4), 1593-1636. https://doi.org/10.1093/qje/qjw024 [ Links ]
Baker, S.R., Bloom, N. & Davis, S.J., 2013, Measuring economic policy uncertainty, viewed 23 February 2017, from http://jrc.princeton.edu/sites/jrc/files/jrcppf_2013_-_bloom_-_paper.pdf. [ Links ]
Benati, L., 2014, Economic policy uncertainty and the great recession, Mimeo, viewed 18 July 2017, from http://www.policyuncertainty.com/media/Uncertainty_Benati.pdf. [ Links ]
Bianchi, F., Ilut, C.L. & Schneider, M., 2017, Uncertainty shocks, asset supply and pricing over the business cycle, Working Paper 20081, National Bureau of Economic Research, viewed 14 July 2017, from http://www.nber.org/papers/w20081. [ Links ]
Bloom, N., 2009, 'The impact of uncertainty shocks', Econometrica 77(3), 623-685, viewed 21 March 2017, from http://www.jstor.org.uplib.idm.oclc.org/stable/40263840. [ Links ]
Bloom, N., 2014, 'Fluctuations in uncertainty', Journal of Economic Perspectives 28(2), 153-176, viewed 12 July 2017, from http://pubs.aeaweb.org/doi/pdfplus/10.1257/jep.28.2.153. [ Links ]
Bloom, N., Baker, S.R. & Davis, S.J., 2015, Measuring economic policy uncertainty, Working Paper 21633, National Bureau of Economic Research, viewed 13 July 2017, from http://www.nber.org/papers/w21633. [ Links ]
Caldara, D., Fuentes-Albero, C., Gilchrist, S. & ZakrajEK, E., 2013, On the identification of financial and uncertainty shocks, Mimeo, viewed 13 July 2017, from https://www.economicdynamics.org/meetpapers/2013/paper_965.pdf. [ Links ]
Christiano, L., Motto, R. & Rostagno, M., 2013, Risk shocks, Working Paper 18682, National Bureau of Economic Research, viewed 13 July 2017, from http://www.nber.org/papers/w18682. [ Links ]
Gupta, R., Bonga-Bonga, L. & Jooste, C., 2015, The macroeconomic effects of uncertainty shocks in India, University of Pretoria, Institutional Repository, viewed 20 April 2017, from http://www.up.ac.za/media/shared/61/WP/wp_2015_16.zp50195.pdf. [ Links ]
Geweke, J., 1992, 'Evaluating the accuracy of sampling-based approaches to calculating posterior moments', in J.M. Bernardo, J. O. Berger, A.P. Dawid & A.F.M. Smith (eds.), Bayesian statistics 4, pp. 169-193, Oxford University Press, New York, viewed 18 July 2017, from http://www.ets.org/Media/Research/pdf/RR-03-07-Sinharay.pdf. [ Links ]
Hlatshwayo, S. & Saxegaard, M., 2016, The consequences of policy uncertainty: Disconnects and dilutions in the South African real effective exchange rate-export relationship, IMF Working Paper No. 16/113, viewed 09 February 2017, from https://www.imf.org/external/pubs/ft/wp/2016/wp16113.pdf. [ Links ]
International Monetary Fund (IMF), 2017, World economic outlook, October, Seeking Sustainable Growth: Short-Term Recovery, Long-Term Challenges, viewed 10 November 2017, from https://www.imf.org/en/Publications/WEO/Issues/2017/09/19/world-economic-outlook-october-2017. [ Links ]
Leduc, S. & Liu, Z., 2015, Uncertainty shocks are aggregate demand shocks, Working Paper 2012-10, Federal Reserve Bank of San Francisco, viewed 14 July 2017, from http://www.frbsf.org/publications/economics/papers/2012/wp12-10bk.pdf. [ Links ]
Mumtaz, H., 2016, 'The evolving transmission of uncertainty shocks in the United Kingdom', Econometrics 4(1), viewed 18 July 2017, from www.mdpi.com/2225-1146/4/1/16/pdf. [ Links ]
Mumtaz, H. & Theodoridis, K., 2014, The changing transmission of uncertainty shocks in the US: An empirical analysis, Working Paper 735, Queen Mary University of London, viewed 07 May 2017, from http://www.econ.qmul.ac.uk/media/econ/research/workingpapers/2014/items/wp735.pdf. [ Links ]
Nakajima, J., 2011, Time-varying parameter VAR model with stochastic volatility: An overview of methodology and empirical applications, Monetary and Economic Studies, Bank of Japan, viewed 04 July 2017, from http://www.imes.boj.or.jp/research/papers/english/11-E-09.pdf. [ Links ]
Primiceri, G.E., 2005, 'Time varying structural vector auto regressions and monetary policy', Review of Economic Studies 72, 821-852, viewed 04 July 2017, from http://faculty.wcas.northwestern.edu/~gep575/tvsvar_final_july_04.pdf. [ Links ]
Redl, C., 2015, Macroeconomic uncertainty in South Africa, ERSA Working Paper. (No. 509), viewed 23 February 2017, from https://econrsa.org/system/files/publications/working_papers/working_paper_509.pdf. [ Links ]
 Correspondence:
Theshne Kisten
theshnekisten@gmail.com
Received: 15 Aug. 2019
Accepted: 06 Nov. 2019
Published: 18 Feb. 2020
1 . The EPU index constructed by Sandile Hlatshwayo can be obtained from her website at https://sites.google.com/site/sandile1984hlatshwayo/research.
2 . See appendix for list of variables used and their associated sources (Table A1.1), as well as graphical representation of the variables used in the analysis (Figure A1.1).
3 . See appendix for results of Augmented Dickey Fuller unit root test for stationarity of variables (Table A1.2), lag length criterion test (Table A1.3), residuals diagnostic tests (Tables A1.4-A1.6) and stability test (Figure A1.2).
4 . Primiceri (2005) proposed TVP VAR with stochastic volatility to analyse macroeconomic issues. The assumption of stochastic volatility in the TVP VAR model avoids misspecification, as not accounting for possible variation of the volatility in disturbances can lead to biased time-varying coefficients. See also Nakajima (2011) for an application of this methodology to the Japanese economy.
5 . See Nakajima (2011) for details of Bayesian inference and MCMC sampling method.
6 . MCMC algorithm sampling the posterior distribution π(β, a, h, ω | Z) (where  and ω = (Σβ, Σa, Σh,) employed here and the details of the procedure can be found in Nakajima (2011).
7 . CD statistic computed as  , where n0 and n1 represent the first and last draws respectively,
  is the i-th draw, and
  is the standard error o f
  for j = 0,1. As in Nakajima (2011), mo = 1, m1 = 5001, n0 = 1000, n1 = 5000,
8 . The inefficiency factor is used to judge how well the MCMC chain mixes and is computed as  , where ρk is the k th autocorrelation of the chain, and bandwidth Bm = 500. An inefficiency factor equal to m necessitates one to draw m times as many MCMC sample as uncorrelated samples.
Appendix 1
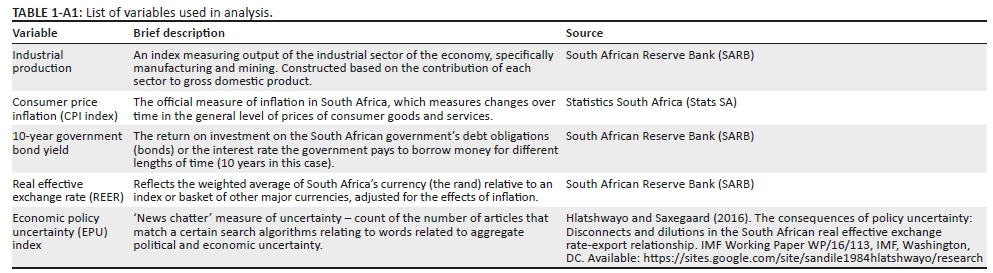
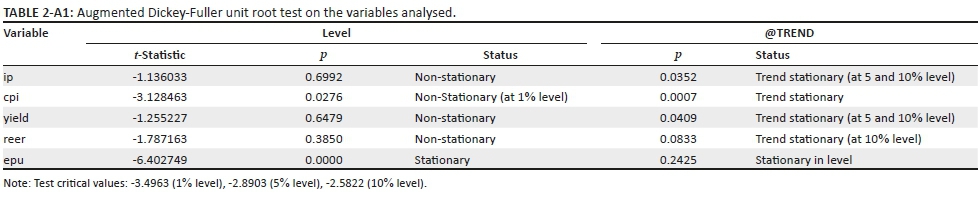
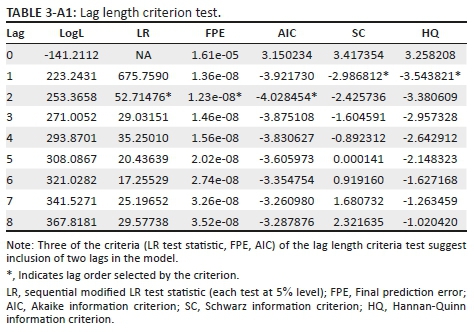
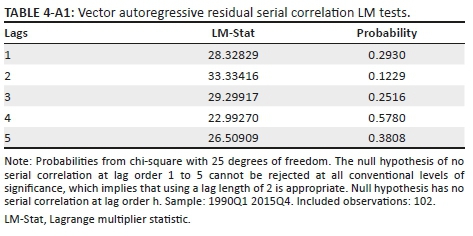
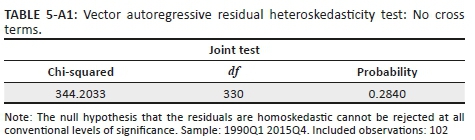
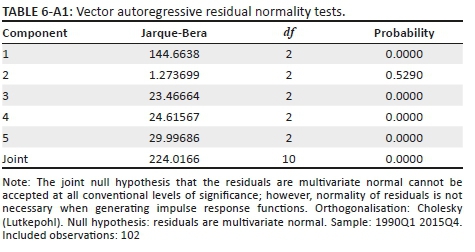

Figure A1.1 - Click to enlarge

