


Services on Demand
Article
 English (pdf)
 Article in xml format
 Article references
Indicators

Related links
-
 Cited by Google
 -
 Similars in Google
Share

 Permalink
South African Journal of Economic and Management Sciences
On-line version ISSN 2222-3436
Print version ISSN 1015-8812
S. Afr. j. econ. manag. sci. vol.22 n.1 Pretoria 2019
http://dx.doi.org/10.4102/sajems.v22i1.2817
ORIGINAL RESEARCH
Tax revenue mobilisation: Estimates of South Africa's personal income tax gap
Chengetai Dare; Sophia du Plessis; Ada Jansen
Department of Economics, Faculty of Economic and Management Sciences, Stellenbosch University, Stellenbosch, South Africa
ABSTRACT
BACKGROUND: Tax evasion is one of the factors impeding tax revenue mobilisation. Although there are efforts to reduce non-compliance, the extent and nature thereof remain fairly unknown in many developing countries, including South Africa. To adequately address tax evasion, it is imperative to determine the tax gap (i.e. the difference between the theoretical tax liability and the actual tax revenue collected
AIM: To estimate the extent and nature of South Africa's personal income tax gap, disaggregating the gap by the type of income (salaried and non-salaried
SETTING: The study looks at the South African personal income tax system
METHODS: This study employs a micro-simulation approach using data from the Income and Expenditure Survey of South Africa for the periods 2005/2006 and 2010/2011
RESULTS: The findings reveal that South Africa lost tax revenue of R60.1 billion in 2005/2006, and R26.2 bn in 2010/2011 (in 2017 prices). Of the total compliance gap in 2005, 28.5% emanated from taxpayers with salaried income, and 71.5% from non-salaried income taxpayers. In 2010, salaried income taxpayers contributed 1.1% to the total compliance gap
CONCLUSION: Despite an overall improvement in the individual compliance rate, non-salaried income taxpayers (self-assessment reporting) are the main contributors to South Africa's personal income tax gap
Keywords: Tax gap; non-compliance; tax evasion; personal income tax; micro-simulation; salaried income; non-salaried income.
Introduction
Tax revenue plays an integral role in the fiscal space to ensure the provision of public goods and services. Indeed, it is a major source of public revenue for most countries including South Africa. Tax revenues also finance redistribution initiatives. Hence, an efficient tax system is a precursor for inclusive and sustainable growth. While taxes are crucial to mobilise public revenue, they generally place a burden on taxpayers. The behavioural response of taxpayers reflects in attempts to evade and avoid taxes, which lead to significant losses of revenue. For example, the US lost $450 billion worth of tax revenue in 2006 (Gemmell & Hasseldine 2012:4); the UK, £34 billion ($41.5 billion) in 2014 (Whicker & White 2015:4), while Pakistan lost Rs397.4 billion ($4.2 billion) in 2005 (Ahmed & Rider 2013:336). Even though efforts to improve tax compliance are mounting, the extent of taxpayers' non-compliance (or the tax gap) and the nature thereof remain fairly unknown in many (developing) countries. For South Africa, it is only the value added tax (VAT) gap that has so far been established (see Ueda & Thackray 2015). Less attention has been given to the tax gap in respect of personal income tax1.
There are basically two broad categories of the tax gap, the compliance gap and the policy gap. The compliance gap refers to the amount forgone by the authorities due to compliance-related issues (Ahmed & Rider 2013:335). In contrast, the policy gap captures the amount of revenue forgone by the government due to the impact of the policy (Toro et al. 2013:11). The International Monetary Fund (2015:3) refers to the policy gap as the difference between theoretical revenue, given a hypothetical policy framework and potential revenue, given the current policy framework. Knowledge about the extent and scope of the tax gap is a useful first step towards controlling non-compliance and preventing its occurrence (European Commission 2016:13). For instance, it may serve as a tool to measure the effectiveness of a tax policy. It may also serve as a measure of administrative efficiency, as a higher tax gap may indicate poor administrative performance. Tax gap estimates can provide information on the sources of the tax losses, which may assist in enforcing compliance more effectively. Considering fiscal constraints in South Africa, knowledge on the extent and nature of the tax gap will aid authorities to raise additional revenue. It is against this backdrop that this study estimates South Africa's personal income tax (PIT) gap (compliance gap and policy gap), with a particular focus on the sources of the tax gap (i.e. its composition by type of income).
The remainder of the article is organised as follows: the next section gives an overview of South Africa's PIT system. Section 'Defining the tax gap' defines the tax gap and section 'Tax gap methodologies' explains various approaches to estimate the tax gap. Section 'Calculating South Africa's personal income tax gap' reviews some empirical application of these approaches. The PIT gap is then calculated, and the results discussed in section 'Findings and discussion'. Section 'Conclusions' concludes this article.
Personal income tax in the South African tax system
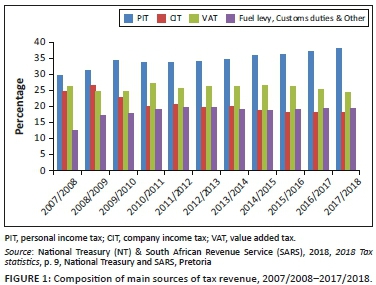
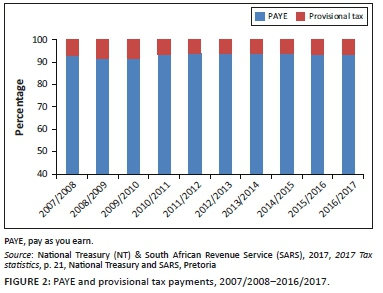
Tax revenues finance approximately 87% of South Africa's national budget, the bulk of which comprises PIT, which contributes over 30% of the total tax revenue (see Figure 1). PIT is applied using a progressive structure, with the highest marginal tax rate for the 2018 fiscal year set at 45% (National Treasury 2019:193). Most individuals receive their income in the form of wages or salaries, annuity payments or pensions, and investment income (National Treasury [NT] & South African Revenue Service [SARS] 2018:31). Hence, PIT paid stems from salaried or non-salaried income. Employees' income tax liabilities are calculated on employees' salaried income and are withheld by the employer (PAYE). Thus, settlement of income tax liabilities on remuneration income is done through third-party reporting. This mechanism is credited for minimising non-compliance since employers have little incentive to under-report employees' taxes (Paulus 2015:9). PAYE contributes over 90% of the total PIT revenue.
Unlike salaried income, non-salaried income earners pay taxes through the method of provisional tax payment. This method allows the taxpayer to pay income tax across the relevant assessment year, as two advance payments are expected, with a possible third payment at the end of the tax year, if required (South African Revenue Service [SARS] 2018). Non-salaried income earners are suspected to be the main source of non-compliance within the South African PIT system (see Marcus 2007:156). In South Africa provisional taxes constitute on average 7% of the total PIT collections. Figure 2 shows the trend of PAYE and provisional tax payments for the period 2007/2008 to 2016/2017.
Defining the tax gap
Taxpayers tend to adopt measures that reduce their tax liabilities. For instance, taxpayers take advantage of legal loopholes within the tax system to reduce their tax liabilities, a phenomenon called tax avoidance. On the other hand, taxpayers may, in contravention of the law, intentionally under-report their taxable income - an act referred to as tax evasion. Tax evasion includes under-reporting taxable income, overstating deductions, and late and non-filing of tax returns (Gcabo & Robinson 2007:358). In some instances, governments may introduce tax expenditures (e.g. exemptions, special credits, rebates and preferential tax rates) to reduce taxpayers' liabilities, to better align the income tax with the ability to pay principle. All these measures reduce the tax liabilities, which reduce the revenue yield below its potential which creates a tax gap (Alm & Martinez 2003:1). As outlined previously, the tax gap is the difference between the potential tax revenue and the actual collections, where potential revenue is the amount of tax that the government should collect if every taxpayer complies with the tax legislation (Toro et al. 2013:14). It is classified into the compliance gap and the policy gap: the former denotes the value of revenue losses due to the impact of compliance-related issues (such as deliberate evasion, tax losses due to taxpayers' misunderstanding of tax legislation, tax authorities' poor record-keeping and other errors; Ahmed & Rider 2013:335). The policy gap reflects the amount of revenue forgone by the government due to the impact of the policy (Toro et al. 2013:11), and includes tax forgone due to tax avoidance and tax expenditures. Put succinctly, the policy gap is just a normalised measure of tax expenditures (Keen 2013:436).
Tax gap methodologies
There are broadly two approaches to measure the tax gap, namely the top-down and the bottom-up approaches. The top-down (or macro-) approach relies on macro-economic data and the theoretical (or potential) tax liability is calculated from a single estimate of the tax base (Rubin 2011:109). Toro et al. (2013:33) indicate that to estimate reliable tax estimates using this approach, data must be representative enough of the tax base, and it must be derived from sources other than taxpayers' records. The advantage of such data is the independence from intentional misreporting by taxpayers. Other benefits of this approach include its simplicity, and the timeous release (or production) of national data, which allows for the release of timely estimates.
Despite these strengths, the top-down approach has two fundamental shortcomings. Firstly, it provides a single broad estimate of the tax gap, thereby providing little insight into the nature and causes of the tax gap. More precisely, the top-down approach is not capable of estimating the tax gap by its components. Such an estimate does not adequately capacitate the government to assess its performance in the collection of revenue and provides little guidance on how to reduce the tax gap. In fact, tax gap estimates from the macro-approach provide little insight into how to improve compliance.
To circumvent the shortcomings of the top-down approach, many researchers prefer the bottom-up approach (micro-approach), which uses individual-level (i.e. (micro-) data to determine the tax gap. This approach 'does not depend on the value of a single estimate of the tax base' (Rubin 2011:111), neither does it rely on macro-economic data (Fuest & Riedel 2009:20), but uses data obtained from tax audit records and surveys. The main advantage of this technique is that it establishes the tax gap by its components (i.e. by type of income, sector of the economy and in some instances, by the causes of the gap) (see Ahmed & Rider 2013:340-343).
Calculating South Africa's personal income tax gap
A bottom-up approach is employed to estimate South Africa's personal income tax gap. For a reliable estimate of the potential tax liability, an objective measure of the tax base is required (Ahmed & Rider 2013:339-340). It is in this regard that survey micro-data, that is nationally representative, are most ideal for estimating the personal income tax gap. However, such data are susceptible to under-reporting, especially with regard to high income earners. This is generally because people (particularly high income earners), prefer their income worth to be a secret (see Ahmed & Rider 2013:343).
Data and methodology
Following the methodology of Ahmed and Rider (2013), this study uses the Income and Expenditure Survey (IES) data of the 2005/2006 and 2010/2011 surveys to estimate South Africa's personal income tax gap. Statistics South Africa (StatsSA) conducts the IESs every 5 years and its primary task is to capture household consumption data to update the consumer price index (StatsSA 2012:1). The 2005/2006 and 2010/2011 data sets include samples of 21 144 and 25 328 households respectively, collected nationwide (Stats SA 2008, 2012). The study is limited to these two data sets as they used the same data collection methods (i.e. the diary and recall methods), and both surveys used the same classification of expenditure items: the Classification of Individual Consumption by Purpose (COICOP).
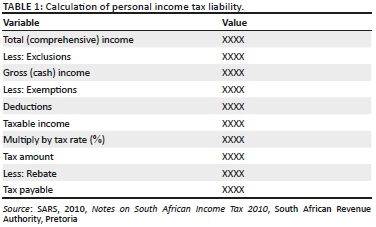
A static micro-simulation model is applied to estimate the PIT gap. This methodology allows us to incorporate the progressive nature of the tax rate structure, a critical aspect in estimating individual tax liabilities. The income tax liability is determined from the taxable income that includes remuneration income, business income, fringe benefits, taxable capital gains, interest and rental income (Black, Calitz & Steenekamp 2015; SARS 2016a). More specifically, to determine the tax liability, exclusions (e.g. in-kind income, unrealised capital gains and imputed rent) are removed from the total comprehensive income to arrive at gross income. Exemptions such as the tax-free portion of income (i.e. amount below taxable threshold), the tax-free portion of interest, and some pension income (e.g. war veteran's pensions and disability pensions) are deducted from the gross income, after which allowable tax deductions (such as pension contributions, medical contributions, depreciation allowances and donations to an approved public benefit organisation) are subtracted from the income balance, to produce the taxable income (Black et al. 2015:256).
The tax due is determined by applying the tax rate schedule to the taxable income. The tax threshold (i.e. the taxable income at which a taxpayer starts to pay taxes) will generate a tax liability equivalent to the rebate (SARS 2016a:9). Table 1 summarises how the tax liability is calculated.
A micro-simulation model is constructed in STATA (software), in line with the tax calculation illustrated in Table 1. Using a tax calculator2, a line by line estimation of the tax liabilities is performed on all positive taxable income. The estimated tax amounts are then grossed up to national levels using household weights, where the weight is an inverse of the household's probability of selection. Grossed up tax liabilities are added together to produce the total amount of tax revenue that the state should collect if every taxpayer complies with the tax legislation.
In this study, the calculation of the PIT gap is carried out in three phases. First, the tax calculator is applied to gross income (income inclusive of tax expenditures, which is a hypothetical policy framework). This gives the amount of tax revenue the state would collect in the absence of tax expenditures such as rebates or deductions for medical expenses. Second, the potential tax liability is calculated from the total taxable income. The discrepancy between these two theoretical tax liabilities (i.e. from the gross income and the total taxable income) gives an estimate of the policy gap. The theoretical tax liability derived from the total taxable income is then compared to the personal income tax collections (obtained from SARS). The difference between the estimated potential tax liability from taxable income and the actual collections represents the compliance gap. Third, the tax calculator is applied to salaried income to estimate the theoretical tax liability for this income source. The estimated potential tax liability is matched against the actual PAYE collections and the difference gives the salaried income tax gap (Ahmed & Rider 2013:340). The theoretical tax liability for non-salaried income is calculated by subtracting the salaried tax liability from the total theoretical tax liability. The estimated potential tax liability for the non-salaried income is then compared with the actual tax collections from provisional taxpayers, and the discrepancy between these two figures is the tax gap in respect of non-salaried income earners. However, it is important to note that the actual collections may not be what is expected for a particular tax period, given that the current year's collections would exclude late payments for the (current) year while including late payments for previous years. Furthermore, as outlined previously, this study uses gross household income, and this could lead to variations in the tax gap estimates (as the tax unit is the individual and not the household). Other causes of variations include the fact that the IES data is not equivalent to the tax year - hence income estimations in the survey data are not equivalent to what one would expect in the tax year associated with the particular survey data set. Given the data constraints, the tax gap estimates from this study remain an approximation of the gap and should be treated as such.
For both tax years (2005/2006 and 2010/2011), the major exemptions and deductions included war veterans' and disability pensions, medical expenses and medical aid contributions, donations to public benefit organisations, pension fund contributions, retirement annuity fund contributions, legal fees, doubtful debts and wear and tear (SARS 2010:220-221). However, war veterans' and disability pensions, donations to public benefit organisations, legal fees, doubtful debts and wear and tear were not used in the study's calculations as they were not captured in the survey data sets. Deductions in respect of pensions and retirement contributions were limited to 7.5% and 15% of the taxable income. However, in both survey data sets, pensions and retirement annuity fund contributions were combined with provident fund contributions, which are not deductible. To separate provident fund contributions, the study assumed that one-third of the combined funds constitutes contributions to the provident fund. The tax calculators for the micro-simulation models were constructed, based on the guidelines for the 2005/2006 and 2010/2011 tax years, in accordance with the Income Tax Return for Individuals (the ITR12).
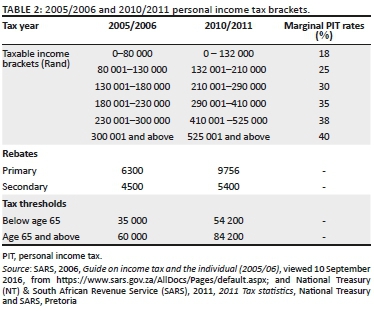
Personal income tax brackets for the 2005/2006 and 2010/2011 tax years are shown in Table 2.
In calculating the taxable income, it is worth mentioning that both the 2005/2006 and 2010/2011 data sets do not reveal how medical expenses were settled. Thus, it is not explicit whether the payment was done by the employer, household member or by a medical aid. The data do, however, reveal that approximately 25% of household income was spent on medical aid contributions. The analysis therefore assumed that 75% of medical expenses were paid by medical aid insurers. Deductions for medical expenses and medical aid contributions' deductions were each limited to R500 and R625 per month in 2005/2006 and 2010/2011. In the event that the medical aid contributions made by the employer exceeded these thresholds, the excess amount was taxed as a fringe benefit. This excess amount is presumed to be a medical expense paid by the employer and, as such, it is deducted from the medical aid contributions made by the employee (SARS 2010:221). However, as outlined previously, this study used household survey data (to proxy individual data), as the data sets do not specify the main member of the fund. Medical deductions were therefore calculated from the household medical contributions, which may overestimate the expenditures.
Below follows a summary of the steps in the micro-simulation model to calculate the potential tax liability. First, it calculates the taxable income (taxY) for every household (i), defined as the difference between gross income (Yi) and deductions (deduci):
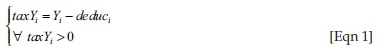
Second, the tax liability (Xi) is calculated by applying the tax rates and rebates to taxable income for the year of assessment:

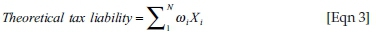
Third, the tax liabilities are grossed up to national levels using household weights (ωi). The grossed up tax liabilities are added together to produce the theoretical tax liability:
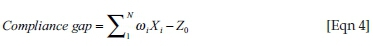
To establish the compliance gap, actual collections (Z0) are subtracted from the theoretical tax liability:
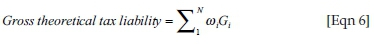
To establish the amount of tax the government would collect in the absence of tax expenditures, the tax liability for each household is calculated by applying the tax rates to the gross income for the year of assessment:

The tax liabilities are grossed up to national levels using household weights (ωi), and added together to produce the gross theoretical tax liability:
The discrepancy between the theoretical tax liability (from taxable income) and gross theoretical tax liability provides the policy gap:
Findings and discussion
In the absence of tax expenditures, the government could collect potential tax revenue of R382.3 billion from individual taxpayers in 2005/2006, and R449.6 billion in 2010/2011. The granting of tax expenditures reduced it to R276.4 billion and R316.6 billion. This implied that the policy gaps (the amount of revenue forgone due to the impact of policy) for the 2005/2006 and 2010/2011 tax years were R105.9 billion and R133 billion. In both years, approximately 30% of PIT revenue remained uncollected due to tax expenditures. Relative to the total PIT gap, it is estimated that the policy gap constituted about 64% in 2005/2006, an estimate that increased to 84% in 2010/2011. These are definitely very large policy gaps, implying that the government has been losing significant amounts of revenue in its effort to reduce taxpayers' burdens.
The authority had the potential of collecting R276.4 billion worth of PIT revenue in 2005/2006. However, only R216.3 billion was collected, producing a compliance gap of R60.1 billion. This implied a compliance rate of 78.3%. The tax revenue forgone (due to non-compliance) is equivalent to 21.7% of the potential tax revenue. In 2011, the government lost R26.2 billion worth of revenue, which is 8.3% of the potential tax revenue. Although this is a commendable improvement from the 2005/2006 tax year, the extent of evasion is still significant.
In 2005/2006, of the R276.4 billion potential PIT revenue, R218.2 billion should have been raised from employed individuals' taxes (i.e. PAYE). However, PAYE collections amounted to R201 billion, implying a PAYE tax gap of R25.6 billion and a compliance rate of 92.1%. In 2010/2011, instead of raising R265.1 billion worth of PAYE, the government managed to collect R264.8 billion and lost R0.3 billion through non-compliance (a 99.9% compliance rate).
The potential tax liability (from taxable income) for provisional taxpayers was found to be R58.2 billion for the 2005/2006 tax year. However, the actual payments totalled R15.3 billion, thus creating a compliance gap of R42.9 billion and a compliance rate of 26.3%. In 2010/2011, instead of collecting R51.5 billion from this same group of taxpayers, only R25.6 billion was collected, thus implying a tax gap of R25.9 billion and a compliance rate of 49.7%. Although this is an improvement compared to the 2005/2006 tax year, it is worth noting that over 50% of the non-salaried potential tax revenue remained uncollected in 2010/2011. The tax gap results are depicted in Table 3.
In terms of the composition of the total PIT compliance gap, the gap by salaried income contributed 28.5% in 2005/2006, an estimate that declined to 1.1% in 2010/2011. In 2010/2011, and despite a significant improvement in their compliance rate (from 26.3% to 49.7%), the share of the gap emanating from non-salaried income (as a percentage of share of the total tax gap) increased from 71.5% to 98.9%.
The significant improvement in the compliance of salaried individual taxpayers could be ascribed to reforms the tax authorities introduced in the tax system, in particular modernisation initiatives (see SARS 2016b). For instance, SARS introduced an electronic queue management system, the Branch Queue Management System (BQMS) - a system that is meant to improve the administration of queues at branch offices during tax seasons. The BQMS uses 'mobile smart devices to issue tickets to the queuing taxpayers' (SARS 2016b:406). The system reduced the average queuing times by 57% in 2010 (Rasool 2011:34). Furthermore, the tax authority introduced an e-filing facility, which has made the submission and processing of tax returns more efficient. These reforms made it relatively less costly to comply, which motivated taxpayers to oblige with the requirements of the tax legislation. The cost of collecting tax revenue decreased from 1.5% of total revenue in 2005/2006 to 1.1% in 2010/2011 (National Treasury and SARS 2011).
A further initiative that can explain the significant increase in compliance rates of salaried taxpayers is the government's rollout of an Individual Taxpayer Policy Registration programme in 2010, which required all formal employees to be registered as taxpayers regardless of their tax liabilities. The programme led to an increase in the number of individual registrants to 10.3 million in 2010, up from 5.9 million in 2009. This compulsory registration of employees could be one of the main explanatory factors of the significant increase in salaried taxpayers' compliance rates.
Non-salaried taxpayers' compliance can also be attributed to SARS's educational campaigns, strengthened deterrent measures and the 2010 reprieve (the Voluntary Disclosure Programme). The higher non-compliance rate of non-salaried income earners in both years (2005 and 2010) supports the hypothesis that self-reporting of non-salaried income is more prone to non-compliance than salaried income (submitted through third-party reporting). Paulus (2015:9) highlights that because there are fewer incentives for employers to misreport employees' income, employees would have to collude with the employers to evade taxes. Depending on the availability of such opportunities, it is more difficult to evade salaried income tax than non-salaried income tax (Paulus 2015:24). Ahmed and Rider (2013:343) also argue that a withholding tax regime is an effective revenue mobilisation technique.
Conclusion
This study provides some fundamental insights into the performance of South Africa's PIT system. The granting of tax expenditures reduced revenue from R382.3 billion to R276.4 billion in 2015/2006 and from R449.6 billion to R316.6 billion in 2010/2011, creating policy gaps of R105.9 billion and R133 billion. This is approximately 30% of PIT revenue for both years and 64% and 84% of the total PIT gap for 2005/2006 and 2010/2011. These are definitely very large policy gaps, implying that the government has been losing significant amounts of revenue in its effort to reduce taxpayers' burdens. Although tax expenditures play an important role in reducing tax burdens, there is a need to examine the possibility of reducing the policy gap as its reduction may raise a significant amount of revenue.
The authority had the potential of collecting R276.4 billion worth of PIT revenue in 2005/06 and 316.6% in 2010/2011, if everyone complied with the legislation. However, R216.3 billion was collected in 2005/06 and R290.4 billion was collected in 2010/2011, producing compliance gaps of R60.1 billion and R26.2 billion - implying compliance rates of 78.3% and 91.7% in that order. In terms of the composition of the PIT compliance gap, the gap by salaried income constituted 28.5% in 2005/06, an estimate that decreased to 1.1% in 2010/2011, while the balance constituted the gap by non-salaried income. Thus, non-salaried income constituted the bulk of South Africa's PIT compliance gap.
Overall, South Africa has a well-functioning PIT system (with a compliance rate of 91.7%). However, its compliance rate is lower than that observed in developed countries, such as the UK and Sweden where PIT compliance rates are around 95% (see Bäckman 2014; Whicker & White 2015). Apart from having a high PIT compliance rate, South Africa's VAT gap for the period 2007-2012 ranged between 5% and 10% of its potential revenue, which is low by international standards - below that typically observed in European and Latin American countries (Ueda & Thackray 2015:2). This implies that the country has a sound and well-functioning tax system.
It would be even more insightful to compare South Africa's PIT gap with other developing countries'. Unfortunately, knowledge about tax gaps in developing countries is limited (aside from the Pakistan study which reported a compliance PIT gap of 41.1%; [see Ahmed & Rider 2013:339]).
Although the South African tax system has a high compliance rate, further measures are required to stimulate increased compliance of provisional taxpayers. These measures may include formalising the underground economy, further strengthening deterrent measures and building taxpayers' trust in the authorities (i.e. improving citizens' perception of the government).
It would even be more enlightening to estimate the tax gap following the Her Majesty's Revenue and Customs (HMRC) approach, which uses audited data (that correspond to the tax year) made available by the tax authority. However, due to confidentiality of taxpayers' information, such data is not easily accessible for academic research, particularly in South Africa. Given the data constraints, the tax gap estimates from this study remain an approximation of the gap and should be treated as such.
Acknowledgements
We would like to convey our sincere gratitude to Prof. Mark Rider (Georgia State University) for his considerable input in designing the tax simulation model.
Competing interests
The authors have declared that no competing interest exist.
Author's contributions
This article is part of a PhD thesis. C.D. (the student) is the principal author while A.J. and S.d.P. (the supervisors) are co-authors.
Funding
This research received no specific grant from any funding agency in the public, commercial, or not-for-profit sectors.
Data availability statement
Data sharing is not applicable to this article as no new data were created or analysed in this study.
Disclaimer
The views and opinions expressed in this article are those of the authors and do not necessarily reflect the official policy or position of any affiliated agency of the authors.
References
Ahmed, R.A. & Rider, M., 2013, 'Using microdata to estimate Pakistan's tax gap by type of tax', Public Finance Review 41(3), 334-359. https://doi.org/10.1177/1091142113475697 [ Links ]
Alm, J. & Martinez, J., 2003, Institutions, paradigms, and tax evasion in developing and transition countries, Edward Elgar Publishing Ltd, Cheltenham. [ Links ]
Bäckman, J.-E., 2014, The development of the tax gap in Sweden 2007-12, The Swedish Tax Agency, Solna. [ Links ]
Black, P.A., Calitz, E. & Steenekamp, T.J., 2015, Public economics, Oxford University Press, Cape Town. [ Links ]
DTC, 2014, Addressing base erosion and profit shifting in South Africa, viewed 27 June 2016, from http://www.taxcom.org.za/docs/New_Folder/1_DTC_BEPS Interim Report-The_Introductory Report.pdf. [ Links ]
European Commission, 2016, The concept of tax gaps: Report on VAT gap estimations, FISCALIS Tax Gap Project Group (FPG/041), European Commission, Brussels. (FPG/041). [ Links ]
Fuest, C. & Riedel, N., 2009, Tax evasion, tax avoidance and tax expenditures in developing countries: A review of the existing literature, Oxford University Centre. Prepared for the UK Department for International Development (DFID), London. [ Links ]
Gcabo, R. & Robinson, Z., 2007, 'Tax compliance and behavioural response in South Africa: An alternative investigation', SAJEMS NS 10(3), 357-370. https://doi.org/10.4102/sajems.v10i3.695 [ Links ]
Gemmell, N. & Hasseldine, J., 2012, 'The tax gap: A methodological review', Working Papers in Finance 09/12, Victoria University of Wellington. [ Links ]
IMF, 2015, South Africa: Revenue aministration gap analysis program - The value added tax Gap, International Monetary Fund, Washington, DC. [ Links ]
Keen, M., 2013, 'The anatomy of the VAT', National Tax Journal, 66(2), 423-446. http://dx.doi.org/10.17310/ntj.2013.2.06 [ Links ]
Marcus, M., 2007, 'A qualitative and quantitative analysis of the South African tax system (1995-2005)', PhD thesis, University of Cape Town. [ Links ]
National Treasury, 2019, 2019 Budget review, National Treasury, Pretoria. [ Links ]
National Treasury (NT) & South African Revenue Service (SARS), 2011, 2011 Tax statistics, National Treasury and SARS, Pretoria. [ Links ]
National Treasury (NT) & South African Revenue Service (SARS), 2015, 2015 Tax statistics, National Treasury and SARS, Pretoria. [ Links ]
National Treasury (NT) & South African Revenue Service (SARS), 2016, 2016 Tax statistics, National Treasury and SARS, Pretoria. [ Links ]
National Treasury (NT) & South African Revenue Service (SARS), 2017, 2017 Tax statistics, National Treasury and SARS, Pretoria. [ Links ]
National Treasury (NT) & South African Revenue Service (SARS), 2018, 2018 Tax statistics, National Treasury and SARS, Pretoria. [ Links ]
Paulus, A., 2015, 'Income underreporting based on income-expenditure gaps: Survey vs tax records', ISER Working Paper Series. No. 2015-15, Institute for Social and Economic Research, Essex. [ Links ]
Rubin, M., 2011, The practicality of the top-down approach to estimating the direct tax gap, Her Majesty's Revenue and Customs, London. [ Links ]
Rasool, F., 2011, SARS system boosts 'Who am I online', viewed 23 October 2016, from http://www.itweb.co.za/index.php?option=com_content&view=article&id=42048. Income Tax [ Links ]
South African Revenue Service (SARS), 2006, Guide on income tax and the individual (2005/06), viewed 10 September 2016, from https://www.sars.gov.za/AllDocs/Pages/default.aspx. [ Links ]
South African Revenue Service (SARS), 2010, Notes on South African Income Tax 2010, South African Revenue Authority, Pretoria. [ Links ]
South African Revenue Service (SARS), 2016a, Income Tax Guide on Income Tax and the Individual (2015/16), South African Revenue Authority, Pretoria. [ Links ]
South African Revenue Service (SARS), 2016b, 'Implementation of the modernisation programme', in J. Hattingh, J. Roeleveld & C. West (eds.), Income Tax in South Africa: The first 100 years 1914-2014, pp. 404-410, Juta and Company (Pty) Limited, Cape Town. [ Links ]
South African Revenue Service (SARS), 2018, Provisional tax, viewed 20 April 2019, from https://www.sars.gov.za/TaxTypes/PT/Pages/default.aspx. [ Links ]
Stats SA, 2008, Income & expenditure of households 2005/2006. Analysis of results: Report No. 01-00-01, Statistics South Africa, Pretoria. [ Links ]
Stats SA, 2012, Income and expenditure of households 2010/2011, Statistics South Africa, viewed 18 November 2016, from http://www.statssa.gov.za. [ Links ]
Toro, J., Ogata, K., Hutton, E. & Caner, S., 2013, United Kingdom: Assessment of HMRC's tax gap. International Monetary Fund, Washington, DC. (13/314). [ Links ]
Ueda, J. & Thackray, M., 2015, Revenue administration gap analysis program - The value-added tax gap, Fiscal Affairs Department, IMF, Washington, DC. [ Links ]
Whicker, H. & White, A., 2015, Measuring tax gaps 2015 edition: Tax gap estimates for 2013-14, HM Revenue & Customs, London. [ Links ]
 Correspondence:
Chengetai Dare
cdarejam@yahoo.com
Received: 18 Sept. 2018
Accepted: 25 Apr. 2019
Published: 15 July 2019
1. The Davis Committee (a tax review committee appointed by the government), in its 2014 interim report, pointed out that the definite size of the tax gap is unknown to SARS (DTC 2014: 25).
2. The tax calculator is the model designed to calculate (simulate) the tax liabilities.

