


Serviços Personalizados
Artigo
 Inglês (pdf)
 Artigo em XML
 Referências do artigo
Indicadores

Links relacionados
-
 Citado por Google
 -
 Similares em Google
Compartilhar

 Permalink
South African Journal of Economic and Management Sciences
versão On-line ISSN 2222-3436
versão impressa ISSN 1015-8812
S. Afr. j. econ. manag. sci. vol.22 no.1 Pretoria 2019
http://dx.doi.org/10.4102/sajems.v22i1.2390
ORIGINAL RESEARCH
Estimating trade flows between regions of KwaZulu-Natal, South Africa
Clive E. Coetzee; Ewert P.J. Kleynhans
School of Economics, North-West University, Potchefstroom, South Africa
ABSTRACT
BACKGROUND: The enhancement of trade creates employment and wealth and should be promoted. During planning and economic development of a region knowledge regarding the effect of initial actions on the final economic indicators such as total demand, purchases, sales, imports, exports, value addition and employment is indispensable. The specific value of trade flows and the multiplier effects involved, indicating the magnitude of linkages on a local and global level is essential.
AIM: The final and intermediate trade flows between regions of KwaZulu-Natal, South Africa, are investigated in this article
SETTING: The five major regions of KwaZulu-Natal Province.
METHODS: To investigate these spatial linkages, a modified multiregional input-output model was constructed. A survey approach was used to construct the model and involved primary data collected through a specially designed survey.
RESULTS: The results show that Richards Bay and Durban had the highest output multipliers, leading to the largest effect on output and trade flows. It was found that the values of intra-trade of these regions are much higher than the trade between the various urban regions. Durban has a fairly open economy, trading significantly with the other four regions, followed by Pietermaritzburg and Richards Bay. Port Shepstone and Newcastle are relatively closed economies, trading predominantly internally.
CONCLUSION: The results suggest that there is indeed some flows of goods and services between the five regions, both intermediate and final. However, the estimated inter-regional spillovers, as well as feedback effects, seem to be rather limited.
Keywords: Trade flows; inter-regional; input-output; multipliers; economic interdependency.
Introduction
This article investigates the intermediate and final trade flows between the five major regions of the province of KwaZulu-Natal (KZN), South Africa. These five major regions are not autonomous entities operating as closed economies with no movement of goods and services, labour or capital between them and as such it can be argued that to some degree they are mutually dependent on one another. On the other hand, these regional economies are also spatially fairly dispersed, which could lead to spatial isolation or convergence (Coetzee & Kleynhans 2018:221). The extent of the economic correlation interdependence between these five regional economies is therefore very uncertain, with some economic forces supporting greater interdependence, while some are constraints to greater interdependence.
Economic growth and development are low in most parts of the country, especially in some regions of KZN. Many people experience poverty and unemployment, with little hope for the future; for example, the number of discouraged work seekers has increased from 179 000 in March 2008 to 708 000 in December 2016 (Stats SA Labour Force Survey 4th quarter 2016). The enhancement of production and trade is therefore essential, as it creates employment and wealth. In order to achieve this, it is necessary that a clear view of the province's points of strength and challenges are identified with regard to value-added production and trade flows.
Although each of the five regional economies is unique in their own right, they are characterised by a large number of complex and intimate interrelationships between their own markets and markets outside their boundaries. For this reason, a regional economic input-output approach, with its capacity for describing detailed transactions among economic units, is especially well suited to the analysis of the economic interdependence between the five main regional economies. Essentially, input-output is a method of tracing and using information about transactions between buyers and sellers (Hirsch 1973), but can also be modelled to show the flows of transactions between firms of specific and various other regions (Schaffer 1999).
To determine trade flows of the province, this study measures the extent of the economic interdependency between the five regional economies by constructing an inter-regional input-output (IRIO) table that links the five regional economies of KZN, using the Chenery-Moses model, with data from the annual regional economic business confidence surveys that have been conducted since 2005. The survey contains questions relating to the proportion of products and services by businesses in a particular regional economy sold to other regional economies.
The study firstly explores important economic characteristics of the five regional economies. Then, the design of the regional input-output table and how it illustrates trade flows is explained. Furthermore, an input-output model is developed incorporating inter-regional spillover and feedback effects. Next, the multiregional input-output model (MRIO) is constructed and the regional economic multipliers are estimated. Finally, the MRIO model is applied using elementary examples, and deductions are made.
Economic characteristics of the five regional economies
The five regional economies of KZN represent the major urban or municipal regions of the province. These regions are Durban, which constitutes the provincial centre of economic activity, with South Africa's largest harbour. The Durban harbour is also the largest harbour in sub-Saharan Africa (African Business Central 2015). Second largest is Pietermaritzburg, capital of KZN, followed by Richards Bay, the manufacturing centre, with the largest coal export terminal globally and large aluminium smelters. The whole of KZN is renowned for its tourist attractions and scenic beauty. There are 21 beaches in the urban region of Port Shepstone, covering a coastline of 90 km2. Finally, the Newcastle region has very large coal resources and agricultural land.
These five regional economies dominate the economic landscape of the province, entailing approximately 55% of the provincial population, producing approximately 80% of the provincial gross domestic product (GDP), and income per capita exceeds twice that of the rest of the province. Space filled by new business and financial institutions, retail and warehouses and industries of these five regions account for approximately 93%, 86% and 78% (2001-2008). These five regions cover only 8.5% of the total provincial land, but compared to the whole province, the poverty levels are almost half, and the population density in these regions exceeds the rest 12 times (Global Insight 2018; Stats SA 2018).
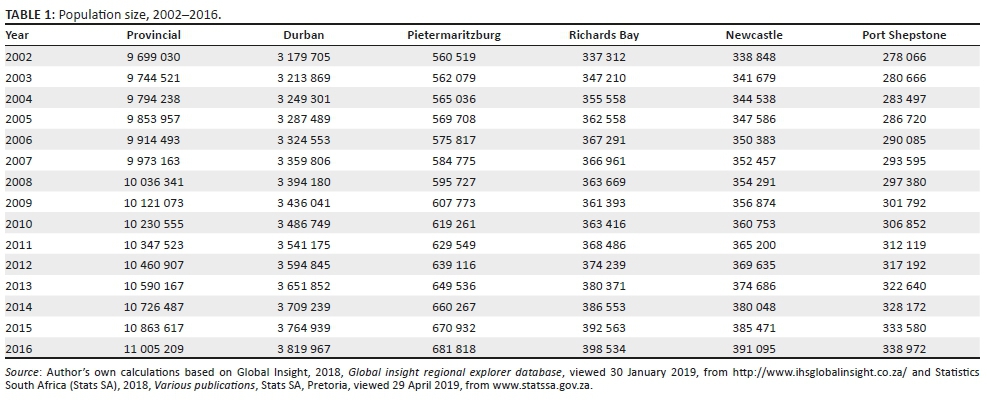
These five regions also differ significantly in terms of their population size, especially when compared to Durban (see Table 1). Table 2 displays the annual average contribution rates for each economic sector as a percentage of their total gross geographical product for each of the five regions compared to the national and provincial economies (2002-2016). The structural differences are fairly evident; for example, Richards Bay and Newcastle are 'production' economies (manufacturing accounts for around 39% and 31% of their economies), while Pietermaritzburg and Port Shepstone are 'consumer' economies (tertiary sectors account for around 68% and 62% of their economies). Durban has a much more diversified economy (fairly evenly balanced between the three primary economic sectors), quite similar to the national economy.
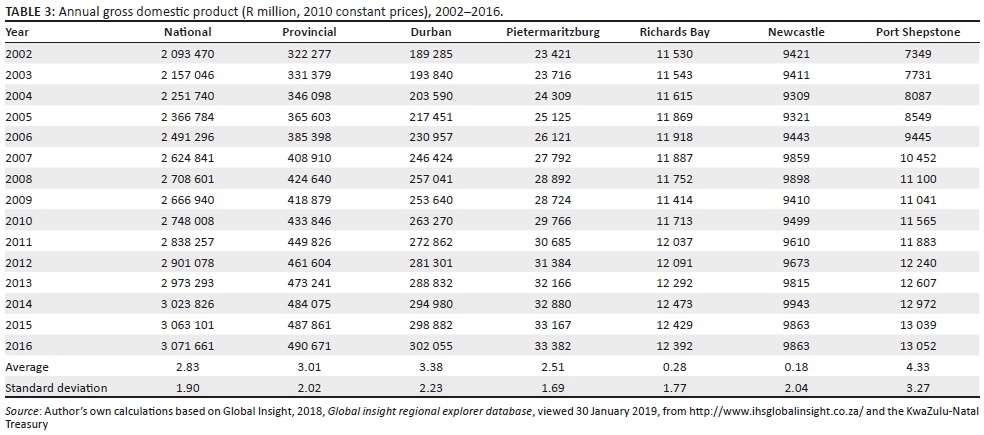
The gross geographical product and economic growth rates of the five regions fluctuate much (measuring gross geographic product [GGP] at million rand 2010 constant prices, where 'rand' is the South Africa currency). Table 3 displays the annual GGP and average economic growth rate of each of the regions and the national and provincial economies. The differences in total economic output are very large and substantial, although the economic growth rate disparities are marginal. It is also noticeable that the regional economic growth rates have been much more volatile (as reflected by the standard deviation statistics) than the national and provincial growth rates, with the exception of Pietermaritzburg and Richards Bay.
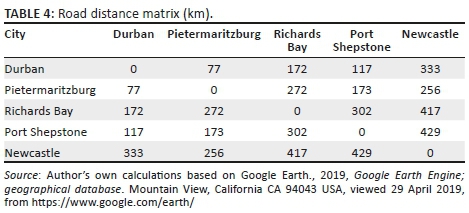
With regard to spatial distribution, Table 4 indicates the road distance (kilometre) between the five cities. Durban and Pietermaritzburg are closest to each other, while Newcastle and Port Shepstone are farthest from each another. The two largest cities are nearest to each other, while the two smallest cities are farthest from one another other.
Input-output approach
Hirsch (1973) states that input-output is, at one level, a theoretical approach with a set of assumptions, well-defined mathematical properties, and close relation to the general equilibrium models of Walras and Cassel. At another level, the technique can be considered as the empirical implementation of a special sort of general equilibrium analysis in which restrictions on the data available and simplifying assumptions convert the technique to a relatively highly disaggregate economic accounting and forecasting tool (Isard et al. 2017).
Input-output models are matrixes with rows and columns representing all the industries and sectors of an economy and indicate how they are structurally related. Each row summarises all the inputs from other sectors that a sector uses for its own production. Each row can basically be regarded as a production function, indicating the inputs from all other sectors in a transaction table. With such a table, the production and trade flows in a region can be traced and predicted (United Nations 1999). A change in production in one sector will have a ripple effect throughout the economy affecting the related demand, prices and outputs of all other sectors (Bazzazan, Alavinasa & Banouei 2005).
Included in this matrix are the value added by each sector and both intermediate and final demand from industries, household, government and other regions, channelled through sales and trade flows, within and exogenous to the regions (Volkwyn & Kleynhans 2014:4). The input or technical coefficients can be determined from the input-output matrix, which indicates the extent to which each sector is related to the others. These technical coefficients show the relative input share necessary from each sector for the production of a single product or service (Pissarenko 2003).
The model represents the whole economy, but for the current study, it will be restricted to the processing sector industries. The input-output table can then be applied to a wide range of economic investigations and analyses.
Multiregional input-output model
Much and varied research has been conducted on a regional level using input-output matrixes. Some studies study economic and trade flows within regions, while others investigate the activities between regions. Most regional models are equivalent to the national input-output tables, but only differ in that regional input-output models cover a smaller geographical region.
The first multiregional input-output models (MRIO) were compiled by Chenery (1953) and Moses (1955). They made the simplified assumptions that trade flows between regions are only determined by the regions between which the flows occur and ignored the particular industries or customers. MRIO analysis allows users to define a large region and capture leaked impacts while maintaining the specificity and individual identities of the direct impact location and each of the linked regions of interest.
When a change in final demand exerts an exogenous impetus to specific production in a region, more factors of production will be required from both the local and other regions, implying spillovers (Sargento 2009). In an effort to supply the required inputs from the various regions, an increase in the demand for intermediate inputs will occur, implying interaction and feedback. This implies an initial increase in final demand in one region, leading to both intra- and inter-regional trade flows (Miller 1998). As the MRIO model accommodates these interactions, feedback effects and spillovers, this model is regarded as ideal for the current research.
The direct changes in production and trade flows in reaction to final demand changes for a certain commodity or region are represented by the technical coefficients, which can be summarised in a macro-economic input-output matrix (A) for five regions as:
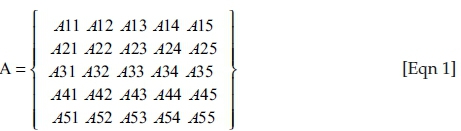
The respective intra-regional trade flows within each of the various regions (1-5) are represented by the technical coefficients A11, A22, A33, A44 and A55.The other technical coefficients indicate the inter-regional flows between the various regions. If the regions were countries, this would indicate global trade between countries. In the current study, it will represent various regions in the province of KZN.
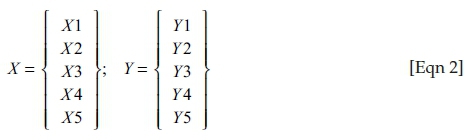
In the same manner, the vectors of total output (X) and final demand (Y) are represented as:
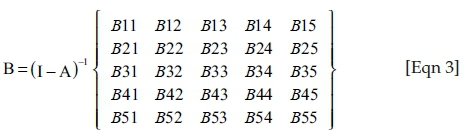
If the matrix is subtracted from an identity matrix, it yields a Leontief inverse matrix, which may be represented as:
Assume the final demand for a good or service in region x1 increases for whatever reason. Since region x1 is reliant on itself (intermediate flows from its own firms) and on intermediate flows from firms in regions x2 to x5 (at various levels) to meet the increased demand (final demand), region x1 and regions x2 to x5 (domestic exports) increase their production to meet the increased demand in region x1. The increase in production in regions x1 to x5 will be dependent on the level of self-sufficiency of region x1 and the degree of inter-regional linkages (spill effect) between region x1 and regions x2 to x5.
In order for regions x1 to x5 to increase their production, they have to buy intermediate goods and services (intra- and inter-regional intermediate flows) from regions x1 to x5 (imports for regions x2 to x5). The increase in the purchasing of intermediate goods and services in regions x1 to x5 (feedback effects) will be dependent on the increase in production in each region, the level of self-sufficiency in each region and the degree of inter-regional linkages between the regions.
To summarise: the MRIO model adds inter-regional spillovers and inter-regional feedbacks to the original single-region input-output table, with this new scenario, which can be represented as:
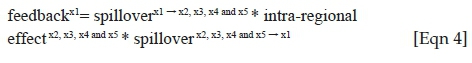
The way that any exogenous final demand influences regional trade flows can be represented by the MRIO model in a consistent framework, which quantifies the relative input shares demanded, including inter-regional spillover and feedback effects.
The standard input-output approach can be used to estimate how changes in one regional economy affect the regional economies linked to it, that is, to estimate or model inter-regional interdependence (Isard et al. 2017). Based on the assumption that the regions have open economies and the required data is available, these inter-regional relationships between different regional economies can then be estimated using regional input-output tables. There is consequently a constant flow of goods and services between the various regional economies so each regional economy buys and sells from each of the other regional economies.
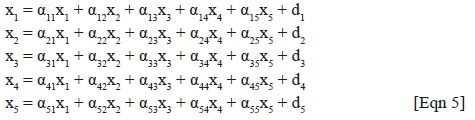
The output of any regional economy (for example, the Pietermaritzburg economy) is needed as an input to many other regional economies, or even for that regional economy itself; therefore, the 'correct' (i.e. shortage-free, as well as surplus-free) level of regional economic output will depend on the input requirements of all the regional economies (n). In turn, the output of the many other regional economies will enter into the Pietermaritzburg economy as inputs, and consequently the 'correct' output levels of the other regional economies will, in turn, depend partly upon the input requirements of the Pietermaritzburg economy. This can be demonstrated with this set of equations:
Where:
-
xn is the five regional economies.
-
αijnnxn is the input demand of the five regional economies; these are known as coefficients.
-
dn is the final demand for the output of the five regional economies.
After moving all terms that involve the variables xn to the left of the equal signs, and leaving only the exogenously determined final demands dn on the right, the 'correct' output levels of the n regional economies of the system of n linear equations change to:

A special regional input-output table was designed for the current study. The following section provides a practical application of this methodology to the economy of KZN.
Linkages in the KwaZulu-Natal spatial economy
An annual regional economic business confidence survey has been conducted in KZN since 2005 and contains questions relating to the proportion of products and services sold by businesses in a particular regional economy (or district) to the other regional economies. The survey is conducted through the various local chambers of business and other local business organisations operating in the five economic regions. The survey is an online internet-based anonymous business survey designed specifically to generate data and information on a number of local economic characteristics and trends, and the general level of business confidence in the particular urban centre (Kleynhans & Coetzee 2017:15).
It is important to note that the survey is conducted at the same time each year - March and April - in order to ensure consistency. In general, the response rate is between 1% and 2% of the total membership of the various chambers of business and business organisations (between 300 and 400 responses per year). Unfortunately given the 'inconsistent' response rate in terms of the number of responses and sector responses per year there can rightly be questions about the credibility of the results and thus the level of inference. Fortunately, given that the survey has been conducted over a 10-year period the use of the average responses in this study can account for many of the inconsistencies in the responses.
The Newcastle respondents, for example, will therefore indicate the proportion of their total sales (exports) to the other four regional economies. The annual proportions (2011-2016) have been averaged in order to minimise the risk of outliers and are displayed in matrix format in Table 5; this constitutes the technical coefficients in a so-called Leontief matrix. The totals do not equal 100 because they exclude the proportions of the total sales sold outside these five regional economies, for example to the rest of the province. Given the low response rates and other data problems mentioned it must be acknowledged that the results are very much specific to this survey data set. The aim of the article is in the first place to suggest and illustrate a concept and research instrument.
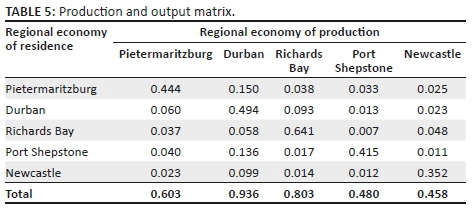
The technical coefficients, as displayed in Table 5, are obtained by extracting the information from the survey itself in terms of the question (question 18) relating to the percentage of sales of the business. Each respondent is asked to indicate the percentage of the sales of the business that took place in each of the five regions, the rest of the province of KZN and South Africa. The question within the survey looks as follows: As a percentage, how much of your total sales occur in the following locations?
-
Durban
-
Pietermaritzburg
-
Newcastle
-
Richards Bay/Empangeni
-
Rest of KZN
-
South Africa
-
Port Shepstone and/or Margate
The individual responses of each region are then averaged to calculate the percentage total sales of each region within each of the other regions and expressed as a decimal number within the technical coefficient matrix as displayed in Table 5.
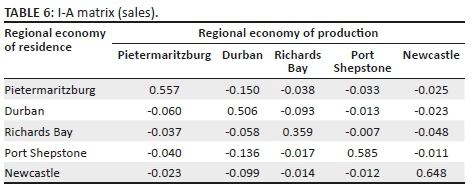
When the technical coefficients matrix is subtracted from an identity matrix, it yields an I-A matrix, which is an essential step in calculating the actual multipliers. Its numbers, per se, do not mean anything. Table 6 illustrates the I-A matrix.
The regional economic multipliers are indicated in Table 7. The multipliers are derived from inversing the I-A matrix. It shows, for example, that when demand for goods and services in the Pietermaritzburg economy increases by R1, production of goods and services in the Pietermaritzburg, Durban, Richards Bay, Newcastle and Port Shepstone economies will increase on average by R1.91, R0.29, R0.26, R0.21 and R0.12, indicating spillover effects.
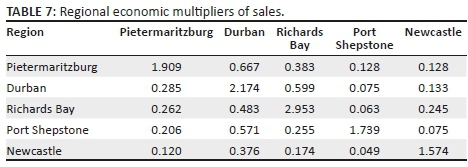
An illustration of the way this new input-output model could be applied in practice is provided in the following section.
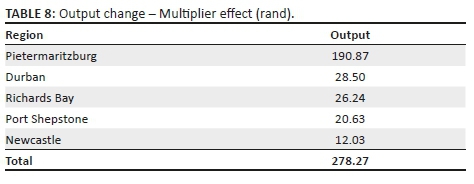
Application of the new multiregional input-output model
This newly developed modified MRIO model can now be utilised in a practical example and applied to the existing regions. Assume final demand in the Pietermaritzburg economy increases by R100 for a particular reason with no change in final demand in the other four regional economies. We apply the ceteris paribus principle for illustrative reasons only, that is, to build and test the MRIO model understanding that final demand is not static and will continuously change irrespective of the final demand in each of the five regions. Applying the regional multipliers (interdependence coefficients) (Table 7) provides the estimates of how final demands for products and services change in the Pietermaritzburg economy, both directly and indirectly (in rand). The new level of output in each region is displayed in Table 8. The cumulative production (intra- and inter-regional flow of final goods and services) that has taken place in the five regions combines to meet an increase in final demand totalling R278.27.
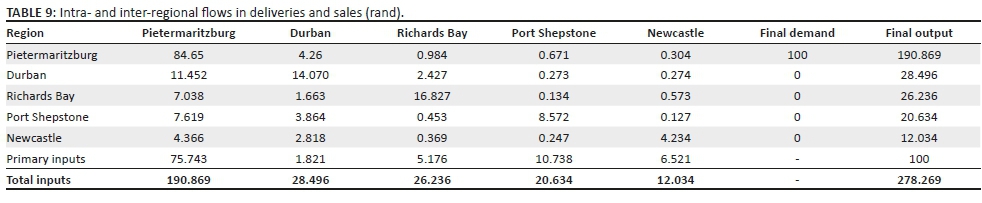
Using the technical coefficients of Table 5, the intra- and inter-regional flows of the value of the deliveries and sales are calculated and shown in Table 9. The rows contain the output of a region, that is, the value of the deliveries and sales of a region to the different regions. This now shows, for example, that trade flows of R85 are generated within the Pietermaritzburg region itself, while a total of R4.26 flows to Durban in the form of goods and services, as well as R100 of final demand. The values are derived by multiplying the output change values in Table 8 by the technical coefficient values in Table 5.
For each region to increase their production to the new total output levels as indicated above, each region has to buy intermediate goods and services (raw materials and semi-finished) from itself and from the other regions (columns). For example, for the production of R190.87, Pietermaritzburg spends R84.65 in Pietermaritzburg, R11.45 in Durban and the primary costs (capital and labour) are R75.74. The total values of intermediate inputs purchased or spent for Pietermaritzburg are R115.13 when the spending in each region is added together. The value of primary and intermediary inputs yields the total production, which sum equals R190.87
Table 10 displays the comparative results of a R100 increase in final demand in each of the regions individually (ceteris paribus). The cumulative effect (total production) is the highest when final demand (for total inputs) increases in Richards Bay (R436.46) and the lowest when final demand increases in Port Shepstone (R205.47). This can possibly be explained by the fact that the manufacturing sector in Richards Bay is very large, accounting for around 40% of its economy while the manufacturing sector is relative small in Port Shepstone (12.24% of its economy) since the manufacturing sector is responsible for the production of goods.
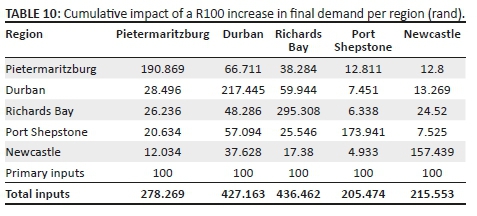
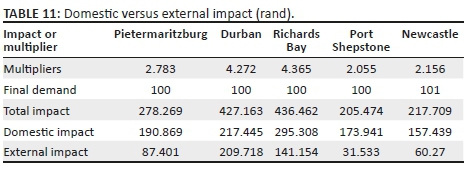
Table 11 displays further statistics when final demand increases by R100 in each region individually (ceteris paribus). From this, it can be inferred that the impact a higher final demand in Durban has on the remaining four regions collectively is largest (R213.40), while the weakest impact of raising demand is that of the Port Shepstone region (31.76) (in monetary rand value terms). One possible explanation is that the Durban economy is very big and much diversified (see Table 2) and thus sells and buys a large variety of goods and services not necessarily available from within while the Port Shepstone economy is relatively small and concentrated and thus sells and buys a fairly small variety and number of goods and services from outside itself.
The domestic and regional trade flows, value added and total domestic production with regard to the total impact, derived from a R100 increase in final demand in each of the regions individually (ceteris paribus), can now be estimated and is displayed in Table 12. Durban exports and imports (to the other regions) the most (R106.27), while Port Shepstone exports and imports (to the other regions) the least (R12.85). Value added (wages, interest, profit and taxes) is highest in Port Shepstone (R90.52), and lowest in Durban (R13.90). This suggests that a R100 increase in final demand in Port Shepstone (ceteris paribus) is mainly supplied by businesses in Port Shepstone while a R100 increase in final demand in Durban (ceteris paribus) is mainly supplied by businesses within the other regions.
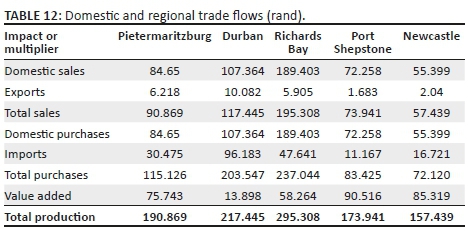
Table 13 displays the percentage of intra- and inter-regional flows for each of the five regions. It shows that Durban is the most 'open' regional economy and Port Shepstone the least. Logically, the opposite follows in accordance. As Durban is the most open, trade flows within the Durban regions are lowest (50.26%) and the closest economy trades most (84.9%) internally among its own sectors.
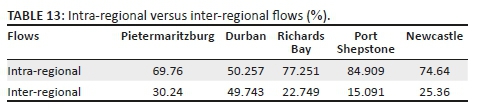
Table 14 displays each of the five regions' major trading partners in terms of sales and purchases.
Table 14 indicates that final demand and trade flows are largest between the most open and strongest regional economies, and the weaker economies are more dependent on the stronger regions, Durban, Pietermaritzburg and Richards Bay.
Summary and conclusion
This article investigated the trade flows in and between the various regions of KZN, South Africa. A modified MRIO model was constructed to investigate the final demand, production and trade flows of the major regional economies in the province and how they link economically with each other using the Chenery-Moses model. The results suggest that there is indeed some flow of final and intermediate goods and services between the five regions of KZN. However, the estimated inter-regional spillover and feedback effects seem to be marginal.
The original Leontief input-output model was developed during the 1930s, to estimate the interrelationships between sectors in an economy. It is an instrument that indicates the various shares of input factors of production that are needed to produce a unit of output by a specific sector. Originally, input-output analyses were used to study structural flows and effects on the national level.
The current study went further and developed a unique regional model to study spatial trade flows within and between smaller regions, such as urban areas or municipal districts within a particular province. The MRIO model can be used for various estimates such as multiplier, linkage, and impact analyses, as well as the estimation of inter-regional spillover and feedback effects. A diacritical feature of this study is that, unlike most other studies that construct input-output models for a single country, the MRIO model was developed to link the five major regional economies in KZN. A survey approach was used for the construction of the MRIO model, which essentially involves using primary data collected from a specially conducted survey to develop the MRIO model.
The multiplier analysis found that the Richard Bay economy had the highest output multipliers, while Port Shepstone had the smallest. The analysis of the economic relationship between the five regions found that the value of intra-trade between these five regions was much higher, by varying degrees, than the value of the inter-regional trade between the various regions.
Durban seems to have a fairly open economy, trading significantly with the other four regions, followed by Pietermaritzburg and Richards Bay. Port Shepstone and Newcastle seem to be fairly closed economies, trading predominantly internally. This possibly explains the reason why the multiplier analysis found that the Port Shepstone and Newcastle economies had the smallest output multipliers.
The method and analysis followed in this article can also be applied fruitfully to other regions of the country, as well as the rest of Africa and the world, studying final output, demand and trade flows.
Acknowledgements
The authors acknowledge the support from the World Trade Organization (WTO) and the National Research Foundation (NRF). Opinions expressed, and conclusions arrived at in the article, are those of the authors and should not necessarily be attributed to these institutions.
Data availability statement
Data sources are available from the sources indicated in the reference list. More information is available from the authors.
Competing interests
The authors declare that they have no financial or personal relationships that may have inappropriately influenced them in writing this article. Opinions expressed and conclusions arrived at in the article are those of the authors and should not necessarily be attributed to these institutions.
Author's contributions
C.E.C. designed the original concept and analysis. E.P.J.K. assisted in the composition, analysis and wrote the final article.
References
African Business Central., 2015, Online market intelligence. London: ABC, viewed 29 April 2019, from https://www.facebook.com/pg/africanbusinesscentral/about/?ref=page_internal. [ Links ]
Bazzazan, F., Alavinasa, M. & Banouei, A.A., 2005, 'Construction of regional input-output table and its applications: The case of Yazd Province', Paper presented at the 15th International Conference on Input-Output Techniques, 27 June-01 July, Beijing, China. [ Links ] Chenery, H., 1953, 'Regional analysis', in H. Chenery & P.B. Clark (eds.), The structure and growth of the Italian economy, pp. 98-139, US Mutual Security Agency, Rome. [ Links ]
Coetzee, C.E., 2015a, Economic and business report - Pietermaritzburg and Umgungundlovu District, KZN Treasury, Pietermaritzburg, Unpublished report. [ Links ]
Coetzee, C.E., 2015b, Economic and business report - Durban and Ethekwini Metropolitan Area, KZN Treasury, Pietermaritzburg, Unpublished report. [ Links ]
Coetzee, C.E., 2015c, Economic and business report -Richards Bay and Uthungulu District, KZN Treasury, Pietermaritzburg, Unpublished report. [ Links ]
Coetzee, C.E., 2016, Provincial and city gross domestic product database, KZN Treasury, Pietermaritzburg, Unpublished report. [ Links ]
Coetzee, C.E. & Kleynhans, E.P.J., 2018, 'Investigating city economic convergence in KwaZulu-Natal, South Africa: Integration or isolation', Regional Science, Policy and Practice 10(3), 221-240. https://doi.org/10.1111/rsp3.12140 [ Links ]
Global Insight, 2018, Global insight regional explorer database, viewed 30 January 2019, from http://www.ihsglobalinsight.co.za/. [ Links ]
Google Earth., 2019, Google Earth Engine; geographical database. Mountain View, California CA 94043 USA, viewed 29 April 2019, from https://www.google.com/earth/. [ Links ]
Hirsch, W.Z., 1973, Urban economic analysis, McGraw-Hill, Columbus, OH. [ Links ]
Isard, W., Azis, I.J., Drennan, M.P., Miller, R.E., Saltzman, S. & Thorbecke, E., 2017, Methods of inter-regional and regional analysis, Taylor & Francis, Abingdon. [ Links ]
Kleynhans, E.P.J. & Coetzee, C.E., 2017, 'The influence of space on business confidence', Africa Growth Agenda 14(1), 15-17. [ Links ]
Miller, R., 1998, 'Regional and inter-regional input-output analysis', in W. Isard et al. (eds.), Methods of inter-regional and regional analysis, pp. 41-134, Ashgate Publishing, Farnham. [ Links ]
Moses, L., 1955, 'The stability of inter-regional trading patterns and input-output analysis', American Economic Review 45(3), 803-832. [ Links ]
Pissarenko, D., 2003, 'Basics of input-output analysis', TC 20(2), 180. [ Links ]
Sargento, A.L.M., 2009, Regional input-output tables and models inter-regional trade estimation and input-output modelling based on total use rectangular tables, Faculdade de Economia, Universidade de Coimbra, Coimbra. [ Links ]
Schaffer, W.A., 1999, Regional impact models, Georgia Institute of Technology, Atlanta, GA, viewed 29 April 2019, from http://www.rri.wvu.edu/WebBook/Schaffer/TOC.html. [ Links ]
Statistics South Africa (Stats SA), 2018, Various publications, Stats SA, Pretoria, viewed 29 April 2019, from www.statssa.gov.za. [ Links ]
United Nations, 1999, Handbook of input-output table compilation and analysis, Series F, No. 74, UN, New York. [ Links ]
Volkwyn, B.J. & Kleynhans, E.P.J., 2014, 'Die verskaffing van elektrisiteit deur Eskom: Die impak van beurtkrag en hoër pryse op die Suid-Afrikaanse ekonomie', Suid-Afrikaanse Tydskrif vir Natuurwetenskap en Tegnologie 33(1), 1-11. https://doi.org/10.4102/satnt.v33i1.430 [ Links ]
 Correspondence:
Ewert Kleynhans
11289570@nwu.ac.za
Received: 03 Apr. 2018
Accepted: 04 Apr. 2019
Published: 05 June 2019

