


Services on Demand
Article
 English (pdf)
 Article in xml format
 Article references
Indicators

Related links
-
 Cited by Google
 -
 Similars in Google
Share

 Permalink
South African Journal of Economic and Management Sciences
On-line version ISSN 2222-3436
Print version ISSN 1015-8812
S. Afr. j. econ. manag. sci. vol.22 n.1 Pretoria 2019
http://dx.doi.org/10.4102/sajems.v22i1.2104
ORIGINAL RESEARCH
The unemployed and the formal and informal sectors in South Africa: A macroeconomic analysis
Philippe Burger; Frederick Fourie
Department of Economics, University of the Free State, South Africa
ABSTRACT
BACKGROUND: At 27.2% in the second quarter of 2018 the official unemployment rate in South Africa ranks as one of the highest in the world. However, depending on whether one uses the official or broad definition of unemployed, since 2008 there are on average between 2 and 3.3 times as many unemployed people as there are people in the informal sector.
AIM: This article seeks to explore empirically, using time-series data, the extent to which an increase in the number of unemployed leads to increased entry of workers into the informal sector.
METHOD: We use a Markov-switching vector error correction model.
RESULTS: We find that such entrance is very limited, lending credence to the notion that significant entry barriers exist into the informal sector
CONCLUSION: From a policy point of view these results suggest the need to consider measures that will ease entrance into the informal sector.
Introduction
At 27.2% in the second quarter of 2018 the official unemployment rate in South Africa ranks as one of the highest in the world. And this rate does not even include those who gave up looking for work, the so-called discouraged work-seekers. Including them yields an unemployment rate of 37.2%. Skills and education levels play a key role in explaining why the unemployed fail to find jobs. For instance, according to the CDE (2013) and Van der Berg and Van Broekhuizen (2012), while the unemployment rate for people with a post-school degree qualification is roughly 5%, it is just shy of 50% for people who did not complete school.
However, given that the formal sector typically is more skills intensive, one would expect that those who fail to find a job in the formal sector, would turn to the informal sector. The informal sector might not be a sector of preference, paying much lower remuneration, but presumably it requires significantly lower skills than the formal sector. Nevertheless, at about 17% of total employment, the South African informal sector remains quite small compared to the informal sector in peer-group countries. Depending on whether one uses the official or broad definitions of unemployed, since 2008 there are on average between 2 and 3.3 times as many unemployed people as there are people in the informal sector (Kingdon & Knight 2004; StatsSA 2017).
Using the official unemployment rate, there are twice as many people unemployed as are working in the informal sector in South Africa. For the broad definition of unemployment, which includes discouraged work-seekers, this factor rises to 3.3 (StatsSA 2017). Discouraged work-seekers alone exceed the number of people working in the informal sector. This raises the question: Why do the unemployed not enter the informal sector to create a livelihood?
According to Kingdon and Knight (2004), people wishing to enter the informal sector might run up against barriers to entry such as skills and capital shortages. In work focusing on the informal sector in Madagascar and West Africa, Grimm, Van der Hoeven and Lay (2011b) and Grimm, Krüger and Lay (2011a) found significant entry barriers into the informal sector, with access to capital and finance being an important barrier. Extensive recent quantitative and qualitative research on the informal sector in South Africa (in a volume edited by Fourie 2018) indicates a variety of obstacles and barriers that potential entrants face. Entrant informal enterprises find it difficult to survive for a meaningful period.
Whereas most of the work on the informal sector and its role with regard to employment or unemployment has been done by labour economists or development economists (using survey data), almost no macroeconomic work has been done in this regard (see Fourie 2011). Typically, there is an assumption that the informal sector acts as a mop-up sector that absorbs surplus workers from the formal sector, for example during a downturn in the economy (National Planning Commission 2012:374; Verick 2012:379). Recent empirical analyses (Burger & Fourie 2018; Rogan & Skinner 2018) have indicated no consistent mop-up role for the informal sector in business cycles. Moreover, the theoretical underpinnings for this presumed behaviour has been largely absent.
Addressing this knowledge gap, Burger and Fourie (2015) developed a theoretical macroeconomic model that includes both the formal and the informal sectors, together with barriers to entry into the informal sector, to explain the very high unemployment rate in the country. This article seeks to explore empirically, using time-series data, the extent to which an increase in the unemployed leads to increased entry of workers into the informal sector. We find that such entrance is very limited, lending credence to the notion that significant entry barriers exist into the informal sector. First, we consider a basic new-Keynesian three-segment model to provide the necessary theoretical foundation for the empirical analysis of flows between a state of unemployment and employment in the two sectors, followed by the empirical analysis.
Macroeconomic theory on unemployment
Relevant literature on segmented models
Standard macroeconomic theory ascribes longer-run unemployment mostly to product and labour market imperfections. Efficiency wages, labour unions and hysteresis all feature as explanations (see typical textbook explanations in Cahuc and Zylberberg 2004, as well as Carlin and Soskice 2006). However, while these mostly new-Keynesian theories might explain why people do not get employed in sectors where efficiency wages and labour union behaviour apply, they still do not explain the presence of sustained, longer-run unemployment. These theories fail to explain the presence of unemployment, because, one would presume, people who fail to find employment in sectors where efficiency wages and labour union behaviour apply, can find a solution in self-employment. So the question remains: what explains their unemployment status?
Augmenting these standard new-Keynesian theories, Bulow and Summers (1986) and Layard, Nickell and Jackman (1991:41-44; also 2005) developed theoretical frameworks with primary and secondary sectors. In these models, the primary sector is characterised by typical new-Keynesian features such as efficiency wages and labour union behaviour. Due to these features, in equilibrium there are people who are willing to work at the prevailing market wage but who are nevertheless unable to find employment in the primary sector. As such, they are involuntarily unemployed in the primary sector. However, they then succeed in finding (self-) employment in the secondary sector, which (by assumption) is not characterised by such new-Keynesian features. Thus, although these workers are involuntarily unemployed in the primary sector, they do find work, albeit in the secondary sector.
As a corollary, in these models people who are still unemployed once they have considered the options in both the primary and secondary sectors, would be voluntarily unemployed - they are unwilling to work at the prevailing wage in either sector, and the secondary sector in particular. These workers might be involuntarily unemployed in the primary sector, but there is no such thing as involuntary unemployment for the economy in the aggregate (i.e. including the secondary sector).
These models go a long way to consider the presence of both formal and informal sectors, with the formal sector characterised by new-Keynesian features and the informal sector not.1 Yet they still fail to explain why many of those who cannot get employed in the primary sector also fail to self-employ (or find wage employment) in the secondary sector. They are unable to find employment in either the primary (formal) or secondary (informal) sectors, irrespective of the prevailing wage. They are not only involuntarily unemployed in the primary sector, but also in the economy in the aggregate. It is in this context that the noted work on entry barriers is relevant, as it indicates how factors such as skills and capital shortages, inter alia, may play a role as entry barriers, even in the informal sector.
A model with entry barriers
Based on these suggestions, Burger and Fourie (2015) developed a theoretical macroeconomic model that (a) uses the two-sector distinction of Bulow and Summers (1986) and Layard et al. (1991, 2005) between a primary (formal) and secondary (informal) sector, but (b) extends it by also including entry barriers into the secondary sector to explain the existence of aggregate involuntary unemployment (which can be seen as a third segment in the economy). Here we use a similar model, slightly adapted to allow adjustments to occur sequentially (i.e. over time rather than simultaneously).2
Equilibrium in the basic model without entry barriers
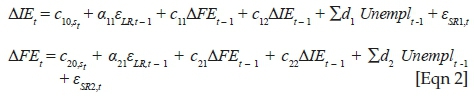
Figure 1 presents a graphical exposition of this extended, three-segment model, which shows both the primary and secondary sectors in one diagram, in the left-hand and right-hand segments of the diagram. The employed are to be found in both sectors (segments), but some people are left unemployed in the middle, either voluntarily or involuntarily. Economic changes and shocks affect the distribution of people across these three segments.
The entire x-axis represents the full working-age population (NN), while component e indicates those who are not active in the labour market (e.g. full-time students, stay-at-home parents, the early retired). The remainder in the diagram are all in the labour market. The left-hand side of the diagram represents the primary (or formal) sector, where the wage level (WP1) and the level of employment (distance 0P-EP1) are set by firms through the interaction of the wage-setting (WSP1) and price-setting (PSP1) relationships. The positions of the wage-setting and price-setting relationships are a function of new-Keynesian market features such as efficiency wages and labour union behaviour.3 As is typical in new-Keynesian models, the product markets are oligopolistic markets, meaning that the firms are price setters and not price takers. Thus, prices are set as a mark-up over costs (which constitutes the price-setting function). The wage-setting relationship might entail that wages are set either by the company (as in efficiency wage models) or by labour unions. The secondary (informal) sector, shown on the right-hand side of the diagram, is not characterised by new-Keynesian features. Hence, wages are set through the labour supply (LS) and demand (LD). In the secondary sector one finds labour supply,  , and demand,
  setting the wage at WS and the number of employed people at 0S-ES1.
Note that the informal sector labour demand schedule is horizontal, thus assuming that labour has a constant marginal product. This is not an altogether unrealistic assumption. For instance, according to Berry (2001:7) large and medium enterprises (in our case, operating in the primary sector) more often than not have an amount of capital that complements a number of employees. As more workers are added, it might lead to a decreasing marginal product of labour. In the informal sector, though, firms are small and their required capital (e.g. simple tools) is operated and replicable on a small scale. Thus, such capital does not necessarily allow another worker to be added without additional capital - for additional workers the enterprise needs to duplicate its capital. Therefore, every worker is the first worker and there is no second worker who decreases the marginal product of labour. The same might be true for firms employing two or three workers since there is not much scope to decrease the marginal product of labour if the capital is operated and replicable on a small scale. The flat marginal product of labour (and hence the flat labour demand curve) for informal sector workers has been well verified empirically, according to Berry (2001:7). Of course, financial constraints might limit the ability of potential entrants into the informal sector from acquiring even the minimal capital goods required. This would limit the size of the effective labour supply. The discussion below will elaborate on this constraint.
Looking at the whole model, in equilibrium the distance a between EP1 and ES1 represents the number of unemployed workers; they are voluntarily unemployed because they are not willing to work at the market wage set in either sector of the economy. The rest of the labour force is employed in the formal and informal sectors. Our next step is to consider how a shock impacts this employment and unemployment equilibrium (still in the absence of informal-sector entry barriers).
Shocks in the basic model without informal sector entry barriers
Suppose a shock to profitability occurs that reduces the effective mark-up; in Figure 1, this shifts the PS schedule from PSP1 to PSP2. This shock might be the result of a recession, or a shift in underlying product market conditions affecting the demand for the goods produced or the cost of other inputs. As a result, the primary sector wage adjusts to WP2 and employment in the primary sector drops to EP2. Workers equal to distance b = EP1-EP2 lose their jobs. These workers now enter the informal sector, hence shifting its labour supply curve leftwards by the equivalent amount b (= EP1-EP2), that is from  to
to  . In the absence of barriers to entry into the secondary (informal) sector, employment in the informal sector will increase from ES1 to ES2.
In shifting their supply of labour from the primary to the secondary sector, these former formal sector workers have to reveal their reservation wage (given the new-Keynesian characteristics of the primary sector, they were paid more than their reservation wage when they were employed in the primary - formal - sector). The difference between the formal sector wage that they received before becoming unemployed and the wage they are willing to work for in the informal sector is the difference between WP1 and WS1.
Barring entry barriers all those entering the informal sector will get employed. Thus, the number of unemployed people will not be higher than before the shock - the distance between EP1 and ES1 (= a) is the same as between EP2 and ES2 (= b+c). In terms of employment, the shock was absorbed 100% by the informal sector - total employment remained the same, but its allocation between the formal and informal sectors has changed. (This depicts, in a pure form, the conventional assumption about the shock-absorber or mop-up role of the informal sector.)
How informal sector entry barrier changes the outcomes
The presence of barriers to entry into the informal sector significantly changes this model outcome. Given such barriers, not all the people who lose their jobs in the primary sector will be able to get employment in the secondary sector - there will only be partial absorption or mop-up. Thus, instead of the labour supply in the informal sector moving from  to ,
to , it might (due to entry barriers) only move from
  to
to  , as former formal sector workers are unable to enter the informal sector. Workers equal to
 might fail to enter the informal sector. The unemployed workers indicated by d are involuntarily unemployed, while those in b+c, are voluntarily unemployed. The latter are willing to work for wage WS1, while the former are not.
So how might these barriers to entry work? Grimm et al. (2011a) developed a small-scale model that explains the impact of entry barriers. In their model the potential entrant into the informal sector faces two possible constraints. The first is a borrowing constraint, while the second is the threshold amount of capital needed to generate a positive return. By capital is meant primarily physical capital, but also the cost of acquiring the human capital (skills) needed to operate a small firm. Below the threshold, the return on capital is zero or so low that it does not justify the effort of investing (this might be the result of economies of scale not kicking in below the threshold). Thus, to be viable requires an investment large enough that it exceeds the threshold of minimum capital needed to generate a positive return. The question that the potential entrant into the informal sector now faces is whether or not her borrowing constraint is lower or higher than the minimum threshold of capital needed. If it is lower, the potential entrant cannot borrow enough to finance capital on a large enough scale to reach the minimum threshold required to generate a positive return. In that case the potential entrant will not be able to enter the secondary sector and will remain unemployed.
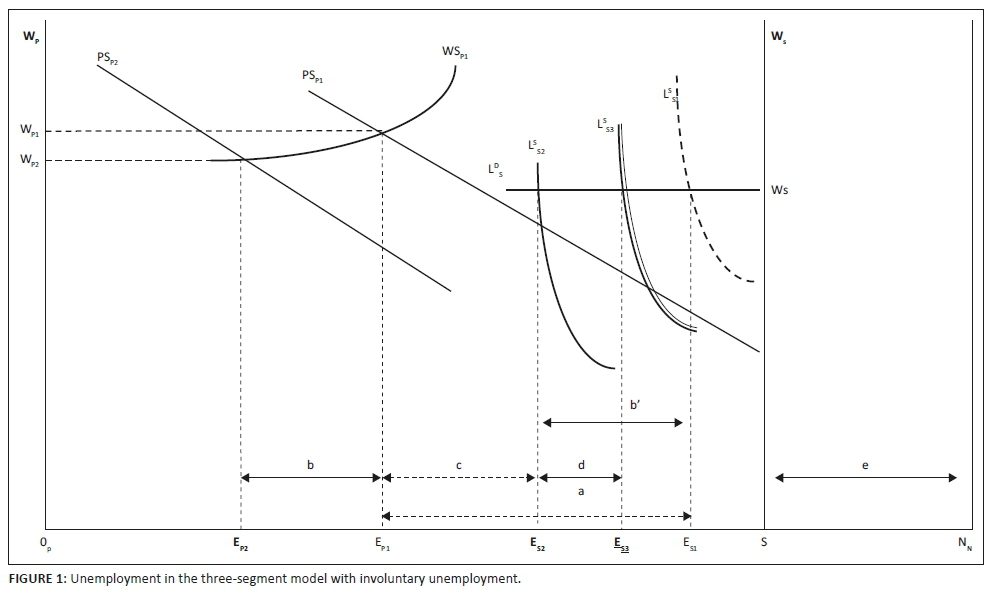
An alternative explanation for higher unemployment after the shock would be that the reservation wage of some of the workers who became unemployed is higher than the prevailing wage in the secondary sector. Figure 2 presents this possibility, which entails that only some of the workers who lose their jobs in the primary (formal) sector, supply their labour in the secondary (informal) sector. At wage WS1 labour supply does not move leftward by distance b, but only by distance f, moving from  to
to  (only at higher informal sector wage WS2 would secondary - informal - sector labour supply increase by amount b). This yields a level of employment, ES3, similar to level ES3 in Figure 1 with barriers, but in Figure 2 employment level ES3 is the result of workers unwilling to work for the prevailing wage in the secondary (informal) sector, rather than entry barriers.
Note that in Figure 2 distance d does not represent the involuntarily unemployed, but merely those added to the voluntarily unemployed - the involuntarily unemployed would be (b+c+d). Thus, Figure 1 explains involuntary unemployment, while in Figure 2 all unemployment is voluntary and thus, presumably, less problematic. Thus, should the unemployment rate increase after a shock, the question would be: did the workers not enter the informal sector because their reservation wages remained higher than the prevailing wage in the informal sector (in which case the newly unemployed are voluntarily unemployed), or because they faced barriers to entry?
Lloyd and Leibbrandt (2014) provide some insight into this. Using household survey data, they compared the levels of dissatisfaction reported by the not-economically active, the job searching, as well as the discouraged unemployed, and the employed. They found that the levels of happiness among both the job searching and the discouraged unemployed are much lower than among the employed and the not-economically active. This result suggests that large numbers of the unemployed are not voluntarily unemployed. Accordingly, one can conclude that a shock-induced increase in the number of unemployed workers does not typically lead to workers happily withdrawing their labour supply because they consider the market wage too low compared to their reservation wage.
An empirical model linking formal and informal sector employment to unemployment
In the previous section it is argued that if unemployment increases in the face of an economic shock, barriers to entry into the informal sector would cause the informal sector to fail as a full shock absorber that employs all the unemployed. An increase in the unemployed will therefore, at best, only result in a partial absorption into the informal sector. This section seeks to establish empirically whether an increase in unemployment is followed by an equal or a smaller number of people flowing into the informal sector in South Africa. If only a fraction enter the informal sector, it could be taken as an indication of the presence of entry barriers into the informal sector.
Specifying the model
To model the relationship between formal and informal sector employment, as well as unemployment, this section uses a Markov-switching vector error correction (MS-VEC) model. The time-series data used covers the full period for which quarterly employment data is available - 2008Q1 to 2017Q1; these data originate from Statistics South Africa's Quarterly Labour Force Survey (2017) - see Figures 3-5.
Except for the period of the global financial crisis and the accompanying recession, the formal and informal sector employment series both display an upward trend over time. Generally, as the population and labour force grows, more people will be employed. Thus, the formal and informal sector employment series are not expected to be stationary time series. However, the unemployment rate, being a rate of change, is a series one would expect to be stationary over time. The evident non-stationarity of formal and informal sector employment requires the use of a VEC model to ensure that long-run information about the relationship between these two variables is not lost. Thus, the formal and informal sector employment series will enter the long-run component of the model, while the unemployment rate will enter the short-run component of the model. In other words, the long-run component captures the long-run relationship between the levels of formal and informal sector employment, while the unemployment rate influences the short-run changes in formal and informal sector employment.
The long-run relationship is normalised on the informal sector employment variable. We therefore postulate that informal sector employment will adjust to shocks in the relationship between the formal and informal sector employment. (The extent of this adjustment is discussed below.) Furthermore, as the labour force grows and more people are employed over time, one would expect this to reflect in increases in both formal and informal sector employment. Thus, in the long run one would expect a positive relationship between the two. (If employment in the formal and informal sectors expands at the same rate, that would constitute a one-to-one relationship between formal and informal sector employment.)
Usually, assuming responsive wages, if the unemployment rate increases, one would expect it to put downward pressure on the real wage rate, which in turn is expected to lead to higher employment. Thus, in terms of the model below, a higher unemployment rate might be expected to lead to more people entering formal and informal sector employment in later periods. Therefore, we expect a positive relationship between the unemployment rate in period t-1 and the change in both formal and informal sector employment in period t.
Furthermore, although the formal sector is a sector of preference, workers who are unable to find employment in the formal sector would want to enter the informal sector. However, in terms of the theoretical model above, the presence of entry barriers would prevent them from doing so. Moreover, the presence of entry barriers in the informal sector means that the sum of workers subsequently entering the formal and informal sectors would fall short of the initial increase in unemployment (number of unemployed workers). Thus, although we still expect a positive relationship between the unemployment rate in period t-1 and the change in both formal and informal sector employment in period t, the presence of entry barriers in the informal sector implies that the size of its parameter will be too small to ensure that all those becoming unemployed in period t-1 are employed in the informal sector in period t. This is the hypothesis that we will test empirically.
Because the behaviour of economic agents may not remain constant over time, economists use a number of techniques to model such changing behaviour. The Markov-switching technique, developed by Hamilton (1989, 1996, 2008), is frequently used to distinguish behaviour during economic upswings from behaviour during economic downswings (which is how Hamilton used it).4 The regimes used in the model below are driven by the cyclical behaviour of formal sector employment (more on this below, when reporting the results of Figure 6).
Similar to the Engle-Granger co-integration method, the model below is estimated in two steps. Using a simple ordinary least squares (OLS) regression, the first step entails estimating the long-run component, as in Equation 1. The second step plugs the lag in the long-run residual (εLR,t) into the short-run component of the model (Equation 2) to serve as error correction term. Unlike the Engle-Granger method, here the short-run model estimated is not a single equation, but a MS vector autocorrelation regression (VAR) model containing the residual of the long-run component as error correction term. Estimating the VAR instead of a single equation deals with the possibility of endogeneity between the variables. In addition, the short-run component also includes lags in the unemployment rate. In this regard four possibilities were explored: (1) a model with only a one-period lag of the unemployment rate, (2) a model with a one- and a two-period lag in unemployment, (3) a model with a one- and a three-period lag in unemployment, and (4) a model with a one- and a four-period lag in unemployment.5 The earlier (i.e. second, third, and fourth period) lags were included to allow for the possibility that the impact of a change in the unemployment rate might take some time to register in formal and informal sector employment levels. As it turns out, none of the earlier lags was statistically significant, which means that the model presented below only contains a one-period lag in the unemployment rate.
Lastly, to allow for the possibility that behaviour might change over up- and downswings of the business cycle, the short-run component is estimated as a Markov-switching model, allowing the constants to take different values depending on whether the model is in Regime 0 or 1. (The short-run component of the model also was estimated with three seasonal dummies to cater for possible seasonal effects.)
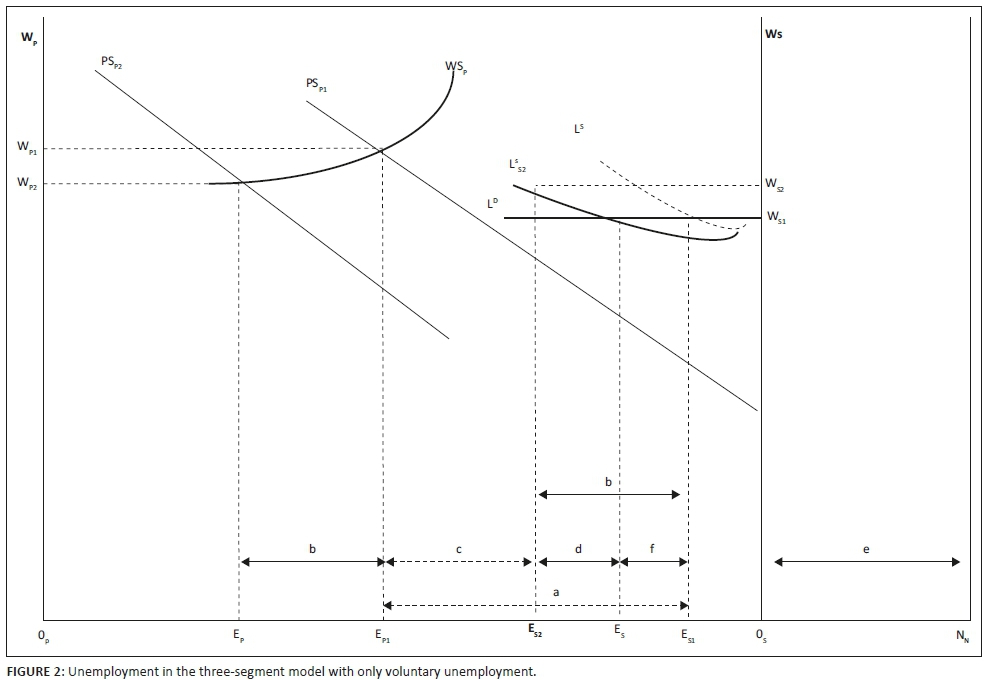
Thus, the long-run component of the MS-VEC model:

while the short-run component is:
where:
-
IE: Informal sector employment
-
FE: Formal sector employment
-
Unempl: The unemployment rate
-
β1 and β2: The long-run parameters relating the log-levels of informal and formal employment
-
α11 and α21 The error correction parameters, with -1<α11<0 and α21≥0
-
st: denoting whether the constant is in Regime 0 or Regime 1.
The data for 2008Q1 to 2017Q1 yield 37 observations. Ideally one would prefer a longer sample, but Juselius and Toro (2005) have shown that even a sample of 31 observations can yield useable results. The formal and informal sector employment series enter the model in log-levels, while the unemployment rate enters it as a rate. The unemployment rate series used is the official unemployment rate and not the broad unemployment rate. (Using the broad unemployment rate series did not yield significant results. The reason for this is probably that discouraged work-seekers are, by definition, not searching for work and therefore do not affect the labour supply in either the formal or informal sector as much as the searching unemployed.)
Results
The formal and informal sector unemployment series are non-stationary series, while unemployment, after some further investigation, turns out as stationary.6Figure 6 presents the results. The uppermost panel of Figure 6 presents the long-run results. It shows that there is an almost one-for-one relationship between formal and informal sector employment, with the parameter equal to 1.086. Indeed, given that the standard error in the formal sector employment variable equals 0.136, the parameter value is not statistically significantly different from 1. Thus, over the longer term a 1% increase in formal sector employment is associated with roughly a 1% increase in informal sector employment, meaning that formal and informal sector employment grow in tandem over the longer run.
The residual series of the long-run component is also stationary, as can be seen from the KPSS result reported in Appendix 1 (which also shows the residual series graph). It subsequently enters the short-run component of the model as error correction term.
The second panel contains the results for the short-run component of the model. It shows what proportion of a shock to the long-run relationship between formal and informal sector employment is corrected (reversed) in one time period (i.e. one quarter). This component was estimated in the second step of the model estimation process. First all the variables specified in Equation 2 were included in the first round. Then, to save degrees of freedom, those variables that were found to be statistically insignificant at a 10% level in both the short-run relationships were dropped in the second round. Two of the seasonal dummies, as well as the change in formal sector employment were dropped.7 First note that the error correction term in both the short-run equations is statistically significant and has the correct sign.8 The value of -0.392 in the equation for the change in informal sector employment (first line of second panel) shows that 39.2% of a shock causing a deviation from the long-run component is corrected within one quarter, while the value of 0.162 for formal sector employment shows that 16.2% of a shock is corrected within one quarter.
Of interest is the impact of the lagged value of unemployment in both equations. The parameter of 1.294 in the equation for the change in informal sector employment and 0.693 for formal sector employment (second line of second panel), shows that a one percentage point increase in the unemployment rate leads to a 1.294% and 0.693% increase in informal and formal sector employment in the next period.
To answer the question whether or not the unemployed are subsequently absorbed into formal and informal sector employment once they lose their jobs, consider the following example using labour market data for the first quarter of 2017. Given the total number of unemployed of 6.214 million, a one percentage point increase in the unemployment rate would render 224 332 additional people unemployed. Multiplying this number by 1.294% and 0.693% gives us an idea as to how many unemployed people would be absorbed by the informal and formal sectors in the following quarter. In the case of the formal sector it is 78 558, while for the informal sector it is 34 700. On average, about a third of the additional unemployed find work in the formal sector in the following quarter, and about half of that find work in the informal sector. Thus, about half of the number of additional unemployed do not find employment at all in the following quarter. In addition, the impact of the unemployment rate on formal and informal sector employment is limited to the first lag (one quarter).9
The results of the empirical analysis above indicate that all the unemployed are not absorbed into the informal sector.10 This finding might be consistent with either of the models set out in Figures 1 and 2. However, read together with the findings of Lloyd and Leibbrandt (2014) on the unemployed not being voluntarily unemployed, the above analysis appears to confirm the theoretical model of Figure 1, and not that of Figure 2. Thus, the results show that a significant portion of the unemployed fail to find employment in the informal sector because of entry barriers.
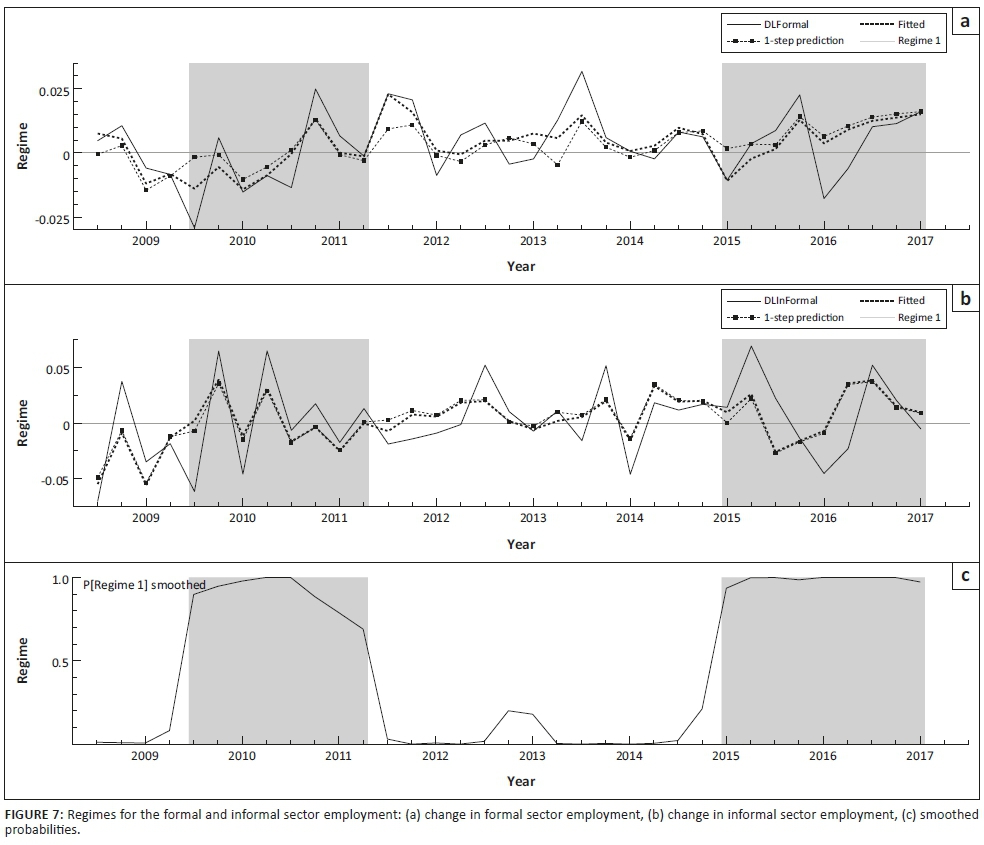
Lastly, Figure 7 indicates that, when the change in formal sector employment displays a significant drop, thus entering negative territory, the behaviour described by the short-run component of the model switches from Regime 0 to Regime 1. This occurred in the depth of the Great Recession (2009Q3), and at the advent of the latest recession (2015Q1). Regime 1 thus has its advent in recession.
Conclusion
South Africa has been suffering from an inordinately high unemployment rate for quite some time. The discussion above highlighted that the number of unemployed people in the country is between 2 and 3.3 times as many as the number of people working in the informal sector. To provide an explanation for this high unemployment rate and the relatively small informal sector this article puts forward a theoretical framework linking employment in both the formal and informal sectors of the economy to involuntary unemployment. The model ascribes the failure of the informal sector to absorb the large number of unemployed to entry barriers in the informal sector.
The empirical part of the article provides corroborating evidence for the existence of entry barriers into the informal sector. It shows that, indeed, once the unemployment rate increases, the ability of both the formal and informal sector to reabsorb the unemployed in the next period is very limited. From a policy point of view these results suggest the need to consider measures that will ease entrance into the informal sector. Access to capital, credit and other financial services, as well as opportunities for owner-operators and workers to improve their skills (notably accounting skills) might serve as top agenda points in this regard. However, there are also other factors that could serve as entry barriers, and therefore also need specific attention. Aspects such as location, premises, facilities and business services (including internet), transport cost, crime, as well as the physical distance between informal firms, their suppliers, and even in some cases their clients, are likely factors. This might require a broader rethink of the role of the informal sector. Typically, policy tends to focus on formalising informal enterprises. Viewed in this way the informal sector is seen as a problem sector, a sector from which enterprises must be assisted (or made) to exit. However, it is also possible to see the informal sector as a sector that can do what the formal sector is unable to do: provide work to low-skilled workers. In such a view, a resilient, buoyant informal sector that can, in the long term, absorb those workers who are unable to find employment in the formal sector will become part of the solution to the unemployment problem. But then the barriers to entry into the informal sector need to come down.
Acknowledgements
Competing interests
The author declares that they have no financial or personal relationships that may have inappropriately influenced them in writing this article.
Authors' contribution
Both authors contributed equally to the article.
References
Beccarini, A. & Gros, D., 2008, At what cost price stability? New evidence about the Phillips curve in Europe and the United States, CEPS Working Document, 302/September, CEPS, Brussells. [ Links ]
Berry, A., 2001, The role of the small and medium enterprise sector in Latin America: Implications for South Africa, TIPS Working Paper 5, viewed 05 June 2017, from http://www.tips.org.za/files/421.pdf [ Links ]
Burger, p. & Fourie, F.C.v.N., 2018, 'The informal sector, economic growth and the business cycle in South Africa: Integrating the sector into macroeconomic analysis' in F.C.v.N. Fourie (ed.), The South African informal sector: Creating jobs, reducing poverty, HSRC Press, Cape Town. [ Links ]
Burger, p. & Fourie, F.C.v.N., 2015, Macroeconomic policy and South African unemployment: Developing a three-segment macroeconomic model, REDI3x3 Working Paper 6, viewed from http://www.redi3x3.org [ Links ]
Bulow, J.I. & Summers, L.H., 1986, 'A theory of dual labor markets with application to industrial policy, discrimination and Keynesian unemployment', Journal of Labor Economics 4(3)(Part 1), 376-414. [ Links ]
Cahuc, p. & Zylberberg, A., 2004, Labor economics, MIT Press, Cambridge, MA. [ Links ]
Carlin, W. & Soskice, D., 2006, Advanced macroeconomics, Oxford University Press, Oxford. [ Links ]
Centre for Development and Enterprise (CDE), 2013, 'Graduate unemployment in South Africa: A much exaggerated problem', CDE Insight, viewed April 2013, from http://www.cde.org.za/publications/jobs-growth/83-jobs-and-growth/403-graduate-unemployment-in-south-africa-a-much-exaggerated-problem [ Links ]
Fourie, F.Cv.N. (ed.), 2018, The South African informal sector: Creating jobs, reducing poverty, HSRC Press, Cape Town. [ Links ]
Fourie, F.Cv.N., 2011, The South African unemployment debate: Three worlds, three discourses?, Working Paper 63, SALDRU, University of Cape Town. [ Links ]
Grimm, M., Krüger, J. & Lay, J., 2011a, 'Barriers to entry and returns to capital in informal activities: Evidence from Sub-Saharan Africa', Review of Income and Wealth 57, S27-S53. [ Links ]
Grimm, M., Van der Hoeven, R. & Lay, J., 2011b, Unlocking potential: Tackling economic, institutional and social constraints of informal entrepreneurship in Sub-Saharan Africa: Main findings and policy conclusions, International Institute of Social Studies, Erasmus University. [ Links ]
Hamilton, J.D., 2008, 'Regime switching models', in S.N. Durlauf & L.E. Blume (ed.), The new Palgrave dictionary of economics, 2nd edn., Palgrave Macmillan, viewed 20 July 2017, from http://www.dictionaryofeconomics.com/article?id=pde2008_R000269 [ Links ]
Hamilton, J.D., 1996, 'Specification testing in Markov-switching time-series models', Journal of Econometrics 70, 127-157. [ Links ]
Hamilton, J.D., 1989, 'A new approach to the econometric analysis of nonstationary time-series and the business cycle', Journal of Econometrics 57(2), 357-384. [ Links ]
Holmes, M.J. & Silverstone, B., 2006, 'Okun's law, asymmetries and jobless recoveries in the United States: A Markov-switching approach', Economics Letters 92, 293-299. [ Links ]
Juselius, K. & Toro, J., 2005, 'Monetary transmission mechanisms in Spain: The effect of monetization, financial deregulation, and the EMS', Journal of International Money and Finance 24(3), 509-531. https://doi.org/10.1016/j.jimonfin.2005.01.002 [ Links ]
Kingdon, G.G. & Knight, J.B., 2004, 'Unemployment in South Africa: The nature of the beast', World Development 32(3), 391-408. [ Links ]
Layard, R., Nickell, S. & Jackman, R., 1991, 2005, Unemployment: Macroeconomic performance and the labour market, Oxford University Press, Oxford. [ Links ]
Lloyd, N. & Leibbrandt, M., 2014, 'New evidence on subjective well-being and the definition of unemployment in South Africa', Development Southern Africa 31(1), 85-105. https://doi.org/10.1080/0376835X.2013.864513 [ Links ]
National Planning Commission, 2012, National development plan: Vision for 2030, our future - Make it work, NPC, Pretoria. [ Links ]
Pagliaci, C. & Barráes, D., 2010, 'A Markov-switching model of inflation: Looking at the future during uncertain times', Análisis Económico XXV(59), 25-46. [ Links ]
Simon, J., 1996, A Markov-switching model of inflation in Australia, Research Discussion Paper 9611, Reserve Bank of Australia. [ Links ]
Statistics South Africa, 2017, Quarterly labour force survey, Quarter 1, 2017, Excel datasheet viewed 01 June 2017, from http://www.statsSA.gov.za [ Links ]
Van der Berg, S. & Van Broekhuizen, H., 2012, Graduate unemployment in South Africa: A much exaggerated problem, Working Paper 22/2012, University of Stellenbosch, viewed from http://resep.sun.ac.za/index.php/research-outputs/stellenbosch-working-papers/wp2012/ [ Links ]
Valadkhani, A., 2015, 'Okun's Law in Australia', Economic Record 91(295), 509-522. [ Links ]
Valadkhani, A. & Smyth, R., 2015, 'Switching and asymmetric behaviour of the Okun coefficient in the US: Evidence for the 1948-2015 period', Economic Modelling 50, 281-290. https://doi.org/10.1016/j.econmod.2015.07.001 [ Links ]
Verick, S., 2012, 'Giving up job search during a recession: The impact of the global financial crisis on the South African labour market', Journal of African Economies 21(3), 373-408. [ Links ]
 Correspondence:
Philippe Burger
burgerp@ufs.ac.za
Received: 17 Sept. 2017
Accepted: 11 Oct. 2018
Published: 25 Feb. 2019
1 . In this article the primary sector is synonymous with the formal sector, while the secondary sector is synonymous with the informal sector. This, of course, need not always be the case, as one could also have two formal sectors, one with new-Keynesian characteristics and the other not. However, in a country such as South Africa with a rather concentrated formal sector and an informal sector defined as comprising small firms not registered for tax purposes, the small-firm nature of the informal sector and the concentrated nature of the formal sector render it possible to portray the primary/secondary sector nature of the model as synonymous with the formal/informal sector nature of the economy.
2 . In Burger and Fourie (2015) the theoretical model is set up as a system of simultaneous equations, thus depicting equilibrium at a moment in time. The theoretical model in this article is set up sequentially, to explain the sequence from a (demand) shock, to increased unemployment, to increased absorption of the unemployed in either the formal or informal sectors. This is done to match this article's empirical model, which is a vector error correction model, that is, where the reaction of formal and informal sector employment that returns the model to equilibrium occurs in a time period after the shock that took the relationship between them out of equilibrium.
3 . If the labour market was free and not subject to new-Keynesian features, the equilibrium wage would have been equal to the wage in the secondary sector (i.e. equals to WCS) - in fact, the primary and secondary sector distinction would fall away, given the absence of the new-Keynesian features.
4 . It is also used to explore the behaviour of inflation, employment and unemployment (cf. Simon [1996], Beccarini & Gros [2008]) and Pagliaci and Barráes (2010) for inflation MS models and Holmes and Silverstone (2006), Valadkhani and Smyth (2015) and Valadkhani (2015) for MS models of Okun's Law).
5 . All four lags were not included simultaneously to save degrees of freedom and because the unemployment rate series displays a high degree of serial correlation. High serial correlation would lead to multicollinearity and hence, cause the lags in the unemployment rate to turn up as statistically insignificant even if they are not.
6 . The KPSS stationarity test shows that all three variables (formal and informal sector employment and the unemployment rate) are I(1) variables, that is, they are non-stationary (see Appendix 1 for the results). This is not what one would have expected for the unemployment rate series. However, using the same KPSS test on a sample of the unemployment rate that covers two observations per year (March and September) for the period September 1999 to March 2017 (the longest period for which there are at least two observations of the unemployment rate available per year), clearly shows that the unemployment rate indeed is a stationary variable. Hence the decision to enter it as a stationary variable into the short-run component of the model is warranted. (We use the KPSS test because it is more robust that conventional tests such as the ADF and PP tests.)
7 . For purposes of brevity the first round results are not reported here, but are available from the author on request.
8 . Negative in the equation for the change in informal sector employment and positive (given the positive relationship between formal and informal sector employment in the long run) in the equation for the change in formal sector employment.
9 . As mentioned earlier, the models estimated with earlier lags in the unemployment rate (i.e. second, third and fourth period lags) showed these lags to be statistically insignificant.
10 . The model cannot show whether the unemployed left jobs in the formal sector (the data does not allow for this). Nevertheless, the long-run relationship of the model has been set up with formal sector employment driving informal sector employment (the latter is the dependent variable in the long-run component). Thus, if formal sector employment drops one percentage point, it correlates almost one-to-one with a one percentage point drop in informal sector employment.
The Kwiatkowski-Phillips-Schmidt-Shin test reported in Table 1-A1 indicates that for the period 2008Q1 to 2017Q1 formal and informal sector employment, as well as the unemployment rate are I(1) variables. This is what is expected for formal and informal sector employment (which are upward-sloping variables), but not the unemployment rate. However, applying the KPSS test to a longer series of the unemployment rate (biannual observations for the period 1999Q to 2017Q1) shows clearly that the unemployment rate is a stationary time series. Lastly, the residual of the long-run relationship is also stationary.


Figure 1-A1 - Click to enlarge

