


Services on Demand
Article
 English (pdf)
 Article in xml format
 Article references
Indicators

Related links
-
 Cited by Google
 -
 Similars in Google
Share

 Permalink
South African Journal of Economic and Management Sciences
On-line version ISSN 2222-3436
Print version ISSN 1015-8812
S. Afr. j. econ. manag. sci. vol.21 n.1 Pretoria 2018
http://dx.doi.org/10.4102/sajems.v21i1.1650
ORIGINAL RESEARCH
The benefit of aligning South Africa's personal income tax thresholds and brackets with that of its peers using a micro-simulation tax model
Yolande Jordaan; Nicolaas J. Schoeman
Department of Economics, University of Pretoria, South Africa
ABSTRACT
BACKGROUND: This article is based on a PhD study in which a microsimulation (MS) tax model was constructed to measure the revenue and tax efficiency effects of adjustments to marginal tax rates on individual income.
AIM: The main aim with this analysis is to determine the advantages of adjustments to the thresholds and taxable income brackets in SA on revenue collected, tax efficiency, and progressivity as part of a broader tax reform effort.
SETTING: Currently such changes mainly consist of adjustments to tax brackets and thresholds to account for inflation, although since the 2017/2018 budget, such adjustments have been minimised as a result of the widening in the budget deficit.
METHODS: The tax brackets and thresholds for the 2005/2006 fiscal year are used as a base from which changes are implemented. Besides the base scenario, two other scenarios are simulated, based on that of South Africa's peers (lower levels). Simulations are done with the MS tax model.
RESULTS: The research shows that instead of only allowing for inflation adjustments, the alignment of income brackets and thresholds to levels closer to those of South Africa's peers could be beneficial with an improvement in the efficiency of the income tax regime. More individuals could be included into the tax net, albeit at (on average) lower tax scales resulting in a marginal loss in revenue. Although such an adjustment could be interpreted as being more regressive and, therefore, negative from a 'tax fairness' perspective, the Personal Income Tax (PIT) burden expressed as the PIT and Gross Domestic Product (GDP) ratio would be slightly lower.
CONCLUSION: The possible result would be an improvement in tax liability and economic growth which could in turn fuel personal income and, therefore, revenue collected from this important tax source. This would compensate for the initial loss in PIT.
Introduction
According to Keen (2012:10), personal income tax commonly accounts for less than 10% of all tax revenue in low-income countries - compared to an average of more than 25% in Organisation for Economic Cooperation and Development (OECD) countries. In South Africa, personal income tax accounts for approximately 37% of total tax revenue (Tax Statistics 2017). Theoretically, an important advantage of personal income tax is the use thereof to improve on 'fairness' in terms of progressivity of the tax. However, indications are that there has been limited success with the use of personal income tax in order to improve on progressiveness. Keen (2012:10) ascribes the limited success to both political and technical failures. He points out that entrenched owner structures and corruption are powerful obstacles to taxing elites and many high income and/or wealth individuals. The problem is that there are many ways in which much of taxable income can be avoided and/or evaded. For example, by shifting income into a wealth portfolio with capital gains tax at a lower tax rate and many opportunities for rent-seeking and the concealment of income by placing it offshore. Furthermore, administrative weaknesses and errors of design, contribute towards inefficiency regarding the collection of income tax due.
Typical problems encountered are thresholds that may have been set too low. This is especially the case in developing countries where the initial tax base relies on a very narrow set of taxpayers. In addition, tax schedules which determine the levels of progressivity and thereby the 'fairness' of the tax regime are adjusted without quantifying the actual impact thereof on progressivity with adjustments (in South Africa for example) mainly based on inflationary trends. Income tax practices also rely heavily on some form of self-assessment which is featured by many malpractices regarding the concealment of income. As a result, it is important that countries continuously assess the efficiency of their tax regimes in order to adjust and align accordingly to international trends in this regard within a very competitive tax environment. Hence an attempt in this article to focus on one aspect of this problem, namely, threshold levels and optimal income tax schedules.
A large literature exists regarding the role of tax schedules in tax reform programs. Such schedules can be described by various measures, such as effective average tax rates that allow for comparing the total tax burden, effective marginal tax rates that are used in the design of optimal tax schedules and different progressivity measures which inform about the extent to which tax schedules are redistributive (Roller & Schmidheiny 2016). The basic rule seems to be that tax reform should be revenue neutral. The simple mantra is that the base must be expanded to become more economically neutral and that marginal tax rates must be lowered. In this research we attempt to measure the change in progressivity and efficiency in the South African tax regime by adjusting both the upper levels of income tax brackets and threshold levels in order to quantify the effect thereof on the efficiency and progressivity of the tax structure. We also measure the change in the income tax burden as a result of tax changes expressed as a ratio to GDP. A voluminous number of studies show a close relationship between taxable income and tax paid with taxpayers sensitive to taxes and willing to alter their taxable income in response to tax rate changes.
For example, in a article by Arnold et al. (2011), the authors indicate that for a sample of 21 OECD countries over the 1971-2004 period, tax revenue is significantly associated with per capita GDP (Baiardi et al. 2017). As a result, tax rates have to be applied carefully within a very competitive tax environment (Saez 2003). Using elasticity coefficients to determine the response of taxpayers to rate adjustments also allows for the estimation of deadweight losses of income taxes. Obviously, the channel along which taxable income responses occur, may affect the efficiency losses induced by income taxes (Doerrenberg, Peichl & Siegloch 2015). However, in this study, such channel effects have been negated due to a lack of sufficient data.
Tax reform over the past 30 years in OECD countries has been featured by lower marginal tax rates and a reduction in the number of tax brackets. However, it is important not to compare different tax structures only by their marginal rates, but also to look at the threshold levels, as well as the number of tax brackets (OECD 2010:32). Musgrave (1987:59) states that reforming the income tax structures for individuals starts by increasing the level of the tax threshold, creating horizontal equity (all individuals dealt with equally within similar economic conditions), and by reducing the number of tax brackets with lower marginal tax rates. According to Tanzi:
… Setting up an efficient and fair tax system is, however, far from simple, particularly for developing countries that want to become integrated in the international economy. The ideal tax system in these countries should raise essential revenue without excessive government borrowing, and should do so without discouraging economic activity and without deviating too much from tax systems in other countries … (Tanzi & Zee 2001:1)
Empirical research by Peter, Buttrick and Duncan (2010:457) links tax thresholds to GDP per capita (GDP/capita) ratios. For example, they use GDP/per capita ratios to compare different countries' tax-free thresholds and their top taxable income brackets. They conclude that, in order to improve the equity of the tax system, the tax-free thresholds should be set equal to the GDP per capita or twice the GDP per capita in the case of developing countries where tax administration is less efficient. These findings are supported by Saunders (2007) and the World Bank (1991:2-6). Peter et al. also states that the proxy for the highest taxable income brackets for high income, upper-middle income, and low-income countries should be 3, 18, and 83 times the GDP per capita, respectively. The authors conclude that the average number of tax brackets for upper-middle income countries should be set at 4-6 brackets, making the tax systems simpler to understand and administer. A tax-free threshold in excess of the GDP/per capita ratio increases progressivity, but should be considered with care (Saunders 2007; World Bank 1991:2-6).
Given the relevance of the GDP/per capita ratios regarding linkages to thresholds and marginal tax rates, it is interesting to compare such GDP/per capita ratios between countries at different levels of development and income. Figure 1 illustrates the actual GDP/per capita values for lower and upper-middle income economies for the 2009/2010 fiscal year. For upper-middle income countries, the average GDP/per capita was US$5390. Chile, an upper-middle income country, had the highest GDP/per capita ratio of almost $10 000. Thus, if the tax-free threshold is set to equal the GDP/per capita, the Brazilian and Chilean tax systems seem to be more progressive than that of other countries in this category. Figure 2 illustrates the GDP/per capita ratio of high income economies for the 2009/2010 financial year. The average GDP/per capita ratio for these countries amounted to $37 171, which was much higher than in developing countries. In New Zealand, Spain and the United Kingdom GDP/per capita was less than the average GDP/per capita for high income countries with the result that the tax systems of these three countries seem to be less progressive than that of the other higher income countries. The figure also shows that the GDP/per capita ratios for the United States, Ireland and Australian tax systems were higher than the average GDP/per capita, therefore the tax systems seem to be more progressive.
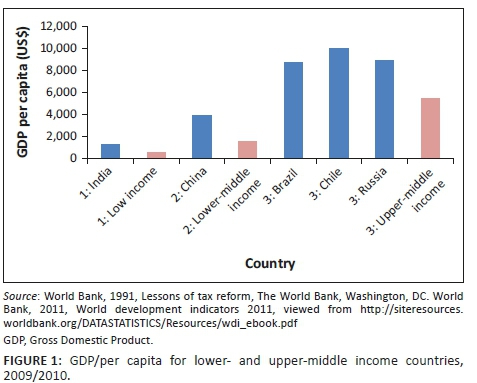
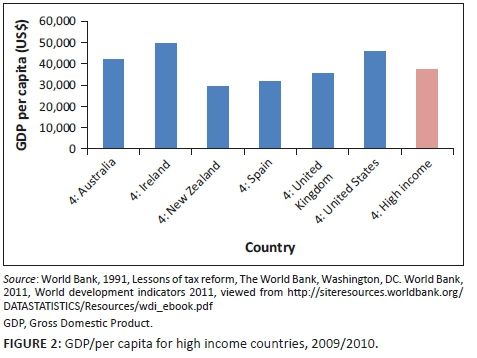
Table 1 shows two indicators (expressed as a multiple of GDP/capita) for the tax-free threshold (Personal Income Tax Minimum level [PITMINL]), as well as the highest income group where the top marginal tax rate is applied (Personal Income Tax maximum level [PITMAXL]). As mentioned before, the benchmarks set for upper-middle income countries in the study by Peter et.al. suggest levels of three times the GDP/per capita as a threshold and 18 times the GDP/per capita as the income level from where top marginal rates should be applied. The relevant numbers in Table 1 show a mixed picture with most countries well below these benchmarks (especially at the upper level for top marginal rates). From the countries included in the table, India seems to be closest to the benchmark as far as threshold is concerned, while Chile (12.08) is closest to the upper level benchmark. On average, the threshold level ratios for upper-middle- income countries amount to 1.30 with the upper level for top marginal rates at 3.91, respectively. It should be mentioned though that the averages also include upper-middle- income countries where a flat tax rate is applied (with no or very small thresholds) (United States Agency for International Development [USAID] 2010).

Furthermore, extreme variation in these indicators can be observed especially in the case of China with a ratio of only 0.27 as a threshold and 52.99 for the top marginal rate income level (PITMINL). However, in China PIT as a percentage of total tax income is relatively low compared to other OECD countries where PIT is a major source of tax revenue. China also has relatively high marginal tax rates at the upper income tax brackets but also high tax rebates and fewer income tax brackets (Brys et al. 2013:30).
This article does not allow for a full outline of the evolvement of tax policy in South Africa, safe to mention that tax policy in South Africa has been affected by numerous amendments over the past number of years with the most prominent being the recommendations made by the Franzsen Commission (1970), the Margo Commission (1987), and the Katz Commission (1999). In 2013, the Davis Tax Commission (n.d.) was appointed, 'to assess our tax policy framework and its role in supporting the objectives of inclusive growth, employment, development and fiscal sustainability'. This Commission is still in the process of making recommendations that informs tax policy in this country. A main feature of tax reforms thus far was the restructuring of the South African Revenue Service (SARS) in order to improve on the collection of taxes and also the shift towards value-added tax in support of income tax. However, literature on tax policy adjustments and the quantification thereof is extremely limited and this research is unique, regarding the adjustment of thresholds and tax brackets in particular and should be helpful to the revenue authorities in determining future tax policies.
Since the country became a democracy in 1994, the tax system in South Africa has gone through several tax reforms including adjustments to threshold levels and schedules. The Katz Commission (1999) recommended that the income brackets and threshold be adjusted to compensate for inflation and that the number of marginal rate brackets be reduced. Thus, in an attempt to provide relief for inflation-related earnings increases (fiscal drag), all income brackets and thresholds have been adjusted continuously (South African Reserve Bank [SARB] 2017). Table 2 shows the tax-free threshold and top income brackets as a multiple of GDP/per capita for South Africa, from 2005/06 to 2010/11. On average, the ratio for the tax threshold level amounted to 1.06 with the top income bracket at 10.44, respectively. Thus, the tax threshold level of South Africa is more in line with that of upper middle-income countries (Table 1) while the top income brackets are closer to that of lower- income countries.
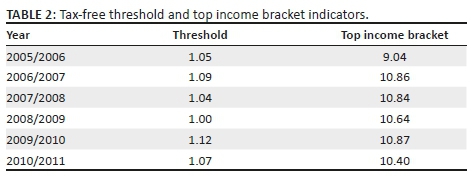
Figure 3 illustrates the GDP/per capita and tax threshold levels for South Africa from 2005/2006 to 2010/2011. Throughout this period the differences between GDP/per capita and the tax threshold levels have been marginal, except for 2009/2010 when it reached about 10.4%, (SARB 2017; Tax Statistics 2017).

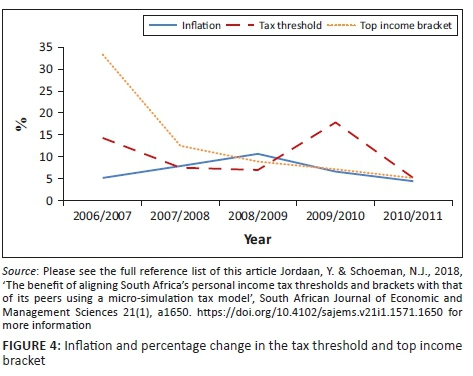
Figure 4 shows the inflation rate, percentage change in the tax thresholds and top income brackets for the period 2007-2011. The GDP/per capita ratio between 2008/2009 and 2009/2010 increased by 5.7% and the tax-free threshold by 17.9% which exceeded the inflation rate of on average 6% during this period. As a result, more lower-income taxpayers were excluded from the tax base. National Treasury's explanation for this increase in the tax-free threshold is that it provided some fiscal stimulus with tax relieve to taxpayers in view of the onset of the global financial crisis. The percentage change in the top income brackets in 2006/07 and 2007/08 was 33.3 and 12.5 respectively, reflecting an adjustment rate that far exceeded the inflation rate. Over the years income brackets have been reduced in number from 10 to 6. Thus, it seems that thresholds have been too low compared to that of the county's peers and the income tax brackets also not aligned to GDP/per capita levels as outlined, (Tax Statistics 2017).
The layout of the rest of the article is as follows: Section 2 explains the data base and methodology. In Section 3 the structure of the micro-simulation (MS) model is outlined and in Section 4 the model is validated. Section 5 outlines the simulation exercises reflecting the impact of changes in the number of income tax brackets and threshold levels on revenue and tax efficiency. Section 6 concludes with a summary of the findings and some policy recommendations.
Data and methodology
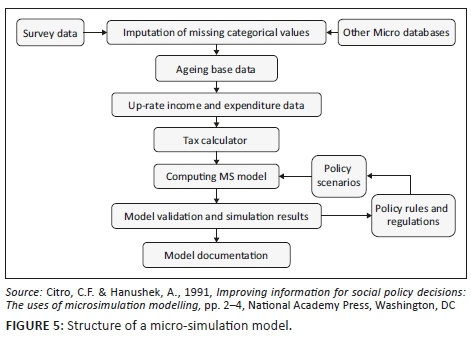
MS models are mainly based on individual and household data, as is the case with the model structured in this article. In the case of South Africa, the most representative survey is conducted by the Central Statistics Income and Expenditure Survey (IES) but unfortunately the information shows a high level of versatility (Statistics South Africa [Stats SA] 2008:1-2). Income levels are calculated on an individual base with the profile of individuals explained by categorical variables, such as gender, age group, education level, population group and settlement. Some of the categorical information is unspecified, but these values cannot be excluded from the dataset because the individuals are included in the weights of the survey and will affect the population total. To improve the data, the problem of unspecified values has been addressed through the imputation technique of Peichl and Schaefer (2009:3). The technique replaces unspecified values in each categorical group by the mean value of the specified values in the categorical groups. Figure 5 reflects the general structure of the MS model used in Section 3.
For the categorical variables in the IES survey containing unspecified data, a frequency table was obtained for each variable to determine the distribution of the unspecified values. When computing values for the unspecified categorical variables the frequency distribution of the original responses remained unchanged. This methodology is available in the SAS program known as RANUNI (uniform random number generator). Briefly, the algorithm is as follows:
In Equation 1, Ri is the ith random number, a is the multiplier and c the percentage increase.

The RANUNI function then generates a random number using a generator developed by Lehmer (1951) from a uniform (0, m) distribution, and turns it into (0.1) by dividing by m. The number in parentheses is the seed/random number of the random number generator. If the seed is adjusted to a non-zero number, the same random numbers are being generated every time the program is activated (Fan, Felsovalyi & Keenan 2002:26).
Furthermore, the IES and 2005/2006 SARS filer data (Tax Statistics 2017) databases differ in terms of base years (calendar versus fiscal year); and to be able to compare, the IES data had to be adjusted to fiscal year 2005/2006 data using the CALMAR reweighting program (Sautory 1993). This program recalculates the weights according to control totals, gender, race and age group to match the population totals produced by Stats SA. The CALMAR method is also used by Stats SA and the modellers of the EUROMOD (Immervoll & O'Donoghue 2009:2) and SAMOD (Ntsongwana, Wright & Noble 2010:2) models.
Structure of the micro-simulation model
Income tax liability is affected by thresholds levels and the structure of income tax brackets. Changes in tax liability are therefore determined by changes in such structures, as well as in personal income. In our model we attempt to quantify such changes by simply making PIT a function of different levels of taxable income (Equation 2) given the tax structure in that particular financial year. However, in the case of taxable income data not being freely available a rough calculation is made by using national income as reflected in the GDP of the country. Thus, the elasticity (εt,tby) of tax liability (t) to taxable income (tby) is estimated. If the elasticity of tax liability is greater than unity, the tax system is progressive (marginal tax rates increase with taxable income). Thus, tax liability is positively correlated with taxable income (Girouard & André 2005:7). The function used to estimate PIT is expressed in logarithmic form:

Girouard and André (2005:7) compares tax elasticities for various countries. The authors estimate the average elasticity coefficient for tax revenue relative to taxable income for 28 OECD countries to be between 1.5 and 2.0 (thus, relatively elastic). A coefficient in excess of 1 indicates a progressive tax. As mentioned earlier another progressivity measurement is the GDP/per capita multiple of the top income bracket. If the multiple of the top income bracket increases, then progressivity decreases. Higher income brackets cause more taxpayers to fall into lower-income groups and as a result their tax burden declines (Steenekamp 2012b:45). These progressivity measurements are applied in tax reform scenarios, to estimate and compare the progressivity of taxes.
The elasticity of taxable income is then used as an indicator of tax efficiency changes as reflected in changes in deadweight loss. However, this article does not allow for an elaborate explanation of the elasticities and the deadweight loss methodology, used in this research, safe to mention that the elasticities are used to determine the progressiveness of the PIT structure and the deadweight loss (tax efficiency) of the tax structure. In the case of measuring deadweight loss the consumer surplus approach is used. The elasticity coefficient, therefore, varies between different income levels, showing the progressivity of the tax structure and the efficiency of tax reform as measured by deadweight loss (Girouard & André 2005:7). The elasticity coefficient for South Africa amounts to 0.38 for the lowest-income group and increases to 0.79 for the highest income group. These elasticities are within the range of other empirical studies.
Validation of the micro-simulation model results
After simulating tax liability with the MS model, the results are compared to published SARS data, IES, and the Bureau of Market Research of the University of South Africa to validate the model. Table 3 shows that the MS model's tax liability of R132 billion exceeds the SARS assessed tax liability of R111 billion (the actual amount collected was R125 billion). This is plausible since the MS model accounts for the whole of the South African population and not only for assessed taxpayers. The results for gross income and tax liability are very similar to those of the Bureau of Market Research Bundles (2000:17). It should be noted, though, that the MS model only calculates tax liability, which differs from the actual amount collected due to advanced and lagged payments

Table 4 shows a summary of the number of taxpayers, taxable income, and tax liability by taxable income group, comparing SARS data and the MS model. A large number of taxpayers (almost 50% of total taxpayers) fall within the lower income group (less than R80 000). The income groups (less than R130 000) in total earn 40% of taxable income and pay 19% of total tax liability. The highest income group, above R300 000, earns 29% of taxable income and contributes 48% of total tax liability. Tax liability is highly skewed to the higher income groups, indicating sensitivity to policy changes. The income group R180 000 to R230 000 comprises only 5% of total taxpayers, but earns 9% of taxable income and pays 9% of total tax liability.

It is evident from Table 4 that the number of taxpayers, taxable income, and tax assessed per taxable income group (excluding Standard Income on Employees Tax (SITE) individuals) in the two different databases are close to each other, indicating that the adjusted IES data is sufficient for use in the MS model. The data shows that the survey income data seems to be biased towards the lower income groups, with their taxable income 8% more than in the SARS data. In the case of the other income groups, the difference in taxable income between the two datasets only varies between 1 and 5%.
The MS model results shows that almost half of the population has unspecified gross income, while approximately 19 million fall under the tax threshold of R35 000. About 1.8 million individuals earn income between R35 000 and R60 000. Those earning less than R60 000 only qualified for SITE, and were not liable to file a tax return.
Tax reform - The impact of changes in the number of income tax brackets and threshold levels
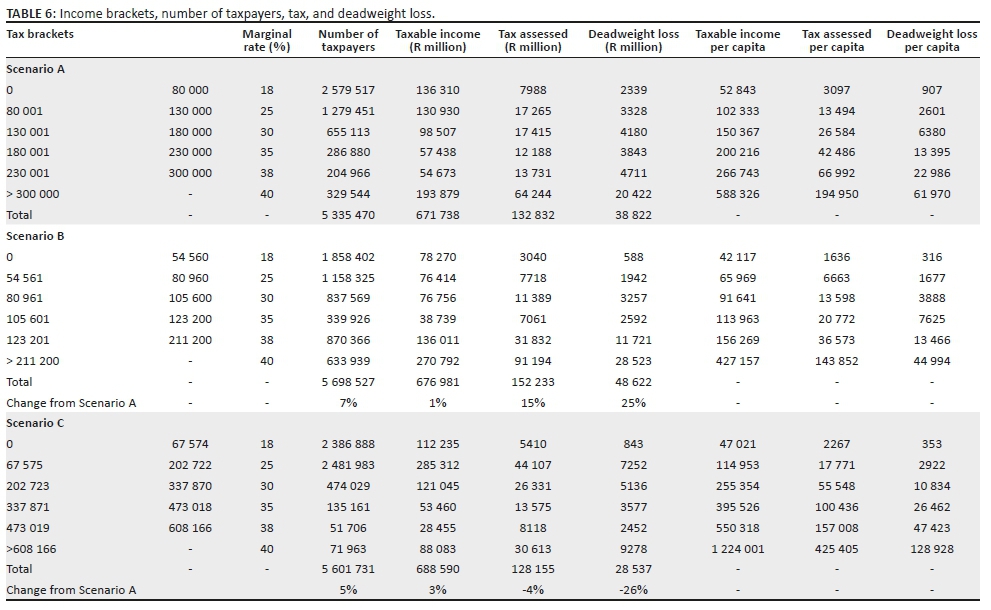
As mentioned before, the main objective with this analysis is to determine the impact of adjustments to the thresholds and taxable income brackets on revenue, tax efficiency and progressivity (equity and fairness). The tax brackets and thresholds for the 2005/2006 fiscal year are used as a base from which changes are implemented. Besides the base scenario, two other scenarios are simulated: one where the income tax brackets and thresholds are only adjusted with the inflation rate from the 1998/1999 levels, and a second where income tax brackets and thresholds are adjusted to the GDP/per capita levels as discussed and which are based on that of South Africa's peers (lower levels). The different scenarios for the adjustment in tax brackets and the thresholds per taxable income group can be seen in Table 5. The scenarios are as follows:

Scenario A (tax liability as a base scenario): The base year is 2005/2006, and the marginal tax rates are between 18% and 40%, as recorded in the official tax tables during that period. The lowest and highest income brackets are R80 000 and R300 000, respectively.
In Scenario B: the impact of tax reform on individual tax liability over the period 1998/1999 to 2005/2006 is measured by changing the parameters underlying the tax structure (rebates and threshold levels). Again, the 1998/1999 figures have been used due to the fact that the tax brackets in that year had been reduced from 10 to 6. It is assumed that between the 1999 and 2006 fiscal years, fiscal policy has remained unchanged other than adjustments for bracket creep. In order to do this, the six income brackets and the thresholds in the 1998/1999 tax structure have been adjusted only by the inflation rate. Thus, this scenario shows what the rebates and thresholds and therefore revenue would have been in 2005/2006, had the tax structures only been adjusted for inflation based on the 1998/1999 levels.
Finally, Scenario C reflects the potential revenue change if the threshold and income brackets had been adjusted to levels on par with that of South Africa's peers. The threshold for taxpayers below the age of 65 years is set to equal the GDP/per capita1 (R33 787) in 2005/2006. The lowest income bracket is double the GDP/per capita, and the highest income bracket is 18 times the GDP/per capita ratio. The rest of the income brackets are evenly distributed, with the marginal tax rates equal to those of the 2005/2006 tax structure.
Table 6 reflects the results of changes in the income tax brackets and threshold levels, compared to the base model. In Scenario A the total deadweight loss amounts to R38.8 billion, with total tax liability at R132.8 billion. Scenario B, applying the inflation-adjusted tax codes for 1998/1999 to the taxable income of 2005/2006, shows an estimated tax liability of R152 billion, which is 15% more than in Scenario A. The deadweight loss increases to R48.6 billion (25% more than in Scenario A), thus lowering the efficiency of the tax system as a result of the lowering in the levels of the tax brackets in Scenario B. More individuals are included (363 057) because of the lower threshold; and more individuals fall within the higher income groups, with tax elasticity measuring an increase in the deadweight loss. Thus, by adjusting the tax brackets and threshold levels only by the full amount of inflation rates, tax liability would have increased but at the cost of a loss in tax efficiency and proportionality as reflected in the increase in deadweight loss. In Scenario C, with tax brackets structured substantially more proportional, tax liability decreases to R128 billion, but the deadweight loss now only amounts to R28.5 billion, which is, respectively, 4% and 26% less than in the base scenario. Thus, by adjusting the tax brackets and threshold levels to margins comparable with that of South Africa's peers both tax liability and tax progressivity would decrease.
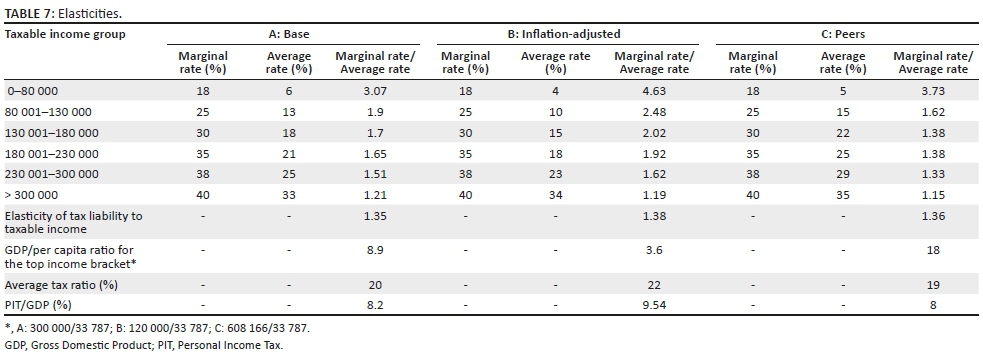
The impact of the three scenarios of tax policy adjustments on elasticities and, therefore, on progressivity is outlined in Table 7. Tax elasticity for the base scenario amounts to 1.35, and increases to 1.38 with inflation-adjusted tax brackets, but then decreases again to 1.36 when income tax brackets are adjusted to those of South Africa's peers. Thus, both Scenarios B and C are slightly more progressive than the base scenario. Progressivity is also measured by quantifying the GDP/per capita multiple of the highest income bracket. In Scenario A the highest taxable income bracket is 8.9 times the GDP/capita, and it decreases to 3.6 in Scenario B with inflation-adjusted income brackets. In Scenario C the highest taxable income bracket is adjusted to that of South Africa's peers, which is 18 times the GDP/per capita. Therefore, progressivity increases from Scenario A to B, but decreases in Scenario C mainly because of smaller differences between the higher and lower income brackets and many more taxpayers falling within the lower income brackets.
As indicated previously, literature suggests a close relationship between income tax and GDP and although this relationship has not been tested in this research, Jordaan and Schoeman (2015) indicate that for economic growth to be optimal the PIT/GDP ratio should not exceed the 6.7% level. Based on this margin for optimal growth (although not the central objective with this research) it is therefore also interesting to measure the outcome of the different tax scenarios on this ratio for optimal growth. In Scenarios A and B the PIT/GDP ratios amount to 8.2 and 9.5%, respectively, which are higher than the optimal PIT/GDP ratio of 6.7%. With threshold and income brackets adjusted to levels equal to those of South Africa's peers (Scenario C), the PIT/GDP ratio is 8% - the lowest in all three scenarios and closer to the optimal ratio.
Conclusion
Tax reform has received substantial attention in the international literature, as well as in South Africa, outlined in the various reports referred to. Given the budget challenges to the Treasury in this country, sustainable fiscal policy is only possible through a continuous process of tax reforms. Such reforms should not only address the broadening of the tax base by adding more taxable sources and the adjustment of tax rates. There should also be reforms involving the most important source of income, namely income tax, the proper adjustment of income tax schedules and threshold levels in order to reduce the excessive tax burden and improve on efficiency and progressivity.
Compared to a scenario with only inflation-adjusted taxable income brackets the adjustment of income brackets and tax-free thresholds to levels similar to those of South Africa's peers shows marginally lower revenue (decrease by 3.5%) but an improvement in efficiency (35% improvement). The broadening of the tax brackets as suggested in Scenario C results in an increase in the number of individuals in the lower taxable income group compared to the base scenario. The increased margins for those in the highest income bracket reduces the number of individuals in that group thereby reducing progressiveness somewhat but the efficiency of the tax structure improves substantially together with a PIT/GDP ratio closer to the optimal ratio for the enhancement of economic growth.
Albeit at a lower ratio, the suggested adjustments to the tax structures still portray progressiveness with elasticity coefficients in excess of unity but with more potential taxpayers included into the tax net with the average tax ratio at a lower level. Although total tax liability is reduced which would result in some revenue loss, the research suggests that such revenue losses would be compensated for by an improvement in economic activity with increased income levels that in turn would fuel the income base from which income tax is levied.
Future research in this field of study should expand the MS model to become a dynamic model that also captures features such as population ageing and other demographic changes. The model should then be even more useful in simulating the impact of important policy changes such as health care and retirement incentives.
This study is limited to individual income tax, using income data from the Stats SA IES. However, the same database also contains rich data on household expenditures, and so the model could be expanded to include an analysis of the impact of taxes not only on disposable income but also on expenditure patterns. Given the structure of an MS tax model, such changes in expenditure patterns as a result of changes in tax policy could be very helpful in determining not only the efficiency but also the fairness of such tax initiatives, given the skewness of income and the resultant tax liability.
Another shortcoming of the static MS model used in this analysis is that it is not linked to a macro model that could also estimate the impact of changes in disposable income and tax liability on consumption and saving, and eventually on the full circle throughout the economy, with changes in the income base. For example, linking this model to a Computable General Equilibrium (CGE) model would allow for a better calibration between the parameters of both models, and thus for a more accurate measurement of the effects of fiscal policy reforms.
Finally, the MS model used in this research is based on 2005/2006 IES data. However, data for the 2010/2011 fiscal year has just been released and another more recent benchmark would be helpful in judging the quality of the research outcomes. This means that the model would have to be re-calculated to accommodate structural changes since the 2005/2006 base year.
Acknowledgements
Competing interests
The authors declare that they have no financial or personal relationships that may have inappropriately influenced them in writing this article.
Authors' contributions
Y.J. did the analysis, calculations and writing of article. N.J.S. contributed to corrections, making the article clearer and more focused, and wrote the abstract and conclusion.
References
Arnold, J.M., Brys, B., Heady, C., Johansson, A., Schwellnus, C. & Vartia, L., 2011, 'Tax policy for economic recovery and growth', The Economic Journal 121(550), 59-80. https://doi.org/10.1111/j.1468-0297.2010.02415.x [ Links ]
Baiardi, D., Profeta, P., Puglisi, R. & Scabrosetti, R., 2017, Tax policy and economic growth: Does it really matter? Cesifo working paper no. 6343, Category 6: Fiscal policy, macroeconomics and growth, Center for Economic Studies and Ifo Institute (CESifo), Munich. [ Links ]
Brys, B., Matthews, S., Herd, R. & Wang, X., 2013, Tax policy and tax reform in the People's Republic of China, OECD Taxation Working Papers, No. 18, OECD Publishing, Paris. [ Links ]
Bureau of Market Research Bundles, 2000, Personal disposable income in South Africa by population group, income group and district, Research report No 279, University of South Africa, Bureau of Market Research, Pretoria. [ Links ]
Citro, C.F. & Hanushek, A., 1991, Improving information for social policy decisions: The uses of microsimulation modelling, National Academy Press, Washington, DC. [ Links ]
Doerrenberg, P., Peichl, A. & Siegloch, S., 2015, The elasticity of taxable income in the presence of deduction possibilities, CESifo working paper no. 5369, CESifo Group Munich. [ Links ]
Fan, X., Felsövályi, A. & Keenan, S., 2002, SAS for Monte Carlo studies: A guide for quantitative researchers, SAS Institute, Inc, Cary, NC. [ Links ]
Franzsen Commission, 1970, Third report of the commission of inquiry into Fiscal and Monetary Policy in South Africa, RP24/1969, Government Printer, Pretoria. [ Links ]
Girouard, N. & André, C., 2005, Measuring cyclically adjusted budget balances for OECD countries, OECD Economics Working Papers No. 434, OECD Publishing, Paris. [ Links ]
Immervoll, H. & O'Donoghue, C., 2009, 'Towards a multi-purpose framework for tax-benefit microsimulation: A discussion by reference to EUROMOD, a European tax-benefit model', International Journal of Microsimulation 2(2), 43-54. [ Links ]
Jordaan, Y. & Schoeman, N., 2015, 'Measuring the impact of marginal tax rate reform on the revenue base of South Africa using a microsimulation tax model', South African Journal of Economic & Management Sciences 18(3), 380-394. https://doi.org/10.4102/sajems.v18i3.795 [ Links ]
Katz Commission, 1999, Interim reports of the Katz Commission into certain aspects of the tax structure of South Africa, Government Printer, Pretoria. [ Links ]
Keen, M., 2012, Taxation and development - Again, IMF Working Paper, WP/12/220, Fiscal Affairs Department, International Monetary Fund, Washington, DC. [ Links ]
Lehmer, D.H., 1951, 2nd symposium on large-scale digital calculating machinery, Harvard University Press, Cambridge. [ Links ]
Margo Commission, 1987, Report of the commission of inquiry into the tax structure of the Republic of South Africa (Chairman: C.S. Margo), RP34/1987, Government Printer, Pretoria. [ Links ]
Musgrave, R.A., 1987, 'Short of euphoria', The Journal of Economic Perspectives (1986-1998) 1(1), 59. https://doi.org/10.1257/jep.1.1.59 [ Links ]
National Treasury, 2017, Budget review, Department of Finance, Pretoria. [ Links ]
Ntsongwana, P., Wright, G. & Noble, M., 2010, Supporting lone mothers in South Africa: Towards comprehensive social security, viewed 18 April 2018, from http://www.casasp.ox.ac.uk/docs/Lone%20Mothers%20and%20Co mprehensive%20Social%20Security.pdf [ Links ]
OECD, 2010, Tax policy reform and economic growth, OECD Publishing, viewed 19 April 2018, from https://doi.org/10.1787/9789264091085-en. [ Links ]
Peichl, A. & Schaefer, T., 2009, 'FiFoSiM - An integrated tax benefit microsimulation and CGE model for Germany', International Journal of Microsimulation 2(1), 1-15. [ Links ]
Peter, K.S., Buttrick, P. & Duncan, D., 2010, 'Global reform of personal income taxation 1981-2005: Evidence from 189 countries', National Tax Journal 63(3), 447-478. https://doi.org/10.17310/ntj.2010.3.03 [ Links ]
Roller, M. & Schmidheiny, K., 2016, Effective tax rates and effective progressivity in a fiscally decentralized country, CESifo working paper no. 5834, Center for Economic Studies and Ifo Institute (CESifo), Munich. [ Links ]
Saunders, P., 2007, Taxploitation: The case for income tax reform, The Centre for Independent Studies, Sydney. [ Links ]
Sautory, O., 1993, La macro CALMAR: Redressement d'um echantillion par calage sur marges, Working paper no F9310, Institut National de la Statistique et des Etudes Exconomiques, Paris. [ Links ]
Saez, E., 2003, 'The effect of marginal tax rates on income: A panel study of bracket creep', Journal of Public Economics 87(5-6), 1231-1258. https://doi.org/10.1016/S0047-2727(01)00178-5 [ Links ]
South African Reserve Bank (SARB), 2017, Various issues of the quarterly bulletin, SARB, Pretoria. [ Links ]
Statistics South Africa (Stats SA), 2008, Income and expenditure of households 2005/2006: Statistical release P01001, Statistics South Africa, Pretoria. [ Links ]
Steenekamp, T.J., 2012b, 'The progressivity of personal income tax in South Africa since 1994 and direction for tax reform', Southern African Business Review 16(1), 39-57. [ Links ]
Tanzi, V. & Zee, H., 2001, Tax policy for developing countries, Economic Issues, 27, International Monetary Fund, Washington, DC. [ Links ]
Tax Statistics, 2017, 2017 Tax Statistics, National Treasury and the South African Revenue Service, Pretoria. [ Links ]
The Davis Tax Committee, n.d., Publication of 4 final reports, viewed 28 April 2018 from http://www.taxcom.org.za. [ Links ]
United States Agency for International Development (USAID), 2010, The United States Agency for International Development homepage, viewed 22 April 2012, from http://egateg.usaid.gov/collecting-taxes [ Links ]
World Bank, 1991, Lessons of tax reform, The World Bank, Washington, DC. [ Links ]
World Bank, 2011, World development indicators 2011, viewed n.d., from http://siteresources.worldbank.org/DATASTATISTICS/Resources/wdi_ebook.pdf [ Links ]
 Correspondence:
Yolande Jordaan
yolande.jordaan@live.co.za
Received: 18 Aug. 2016
Accepted: 26 July 2018
Published: 30 Oct. 2018
1 . 2005: R33 176*10/12+2006: R36 844*2/12.

