


Services on Demand
Article
 English (pdf)
 Article in xml format
 Article references
Indicators

Related links
-
 Cited by Google
 -
 Similars in Google
Share

 Permalink
South African Journal of Economic and Management Sciences
On-line version ISSN 2222-3436
Print version ISSN 1015-8812
S. Afr. j. econ. manag. sci. vol.21 n.1 Pretoria 2018
http://dx.doi.org/10.4102/sajems.v21i1.1968
ORIGINAL RESEARCH
How efficient is the Johannesburg Stock Exchange really?
André HeymansI; Leonard SantanaII
IDepartment of Risk Management, School of Economics, North-West University, South Africa
IISchool of Mathematical and Statistical Sciences, North-West University, South Africa
ABSTRACT
BACKGROUND: There are various studies that confirm the efficiency of the Johannesburg Stock Exchange (JSE), implying that there are no opportunities for active portfolio managers to earn excess returns over the long run.
AIM: The aim of the research is to prove that the sub-indices on the JSE go through cycles of efficiency and inefficiency even though the JSE as a whole might be considered informationally efficient
SETTING: Although the JSE as a whole can be considered to be weak-form efficient, portfolio managers are not bound to investing in large liquid stocks alone. Many aggressive funds allow managers to also allocate a portion of their portfolio to smaller stocks. This has implications when considering the efficiency of the stocks being selected.
METHODS: Given the impact efficiency has on portfolio selection, we test for the adaptive market hypothesis using a representative sample of stock indices by means of the automatic variance ratio test, the Chow-Denning joint variance ratio and the joint sign test on the JSE.
RESULTS: Our results confirm that some of the smaller, and in some instances younger, indices are not always as efficient as the all share index, thus allowing portfolio managers with an active management approach some opportunities to profit from informational inefficiencies in the market.
CONCLUSION: The practice of active management by portfolio managers in the South African market seems to defy logic if one considers the fact that the JSE as a whole is at the very least weak-form efficient. By proving that some of the sub-indices that make up the all share index are inefficient most of the time, this article shows that the phenomenon of active portfolio managers is less of a surprise.
Introduction
Testing for market efficiency is an age-old quest. The first major test to this effect was performed by Bachelier (1900) when studying the mathematical theory of random processes. He speculated that the movement of stock prices followed a Brownian motion and are, by implication, unpredictable. Since this is difficult to test, it was not until 1953 that Maurice Kendall and Austin Hill documented that stock and commodity prices move randomly.
Market efficiency, as formalised by Eugene Fama's seminal paper on efficient capital markets in 1970, is generally used to refer to informational efficiency. Under this hypothesis, markets are generally believed to act as effective clearing places that quickly and correctly reflect current security prices. Although intuitively appealing, the efficient market hypothesis (EMH) has been under attack since the mid-1970s. A new body of research began to form as many researchers began to point out that certain anomalies cannot be explained by the EMH. In fact, the literature between the 1970s and late 1990s is littered with proof of market anomalies. The most prominent of these behavioural finance anomalies are: the seasonality in stock returns, the existence of dividend yields and earnings yields in stock returns, the impact of macroeconomic factors on stock returns, the presence of autocorrelation in stock returns and size-related anomalies. Each of these anomalies has been documented in detail and comprises several hundred papers on each anomaly.
The attack on the EMH also came from psychologists and experimental economists who documented a number of specific behavioural biases that are common in human decision-making under circumstances of uncertainty. To this end, prominent studies were performed on the impact of overconfidence on the outcome of investment decisions (e.g. Barber & Odean 2001), as well as the impact of overreaction (see De Bondt & Thaler 1985), loss aversion (see Kahneman & Tversky 1979), regret (see Bell 1983), psychological accounting (see Tversky & Kahneman 1981) and herding (see Huberman & Regev 2001). This field of research is in direct contrast with the EMH, proposing that investors are often irrational, and that all people, and thus all investors, exhibit predictable behaviour.
The supporters of the EMH were, however, also active in this period. In his seminal review, Fama (1970) surveyed the empirical evidence for the weak form, semi-strong form and strong form EMH. In 1991, Fama conducted a second review of the market efficiency literature using variables such as the dividend price ratio, earnings price ratio, book-to-market ratio and several measures of interest rates. Although his review shows mounting evidence of return predictability from past returns, dividend yields and a number of term-structure variables, he argues that these findings might be spurious and should be met with scepticism.
The supporters of behavioural finance, however, remain convinced that markets are not as efficient as Fama (1991) claims. The 1990s saw a great number or works still disputing market efficiency, prompting Eugene Fama to publish yet another review on market efficiency in 1998, this time on the sustainability of anomalies in the long run. Here Fama (1998) argues that overreaction occurs as often as under-reaction and that post-event continuation of pre-event abnormal returns is almost as frequent as post-event reversals. Fama (1998) also asserts that most of the long-term anomalies in the literature disappear as different techniques are employed to test for them.
It is only in the early 2000s that the concept of varying market efficiency seems to have brought about some respite in the almost 40-year feud between the staunch EMH supporters and the behavioural finance contestants. Emerson, Hall and Zalewska-Mitura (1997), for example, track the evolution of market efficiency over time by employing a multifactor model with time-varying autocorrelation coefficients and generalised autoregressive conditional heteroskedasticity (GARCH) errors. They gauge the degree of return predictability, and therefore inefficiency, by observing whether the time-varying autocorrelation coefficient estimates stabilise over time or not. This study was a definitive break from the concept of testing whether markets are either efficient or inefficient.
Zalewska-Mitura and Hall (1999) took this idea further and attempted to quantise the movement towards efficiency by employing a multifactor model with time-varying autocorrelation coefficients and the GARCH-M method. Their work is seen as the formalisation of the tests for evolving efficiency (TEE). Similar tests for evolving efficiency were also done on the developing markets of central and Eastern Europe (Zalewska-Mitura & Hall 2000), Africa (Jefferis & Smith 2004, 2005) and China (Li 2003a, 2003b).
This research was the first move in the direction of combining the beliefs of the likes of Fama and those of the behavioural finance supporters. Lo (2004, 2005) builds on the concept of changing efficiency over time by comparing the market to a living organism that adapts to a changing environment. In his seminal paper, Lo (2004) goes on to explain that markets are forever changing and that market participants will always aim to adapt equally fast to these changes. There are, however, periods when market participants are incorrect about the underlying fair value of certain assets and that it is during these periods that markets move away from their efficient behaviour.
The research that followed on from Lo (2004) concentrated on retesting the efficiency of markets in a moving time-frame paradigm. As such, some recent advances under TEEs will be discussed in the next section. What is, however, not prevalent in the literature is the evolution of market efficiency over time for smaller sub-indices. Understanding the flow of information in smaller indices is critical in understanding the behaviour of portfolio managers following an active management approach. Because active portfolio managers often also invest in smaller or less familiar stocks, it is important to determine the link between market efficiency and these less familiar stocks. Mainstream research often focuses on stock indices that represent the most liquid and largest stocks. It is, therefore, often the case that these markets are found to be efficient. Portfolio managers are, however, in the position to invest in smaller stocks as well, and they often do. The effects these stocks have in bigger indices then disappear in efficiency tests. The reason these effects are more prominent in smaller stocks is because information is not as abundant as it is in larger stocks (Lakonishok, Shleifer & Vishny 1992). As such, there are a number of factors that obstruct the flow of information.
Smaller stocks suffer from illiquidity that affects the market's capacity to accommodate orders (Chordia, Roll & Subrahmanyam 2005), and since a low degree of competition results in the presence of dominant players, it is easy for active market participants to deal in large enough quantities and so cause stock prices to deviate from their intrinsic value. The general lack of market transparency for smaller stocks - as reflected by corporate information scarcity and low auditing experience - also result in truncated fundamental information (Lakonishok et al. 1992).
These informational and other inefficiencies are to the knowledge of the authors not yet explored in a varying efficiency framework for smaller sub-indices on the Johannesburg Stock Exchange (JSE). This is important from a portfolio manager's point of view, since excess returns might be generated if they concentrate their efforts on dealing in more predictable stocks only. This research will consequently aim to provide clarity on this issue and so add to the growing body of knowledge under the adaptive market hypothesis (AMH). The remainder of this article will discuss the background of the TEE next, followed by a description of the data and methods used in the third and fourth sections. The results are reported in the fifth section and the sixth section will conclude.
Tests for evolving efficiency
In weak-form efficient markets, returns are not predictable since price changes are random and they fully reflect all of the available information in the market. This explanation of the market can be best described by the random-walk hypothesis (RWH). The literature on the existence of autoregressive conditional heteroscedasticity (ARCH) effects in stock returns data is, however, also prevalent, thus opening the door for the extensive testing of dependence in the higher moments of stock data.
To date, the main approach for testing for these dependencies was based on absolute efficiency, where markets are defined as either efficient or not, by means of tests for the random walk or for the martingale hypothesis over a single period. More recently, a number of studies set out to analyse changes in efficiency over time by either applying absolute efficiency tests for separate time periods (e.g. Borges 2011), using a fixed-length rolling window (e.g. Kim & Shamsuddin 2008) or testing for changing efficiency with GARCH-in-mean models with time-varying parameters (see Jefferis & Smith 2005).
This new strand of research is based on the work of Andrew Lo. The AMH was first formalised by Lo (2004) as an explanation for the seemingly adaptive nature of markets. Lo goes on to explain how the degree of market efficiency is similar to an ecological system, in that market participants are constantly faced with changing circumstances to which they must adapt. It is this adaptation that leads to, among other things, varying efficiency across time and markets (Lo 2005). The AMH does not, therefore, propose that the EMH is wrong, but merely that it is incomplete (Lo 2012).
After Lo's (2004) proposition that markets are not either efficient or not, but rather go through cycles of inefficiency, a number of studies set out to find evidence of these changes in efficiency over time. To this end Kim, Shamsuddin and Lim (2011) analysed the Dow Jones Industrial Average index (DJIA) between 1900 and 2009 and found cycles of inefficiency occur mostly over periods of economic shocks. This result was confirmed by Lim, Luo and Kim (2013) who tested for return predictability on the DJIA, the S&P 500 Composite Price Index and the NYSE Composite. By testing for efficiency on a rolling window basis on 11 Middle Eastern stock markets, Niemczak and Smith (2013) also found periods of efficiency followed by periods of inefficiency.
Some research also set out to provide more clarity on the degree to which some markets are more or less efficient than others. Under this strand of research, Lim (2007) ranks several markets according to efficiency and found the United States (US), Korea and Taiwan to be some of the most efficient markets and that Malaysia, Chile and Argentina are relatively less efficient. Lim and Brooks (2010) found similar results and report that developed markets are relatively more efficient, most of the time, and that developing markets depart from efficiency on a more regular basis. Smith (2012) tested for the martingale hypothesis on a rolling basis for 15 emerging European stock markets and compared it to the developed markets of Greece, Portugal and the United Kingdom (UK), and found the most efficient markets to be in Turkey, the UK, Hungary and Poland, while the least efficient are in the Ukraine, on Malta and in Estonia. Jefferis and Smith (2005) and Smith and Dyakova (2013) also tested for relative efficiency, but on the lesser developed African markets. They too found that the relatively more developed Egyptian and South African markets are more efficient when compared to the less developed markets of Kenya and Zambia.
Given the international evidence from the literature, it is clear that markets, and indeed sub-divisions within markets, are all subject to cycles of efficiency, followed by cycles of inefficiency. Should these cycles exist within a particular market, it might add to our understanding of the discrepancy between practice and theory insofar as the existence and, indeed, the success of fund managers following an active management style are concerned. So, can we reconcile practice and theory by shedding more light on the microstructure of a frontier market such as the JSE?
Data
Daily index values are used to test for varying efficiency on the JSE. All the data are sourced from the INET BFA database and span a period between 03 July 1997 and 03 March 2015 (4415 daily observations). We have not included each and every index listed on the JSE, since some indices are only available later - some as late as 2008. The indices covered are, however, all available from the same date. The data were transformed by means of Miller, Muthuswamy and Whaley's (1994) proposed method for removing thin trading effects, and converted to daily returns for testing with the automatic variance ratio (AVR), Chow-Denning joint variance ratio (JM) and joint sign (JS) tests.
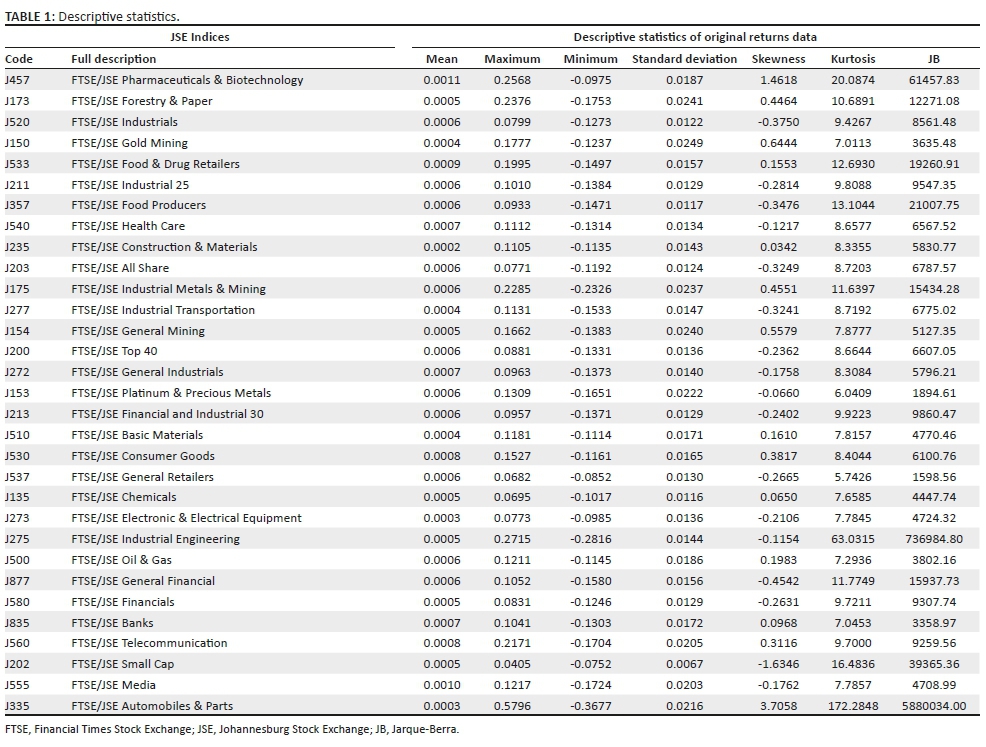
All the indices have positive average returns. This is not surprising given that the JSE all share index grew by 695% over this period. Of the 31 indices, 17 are negatively skewed and all the series are leptokurtic. When interpreting the Jarque-Berra (JB) test in Table 1, it is also clear that none of the original data series is normally distributed. Although not included here, all the white tests performed for conditional heteroskedasticity rejected the null hypothesis of homoskedasticity for all the indices listed here.
Methodology
Since the methodology for testing market efficiency can influence the findings, it is prudent to ensure that robust tests are used. The test Andrew Lo used for proving the AMH in 2004, was a simple rolling first order autocorrelation test on monthly returns data. After Lo (2004, 2005), a number of studies started to explain their results in terms of the AMH, and introduced new methods to test for this hypothesis. Cajueiro and Tabak (2004) and Lim and Brooks (2010), for example, employ a rolling Hurst exponent to prove evolving efficiency, while Phengpis (2006) TEE based on a rolling augmented Dickey-Fuller unit root test. Lim (2007) makes use of a rolling bicorrelation test to measure serial dependence. He transforms the data by subtracting the sample mean from each data point and then dividing by the sample standard deviation. Lim asserts that market efficiency is visible under these conditions if the bicorrelation of each sub-sample is zero.
The most popular test for varying efficiency, however, remains the variance ratio (VR) test, as introduced by Lo and MacKinlay (1988). They asserted that if stock prices follow a random walk, the variance of the k-period return should be equal to k times the variance of the one-period return. This means that the VR should be equal to 1 for any holding period k, under the null hypothesis of serially uncorrelated stock returns.
Chow and Denning (1993) expanded on Lo and MacKinlay's (1988) VR test to provide a procedure for the multiple comparison of the set of variance ratio estimates. Another improvement on Lo and MacKinlay's (1988) VR test came from Wright (2000) who tested the null that a series is a martingale difference sequence (MDS) by using the ranks and signs of a time series to form VR tests. Because these tests can be exact, they have better power properties than the test applied by Lo and MacKinlay (1988).
Wright's (2000) sign-based VR test starts out with the assumptions that the sign (St) is an independent and identically distributed sequence with zero mean and unit variance that takes the value −1 and 1 with equal probability. He posits that for any series xt, u (xt, q) would be equal to 1 = (xt > q) - 0.5. In this instance u(xt, 0) is 0.5 if xt is positive and −0.5 otherwise. This means that St is equal to 1 with probability 0.5 and is −1 otherwise. Under these conditions, St is generated by a MDS, and the VR test for signs can be given as (Wright 2000):
Although this is an improvement on Lo and MacKinlay's (1988) VR test, this modified sign version test still suffers size distortions when they are sequentially applied at several k values. In order to solve this, Kim and Shamsuddin (2008) proposed multiple-sign VR tests, based on Wright's (2000) original rank- and sign-based tests. They also applied p-value adjustments for multiplicity with the assumption that the test statistics computed at different intervals are uncorrelated.
In order to test for the joint null hypothesis (as proposed by Chow & Denning 1993) that V(ki) = 1 for i= 1,…,l against the alternative hypothesis that V(ki) ≠ 1 for some holding period ki, Kim and Shamsuddin (2008) takes Wright's (2000) idea of a sign-based test to change the Chow and Denning (1993) test to Equation 2:

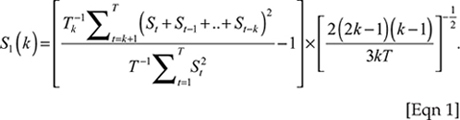
The JS statistic has an exact sampling distribution, and its critical values can be obtained by simulation in a similar way to that of S1(k) given in Equation 1. The null hypothesis is rejected when the observed JS statistic is greater than the critical value. Kim and Shamsuddin (2008) also employ multiple VR tests, based on the wild bootstrap method, and make use of Monte Carlo simulations to prove that these non-parametric tests have superior small sample properties when compared to the conventional Chow-Denning test.
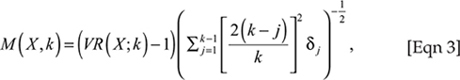
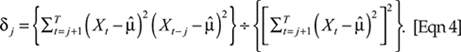
Kim (2006), on the other hand, improved on the Lo and MacKinlay (1988) test by employing a wild bootstrap to obtain p-values instead of using a regression process to solve for the multiplicity problem in small samples. The Lo and MacKinlay test used by Kim is shown in Equations 3 and 4:
Kim (2006) also improved on the Chow and Denning (1993) test by employing a wild bootstrap method. The test by Chow and Denning has the null hypothesis that V(ki) = 1 for i= 1,…,l The test statistic can be written as 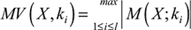 , which asymptotically follows the studentised maximum modulus distribution with land T degrees of freedom under assumption H* of Lo and MacKinlay (1988).
Kim's (2006) wild bootstrap version of the Chow-Denning test is performed in three stages. During stage 1, a bootstrap sample is formed of T observations  where ηt is a random sequence with E(ηt) = 0 and
  . In stage 2, the MV(X, ki) statistic obtained from the bootstrap sample is used to calculate MV*as follows: MV* ≡ MV(X*, ki). During stage 3, the first two stages are repeated enough times to form a bootstrap distribution of the test statistic
  . The p-value of this test is the proportion by which
  exceeds the sample value of MV(X, ki).
The wild bootstrap version of the Lo and MacKinlay (1988) test can be implemented in a similar manner to a two-tailed test, where MV* ≡ MV(X*, k) is obtained in stage 2 and  in stage 3. Conditionally on
  is a serially uncorrelated sequence with zero mean and variance
  , which is a special case of assumption H* of Lo and MacKinlay (1988). MV* and M* therefore have the same asymptotic distributions as MV(X, k) and M (X*, k). Since
  is a serially uncorrelated sequence, wild bootstrapping approximates the sampling distributions under the null hypothesis. The test statistics being bootstrapped are pivotal asymptotically, under the condition that Xt follows a MDS, therefore satisfying assumption H* of Lo and MacKinlay.
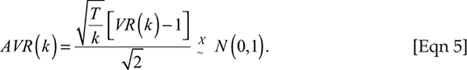
However, when using the Chow and Denning (1993) type joint VR tests, a set of holding periods must be chosen. It is therefore important to select an optimal value of Xsince the specific set of values selected can affect the power of the tests. Choi's (1999) AVR test solves this by using a data-dependent method to select the optimal value of X. Choi showed that under the null hypothesis of no serial correlation in the returns series, the test statistic is calculated through Equation 5:
As pointed out by Kim (2009), however, Choi's (1999) AVR test still exhibits size distortions under conditional heteroskedasticity, and since all the JSE index returns data are heteroskedastic in nature, this must be accounted for by the model. To solve for these size distortions, Kim suggested that Choi's AVR test can also be improved by applying the wild bootstrap method. This improves Choi's test, providing more power against a wide range of both linear and non-linear models with no size distortion (Charles, Darné & Kim 2011:153).
The wild bootstrap version of Choi's (1999) AVR test is performed in the same manner as the wild bootstrap versions of Chow and Denning's (1993) VR test and Wright's (2000) sign-based test. As before, the estimated p-value is the proportion by which the absolute values of the bootstrap distribution  exceed the absolute value of
  as calculated from the returns series Xt.
For the purpose of this study, the wild bootstrap VR test of Kim (2006), the JS test of Kim and Shamsuddin (2008) and the AVR test of Kim (2009) will be employed since they provide the best defence against the size distortion and allow for the testing of varying efficiency. In order to measure the varying nature of efficiency, we make use of the rolling window approach followed by Lim (2007), Lim and Brooks (2010) and more recently Smith and Dyakova (2013), as well as Verheyden, De Moor and Vanpée (2016). This approach uses the percentage of subsamples that rejects the martingale null hypothesis on a rolling basis with the three tests identified above. By doing this, it is possible to compile an indicator for relative predictability. A higher average percentage of rejections over the three tests indicates higher predictability in the data, while a lower average percentage indicates less predictability and, therefore, market efficiency.
The length of the rolling windows for each index under investigation is 500 observations. This window length was also used by Smith (2012) and Lim et al. (2013), who provide evidence that a 500-observation window is sufficiently short to detect short-horizon predictability, while being long enough to still have good power and size properties. The wild bootstrap VR test of Kim (2006), the JS test of Kim and Shamsuddin (2008) and the AVR test of Kim (2009) also suffer no size or power issues with 500 observations (see the evidence of Monte Carlo tests performed by Kim and Shamsuddin 2008; Kim 2009; Charles et al. 2011).
These tests are, however, all testing for some form of predictability in the data based on the autocorrelation in returns, something that will also be displayed naturally in thinly traded data.1 This incorrect assumption of auto correlated data can easily lead to the conclusion that the market is not efficient when, in fact, it might be. Since the problem of thin trading is especially prevalent in developing country data, this study will address this before continuing to test for efficiency. This will be done by following Miller et al.'s (1994) proposed method for removing thin trading effects. Their method has been widely used for emerging stock markets (e.g. Al-Ajmi & Kim 2012; Bley 2011; Loc, Lanjouw & Lensink 2010). In order to remove thin trading effects, Miller et al. make use of a moving average model that reflects the number of non-trading days. However, since it is difficult to identify non-trading days, they showed that an equivalent adjustment can be obtained with the following AR (1) model:

In Equation 6, Xt is one-period returns estimated by an ordinary least squares (OLS) process. The residuals, εt and estimated coefficient,  , are then used to obtain the returns corrected for thin trading as follows:

 in Equation 7 is the returns corrected for thin trading. To adjust for the changes in thin trading over time, Equation 6 will be run by a recursive least squares process, and the corrected recursive estimates are used in Equation 7. Autocorrelation in the corrected returns will now be an indication of return predictability, and therefore market inefficiency.
Results
As mentioned above, we tested for the percentage of subsamples that rejects the martingale null hypothesis on a rolling basis with the AVR, JM and JS tests. The first window started on 03 July 1995 and ended on 02 July 1997, and holding periods of 2, 5, 10, 20 and 40 are used for all the tests. Each of the three tests are therefore performed on 500 data points, after which the window is moved on by one observation. The final window thus started on 01 March 2013 and ended on 03 March 2015.
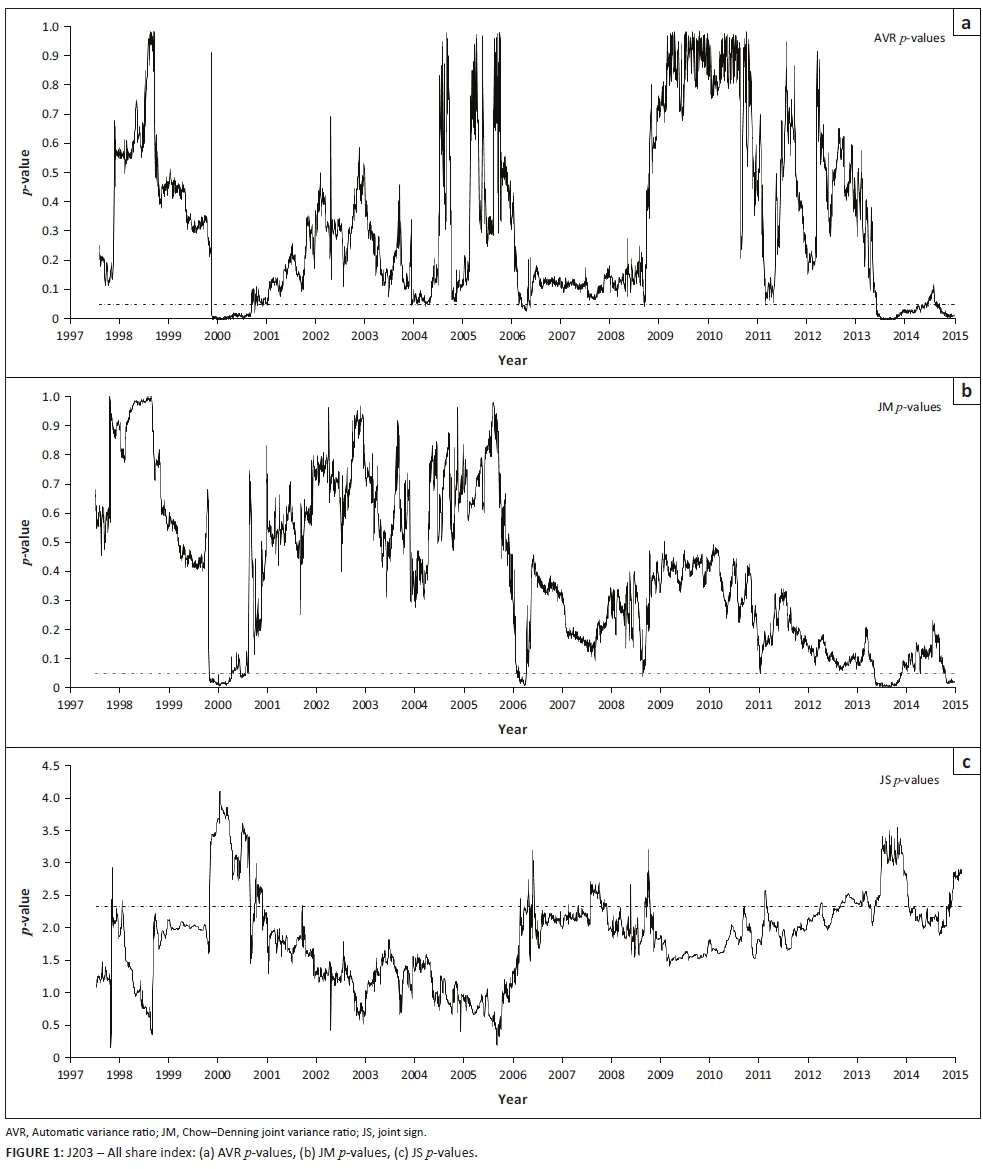
Each of the tests will, therefore, display when a specific index was efficient, by indicating when the martingale hypothesis holds and when not. When testing for market efficiency by means of the AVR and JM tests, p-values below the 5% significance level (the horizontal dotted line in each of the graphs) leads to a rejection of the martingale hypothesis, implying inefficiency in the market or return predictability. For the JS test, a test statistic above the 5% critical value will lead to a rejection of the martingale hypothesis, thus indicating inefficiency or return predictability. The market efficiency of each index will therefore be displayed as a dynamic state, indicating how efficiency evolves over time. Each date on the graph displays the state of efficiency at that point, based on the previous 500 observations. Figure 1 displays the results of selected indices (the all share index, the Top 40 index, gold mining index, financials index and small cap index).2
From Figures 1 through 5, it is clear that the sub-indices on the JSE move rapidly between states of efficiency and inefficiency. All of the indices tested display periods of market efficiency, followed by periods of market inefficiency, thus conforming to the AMH as described by Lo (2004). The three tests also corroborate each other. For most of the indices, p-values above the 0.05% critical value for the AVR and JM tests indicate market efficiency for the time frames that the JS statistic spends time below the critical value, indicating market efficiency. This is especially prominent for the all share index where market inefficiency seems to be present for the periods leading up to the years 2000, 2006 and 2014. This trend is also reflected in some of the other indices. The small cap index, for example, experiences inefficiency over the years 2000, 2006 and 2014, but also for a considerable time before and after.
Although there might be many reasons for this fluctuation in efficiency, the value of these tests is in the comparison between indices. As expected, some indices are also clearly more efficient than others. It is not surprising then that the all share index is not the most efficient of the indices tested. The all share index represents all the stocks traded on the main board, and will therefore also reflect the relative efficiency of less efficient stocks. The overall percentage of the three tests over the full period (13.08% between 1997 and 2015) also compares well with the result of Smith and Dyakova (2013) who reported 15.73% between 1998 and 2011. The all share index therefore shows improved efficiency when observing it over the longer time frame and when considering newer data. This result, too, corroborates previous findings that developing markets become more efficient over time (see Cajueiro & Tabak 20043).
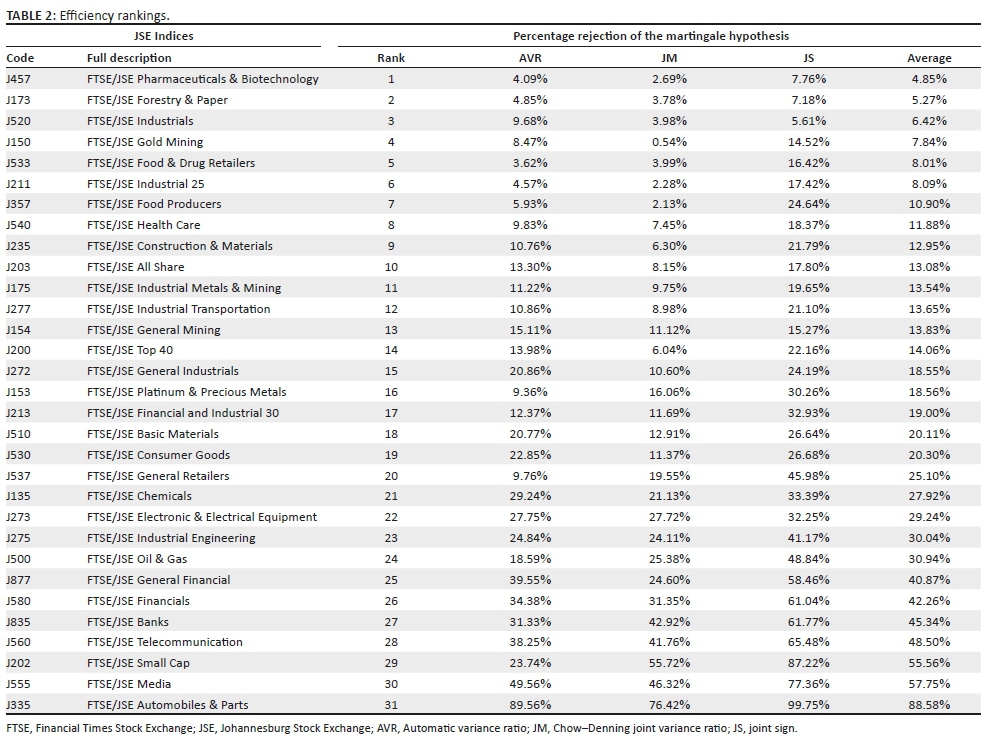
To appreciate how drastically the levels of efficiency differ among the sub-indices, the results are ranked after combining the results of the AVR, JM and JS tests. By calculating the total number of rolling windows that reject the martingale null hypothesis, it is possible to compile an indicator for relative predictability. A lower average percentage of rejections over the three tests will then indicate less predictability in the data and thus more efficient data. A higher average percentage indicates more predictability and therefore market inefficiency. Table 2 reports the rankings of indices based on their relative efficiency.4
The results in Table 2 are ranked from most efficient to least efficient. Once the different indices are compared with one another, it becomes apparent that not all the sub-indices on the JSE are equally efficient. Although there are a number of surprising results, most of the indices rank how one would suppose they should. It is expected, for example, that the older indices - like forestry and paper, gold mining and industrials - should be fairly efficient by now. Some stocks in the gold mining and forestry and paper indices have been listed for more than 100 years, and market participants are therefore well aware of their potential growth, as well as the fundamental forces that drive their stock prices. Analysts have also been reporting on these stocks for a long time, allowing market participants to form an informed opinion on what these stocks would be worth at any given time (Gleason & Lee 2003).
It should then not be surprising that telecommunication, small caps and the media indices would rank on the less efficient, and therefore more predictable, side of the scale. Telecommunication is a relatively young index5, consisting of a few major companies (Telkom, MTN and Vodacom). The telecommunication industry was long controlled by the South African government, and Telkom only listed officially in 2003, while MTN listed in 1995 and Vodacom in 2009. It is further no surprise that the small cap index displays market inefficiency. Smaller companies are not as well researched by market analysts, leading to truncated fundamental information and, therefore, more predictable behaviour (Hong, Lim & Stein 2000). Although the media index displays a fair amount of liquidity6 it is still one of the most predictable indices on the JSE. Upon closer inspection, this predictability can be explained by the growth of Naspers that makes up more than 99% of the index based on capitalisation. Naspers grew by more than 2050% between 2005 and 2015, resulting in a very strong underlying trend in the data. Since all three tests are designed to test for serially uncorrelated returns, it explains why the media index, and indeed any series that exhibits such strong underlying trends, will be deemed inefficient.
Age and the coverage of analysts are, however, not the only determinants of efficiency. In essence, these tests for efficiency would naturally rank data as more efficient if the time series is made up of data that follow a random walk. Data that follow more well defined trends will then naturally be defined by the tests as less efficient. The most inefficient index - automobiles and parts - lost 89.99% of its value between 02 February 1996 and 28 March 2001. The index then gained 1568% in value from 28 March 2001 to 28 February 2014, thus making for very predictable data, which was consequently found in the results.
This trend is also visible in the other inefficient indices. The general financial index gained 281% between 28 March 2001 and 28 February 2014, while the growth of the other indices over the same period was 261% for the financials index, 322% by banks, 843% by telecommunication, 871% by small caps and 6829% by media.
Not all the results are that easily explained though. The VR tests reject the martingale hypothesis 0.98% of the time less for Top 40 index when compared to the all share index. Although the difference is not great, this is fairly surprising, given that almost all of the stocks in the Top 40 index are followed closely by market analysts. These stocks also form part of most fund managers' portfolios, and are very liquid when compared to the rest of the stocks being traded on the JSE (Fang & Peress 2009). One would, therefore, expect the Top 40 index to be more efficient than the all share index. This result might be explained by the same means as before, in that the Top 40 index consists of a small number of very large companies, and that these companies experienced very pronounced trends over the period under observation.
Another surprise result is the relative predictability of the bank index. South Africa has one of the most sophisticated financial systems in the world, and although this contributes little to the informational efficiency of the stock prices, its inefficient nature is an unexpected result. Some of the banks are also very old - Standard Bank for example has been operating in the country for more than 150 years. The fact that the banking sector is dominated by the big four banks also fails to explain this apparent lack of informational efficiency. Upon closer inspection, however, it is clear that the four big banks - namely Standard Bank, Barclays Group Africa, Nedbank and First Rand Group - are highly correlated.7 With the exception of Nedbank, all the banks have seen a steady increase in their stock prices from the start of the period under consideration. All four banks peaked in June 2007, reached a bottom in March 2009 and continued their upward momentum into 2015. This long-term upward momentum, coupled with the dominance of these four banks, might go some way to explaining the relative inefficiency of the bank index. It seems then that inefficiency in this instance can partly be explained when market participants in certain indices act in unison based on clear market signals - such as those in a crisis. Market efficiency tends to break down over times of crisis (Anagnostidis, Varsakelis & Emmanouilides 2016; Horta, Lagoa & Martins 2014; Lim, Brooks & Kim 2008).
Overall, the results are mostly in line with the current literature. The all share index is, at the very least, weak-form efficient 13.08% of the time, as reported by Smith and Dyakova (2013). This efficiency also changes over time, conforming to the AMH as found by Lo (2004, 2005) and for the JSE by Jefferis and Smith (2005) and Smith and Dyakova (2013). The fact that the small cap index and some of the other less known indices are more predictable than the all share and Top 40 indices is also in line with the research of Jefferis and Smith (2004) who gave a number of reasons for this result. Although Jefferis and Smith give a range of reasons for this phenomenon, the most prominent are the availability of information, size of the market, size of the individual stocks and the diversity of activities the company is involved in.8
The implications of these findings are that portfolio managers with an active management approach would therefore find opportunities to profit from informational inefficiencies in the market. The fact that the all share index is informationally efficient most of the time leads many studies to conclude that this was and will not be possible. However, save for index tracking funds, portfolio managers do not invest in the all share index per se, but have some subset of stocks in their equity portfolios.9It should, therefore, be logical that they will be invested in stocks that are informationally efficient at times, but also in stocks that are not. This is clear when considering our results. Should portfolio managers hold a portfolio that consists of banks, telecommunications stocks, media stocks and other small capitalisation stocks for example, they would be invested in a portfolio that is informationally inefficient more often than not. Although this is not something that portfolio managers can take advantage of directly, it should be possible to make use of momentum, value, or other trading strategies with more success than would otherwise have been possible in more efficient markets. Finding portfolios that outperform the general market on a risk-weighted basis should, therefore, not be seen as an anomaly, but rather as a logical consequence of the varying efficiency paradigm.
Conclusion
By testing for the martingale hypothesis by means of rolling window VR tests, we established that the JSE all share index is weak-form efficient and that all the indices tested move from periods of efficiency to periods of relative predictability. This result is in line with the literature on the AMH as proposed by Lo (2004, 2005). As expected, the indices consisting of older and more established companies are efficient more often than indices consisting of younger companies. The Top 40 index also ranks higher up the efficiency scale, while the small cap index ranks close to the bottom. It is therefore clear that the degree of predictability is related to size and liquidity, and that the indices consisting of stocks that are covered more regularly by market analysts tend to ranks higher on the efficiency scale ceteris paribus.
The fact that there are various indices that are fairly predictable, suggests that it would be possible for portfolio managers to follow an active management approach with some success. This informational inefficiency and therefore relative predictability is also persistent in some indices, thus indicating that market participants have not yet managed to get to grips with the drivers of stock prices in these indices.
These findings speak not only to the JSE, but transcend any market with similar characteristics. Fund managers following an active management style might thus make use of varying efficiency in any market given that there will always be new indices, smaller firms, and both firms and indices not covered extensively by market analysts, regardless of the age and sophistication of that market.
Given the varying efficiency displayed in the JSE index data, the next question that needs answering is whether Samuelson's dictum10 holds for this market. If individual stock prices are more efficient than the indices they make up, the JSE would be no different from developed markets such as the US stock market in this respect.
Acknowledgements
Competing interests
The authors declare that they have no financial or personal relationships that may have inappropriately influenced them in writing this article.
Authors' contribution
A.H. was the project leader, while L.S. was responsible for the statistical analysis after which A.H. wrote the manuscript and was responsible for the final editing.
References
Anagnostidis, P., Varsakelis, C. & Emmanouilides, C.J., 2016, 'Has the 2008 financial crisis affected stock market efficiency? The case of Eurozone', Physica A: Statistical Mechanics and its Applications 447(1), 116-128. https://doi.org/10.1016/j.physa.2015.12.017 [ Links ]
Al-Ajmi, J. & Kim, J.H., 2012, 'Are Gulf stock markets efficient? Evidence from new multiple variance ratio tests', Applied Economics 44(14), 1737-1747. https://doi.org/10.1080/00036846.2011.554373 [ Links ]
Bachelier, L., 1900, 'Theorie de la Speculation, Gauthiers-Villars', Paris, Reprinted in English (translated by AJ Boness), in PH Cootner (ed.), The random character of stock market prices, pp. 17-78, MIT Press, Cambridge, MA. [ Links ]
Barber, B.M. & Odean, T., 2001, 'Boys will be boys: Gender, overconfidence, and common stock investment', The Quarterly Journal of Economics 116(1), 261-292. https://doi.org/10.1162/003355301556400 [ Links ]
Bell, D.E., 1983, Risk premiums for decision regret. Management Science 29(10), 1156-1166. https://doi.org/10.1287/mnsc.29.10.1156 [ Links ]
Bley, J., 2011, 'Are GCC stock markets predictable?', Emerging Markets Review 12(3), 217-237. https://doi.org/10.1016/j.ememar.2011.03.002 [ Links ]
Borges, M.R., 2011, 'Random walk tests for the Lisbon stock market', Applied Economics 43(5), 631-639. https://doi.org/10.1080/00036840802584935 [ Links ]
Cajueiro, D.O. & Tabak, B.M., 2004, 'Evidence of long range dependence in Asian equity markets: The role of liquidity and market restrictions', Physica A: Statistical Mechanics and its Applications 342(3), 656-664. https://doi.org/10.1016/j.physa.2004.05.034 [ Links ]
Charles, A., Darné, O. & Kim, J.H., 2011, 'Small sample properties of alternative tests for martingale difference hypothesis', Economics Letters 110(2), 151-154. https://doi.org/10.1016/j.econlet.2010.11.018 [ Links ]
Choi, I., 1999, 'Testing the random walk hypothesis for real exchange rates', Journal of Applied Econometrics 14(3), 293-308. https://doi.org/10.1002/(SICI)1099-1255(199905/06)14:3%3C293::AID-JAE503%3E3.0.CO;2-5 [ Links ]
Chordia, T., Roll, R. & Subrahmanyam, A., 2005, 'Evidence on the speed of convergence to market efficiency', Journal of Financial Economics 76(2), 271-292. https://doi.org/10.1016/j.jfineco.2004.06.004 [ Links ]
Chow, K.V. & Denning, K.C., 1993, 'A simple multiple variance ratio test', Journal of Econometrics 58(3), 385-401. https://doi.org/10.1016/0304-4076(93)90051-6 [ Links ]
De Bondt, W.F. & Thaler, R., 1985, 'Does the stock market overreact?', The Journal of Finance 40(3), 793-805. https://doi.org/10.1111/j.1540-6261.1985.tb05004.x [ Links ]
Emerson, R., Hall, S.G. & Zalewska-Mitura, A., 1997, 'Evolving market efficiency with an application to some Bulgarian shares', Economics of Planning 30(2-3), 75-90. https://doi.org/10.1023/A:1003053807165 [ Links ]
Fama, E.F., 1970, 'Efficient capital markets: A review of theory and empirical work', The Journal of Finance 25(2), 383-417. https://doi.org/10.1111/j.1540-6261.1991.tb04636.x [ Links ]
Fama, E.F., 1991, 'Efficient capital markets: II', The Journal of Finance 46(5), 1575-1617. https://doi.org/10.1111/j.1540-6261.1991.tb04636.x [ Links ]
Fama, E.F., 1998, 'Market efficiency, long-term returns, and behavioral finance', Journal of Financial Economics 49(3), 283-306. https://doi.org/10.1016/S0304-405X(98)00026-9 [ Links ]
Fang, L. & Peress, J., 2009, 'Media coverage and the cross-section of stock returns', The Journal of Finance 64(5), 2023-2052. https://doi.org/10.1111/j.1540-6261.2009.01493.x [ Links ]
Gleason, C.A. & Lee, C.M., 2003, 'Analyst forecast revisions and market price discovery', The Accounting Review 78(1), 193-225. https://doi.org/10.2308/accr.2003.78.1.193 [ Links ]
Hong, H., Lim, T. & Stein, J.C., 2000, 'Bad news travels slowly: Size, analyst coverage, and the profitability of momentum strategies', The Journal of Finance 55(1), 265-295. https://doi.org/10.1111/0022-1082.00206 [ Links ]
Horta, P., Lagoa, S. & Martins, L., 2014, 'The impact of the 2008 and 2010 financial crises on the Hurst exponents of international stock markets: Implications for efficiency and contagion', International Review of Financial Analysis 35(1), 140-153. https://doi.org/10.1016/j.irfa.2014.08.002 [ Links ]
Huberman, G. & Regev, T., 2001, 'Contagious speculation and a cure for cancer: A nonevent that made stock prices soar', The Journal of Finance 56(1), 387-396. https://doi.org/10.1111/0022-1082.00330 [ Links ]
Hull, M. & McGroarty, F., 2014, 'Do emerging markets become more efficient as they develop? Long memory persistence in equity indices', Emerging Markets Review18(1), 45-61. https://doi.org/10.1016/j.ememar.2013.11.001 [ Links ]
Jefferis, K. & Smith, G., 2004, 'Capitalisation and weak-form efficiency in the JSE securities exchange', South African Journal of Economics 72(4), 684-707. https://doi.org/10.1111/j.1813-6982.2004.tb00130.x [ Links ]
Jefferis, K. & Smith, G., 2005, 'The changing efficiency of African stock markets', South African Journal of Economics 73(1), 54-67. https://doi.org/10.1111/j.1813-6982.2005.00004.x [ Links ]
Jung, J. & Shiller, R.J., 2005, 'Samuelson's dictum and the stock market', Economic Inquiry 43(2), 221-228. https://doi.org/10.1093/ei/cbi015 [ Links ]
Kahneman, D. & Tversky, A., 1979, 'Prospect theory: An analysis of decision under risk', Econometrica 47(2), 263-291. https://doi.org/10.2307/1914185 [ Links ]
Kendall, M.G. & Hill, A.B., 1953, 'The analysis of economic time-series-part I: Prices', Journal of the Royal Statistical Society. Series A (General) 116(1), 11-34. https://doi.org/10.2307/2980947 [ Links ]
Kim, J.H., 2006, 'Wild bootstrapping variance ratio tests', Economics Letters 92(1), 38-43. https://doi.org/10.1016/j.econlet.2006.01.007 [ Links ]
Kim, J.H., 2009, 'Automatic variance ratio test under conditional heteroskedasticity', Finance Research Letters 6(3), 179-185. https://doi.org/10.1016/j.frl.2009.04.003 [ Links ]
Kim, J.H. & Shamsuddin, A., 2008, 'Are Asian stock markets efficient? Evidence from new multiple variance ratio tests', Journal of Empirical Finance 15(3), 518-532. https://doi.org/10.1016/j.jempfin.2007.07.001 [ Links ]
Kim, J.H., Shamsuddin, A. & Lim, K.P., 2011, 'Stock return predictability and the adaptive markets hypothesis: Evidence from century-long US data', Journal of Empirical Finance 18(5), 868-879. https://doi.org/10.1016/j.jempfin.2011.08.002 [ Links ]
Lakonishok, J., Shleifer, A. & Vishny, R.W., 1992, 'The impact of institutional trading on stock prices', Journal of Financial Economics 32(1), 23-43. https://doi.org/10.1016/0304-405X(92)90023-Q [ Links ]
Li, X.M., 2003a, 'China: Further evidence on the evolution of stock markets in transition economies', Scottish Journal of Political Economy 50(3), 341-358. https://doi.org/10.1111/1467-9485.5003006 [ Links ]
Li, X.M., 2003b, 'Time-varying informational efficiency in China's A-share and B-share markets', Journal of Chinese Economic and Business Studies 1(1), 33-56. https://doi.org/10.1080/1476528032000039730 [ Links ]
Lim, K.P., 2007, 'Ranking market efficiency for stock markets: A nonlinear perspective', Physica A: Statistical Mechanics and its Applications 376, 445-454. https://doi.org/10.1016/j.physa.2006.10.013 [ Links ]
Lim, K.P. & Brooks, R.D., 2010, 'Why do emerging stock markets experience more persistent price deviations from a random walk over time? A country-level analysis', Macroeconomic Dynamics 14(S1), 3-41. https://doi.org/10.1017/S1365100509090397 [ Links ]
Lim, K.P., Brooks, R.D. & Kim, J.H., 2008, 'Financial crisis and stock market efficiency: Empirical evidence from Asian countries', International Review of Financial Analysis17(3), 571-591. https://doi.org/10.1016/j.irfa.2007.03.001 [ Links ]
Lim, K.P., Luo, W. & Kim, J.H., 2013, 'Are US stock index returns predictable? Evidence from automatic autocorrelation-based tests', Applied Economics 45(8), 953-962. https://doi.org/10.1080/00036846.2011.613782 [ Links ]
Lo, A.W., 2004, 'The adaptive markets hypothesis: Market efficiency from an evolutionary perspective', Journal of Portfolio Management 30(5), 15-29. https://doi.org/10.3905/jpm.2004.442611 [ Links ]
Lo, A.W., 2005, 'Reconciling efficient markets with behavioral finance: The adaptive markets hypothesis', The Journal of Investment Consulting 7(2), 21-44. [ Links ]
Lo, A.W., 2012, 'Adaptive markets and the new world order', Financial Analysts Journal 68(2), 18-29. https://doi.org/10.2469/faj.v68.n2.6 [ Links ]
Lo, A.W. & MacKinlay, A., 1988, 'Stock market prices do not follow random walks: Evidence from a simple specification test', Review of Financial Studies 1(1), 41-66. https://doi.org/10.1093/rfs/1.1.41 [ Links ]
Loc, D.T., Lanjouw, G. & Lensink, R., 2010, 'Stock market efficiency in thin-trading markets: The case of the Vietnamese stock market', Applied Economics 42(27), 3519-3532. https://doi.org/10.1080/00036840802167350 [ Links ]
Miller, M.H., Muthuswamy, J. & Whaley, R.E., 1994, 'Mean reversion of Standard & Poor's 500 index basis changes: Arbitrage-induced or statistical illusion?', The Journal of Finance 49(2), 479-513. https://doi.org/10.1111/j.1540-6261.1994.tb05149.x [ Links ]
Niemczak, K. & Smith, G., 2013, 'Middle Eastern stock markets: Absolute, evolving and relative efficiency', Applied Financial Economics 23(3), 181-198. https://doi.org/10.1080/09603107.2012.714068 [ Links ]
Phengpis, C., 2006, 'Are emerging stock market price indices really stationary?', Applied Financial Economics 16(13), 931-939. https://doi.org/10.1080/09603100500386099 [ Links ]
Smith, G., 2012, 'The changing and relative efficiency of European emerging stock markets', The European Journal of Finance 18(8), 689-708. https://doi.org/10.1080/1351847X.2011.628682 [ Links ]
Smith, G. & Dyakova, A., 2013, 'African stock markets: Efficiency and relative predictability', South African Journal of Economics 82(2), 258-275. https://doi.org/10.1111/saje.12009 [ Links ]
Tversky, A. & Kahneman, D., 1981, 'The framing of decisions and the psychology of choice', Science 211(4481), 453-458. https://doi.org/10.1126/science.7455683 [ Links ]
Verheyden, T., De Moor, L. & Vanpée, R., 2016, 'Mutual fund performance: A market efficiency perspective', Investment Analysts Journal 45(1), 1-15. https://doi.org/10.1080/10293523.2015.1125058 [ Links ]
Wright, J.H., 2000, 'Alternative variance-ratio tests using ranks and signs', Journal of Business and Economic Statistics 18(1), 1-9. https://doi.org/10.1080/07350015.2000.10524842 [ Links ]
Zalewska-Mitura, A. & Hall, S.G., 1999, 'Examining the first stages of market performance: A test for evolving market efficiency', Economics Letters 64(1), 1-12. https://doi.org/10.1016/S0165-1765(99)00074-9 [ Links ]
Zalewska-Mitura, A. & Hall, S.G., 2000, 'Do market participants learn? The case of the Budapest Stock Exchange', Economics of Planning 33(1-2), 3-18. https://doi.org/10.1023/A:1003913725499 [ Links ]
 Correspondence:
André Heymans
andre.heymans@nwu.ac.za
Received: 05 June 2017
Accepted: 24 Aug. 2018
Published: 29 Oct. 2018
1 . The VR test of Kim (2006) tests for the null hypothesis of a MDS; the JS test of Kim and Shamsuddin (2008) evaluates the distribution of the signs of the underlying returns series, produced by a MDS, and the AVR test of Kim (2009) tests for a null hypothesis of no serial correlation in the returns series.
2 . Including all 31 indices is unnecessary since a complete ranking will be given in Table 2. The graphs are included to illustrate the general idea of evolving efficiency and to show how the final results were derived.
3 . Cajueiro and Tabak (2004) used the Hurst exponent to test for long memory on a rolling window basis in 11 emerging markets between 1992 and 2002.
4 . Table 2 reports the ranking of the different indices from most informationally efficient to least efficient after the returns were corrected for thin trading.
5 . Following the research of Zalewska-Mitura and Hall (2000), Li (2003a), Jefferis and Smith (2005) and Hull and McGroarty (2014), there seems to be clear evidence from the literature that market efficiency is not only changing over time, but that there is a clear direction in this evolution. These studies all find clear evidence that markets move from inefficiency towards efficiency over time. Building on this empirical evidence from the literature, the authors expects the telecommunication index to become more efficient over time.
6 . This index consists of four companies: African Media Entertainment (0.06% of the index), Caxton Publishers and Printers (0.59% of the index), E Media Holdings (0.06% of the index) and Naspers (99.29% of the index).
7 . The Pearson correlation coefficient between the banks are: Standard Bank and Barclays Group Africa (0.98); Standard Bank and Nedbank (0.67); Standard Bank and First Rand Group (0.91); Barclays Group Africa and Nedbank (0.64); Barclays Group Africa and First Rand Group (0.88); Nedbank and First Rand Group (0.82).
8 . Jefferis and Smith (2004) explain that as good quality information is expensive, leading market analysts tend to concentrate their efforts on larger firms. Because of this, the size of the market creates an economy of scale effect in both relative and absolute terms.
9 . Almost all portfolio managers have Naspers in their portfolios. Naspers makes up 99.29% of the media index and, as such, the test for the relative efficiency of the media index is a test for the relative efficiency for Naspers. It follows then that portfolio managers can easily include inefficient assets in their portfolios regardless of the overall level of efficiency of the market as a whole.
10 . Samuelson's dictum states that individual stocks are more informationally efficient than the market as a whole, leading the efficient market hypothesis to work better for individual stocks than for the total market (see Jung and Shiller 2005).

