


Serviços Personalizados
Artigo
 Inglês (pdf)
 Artigo em XML
 Referências do artigo
Indicadores

Links relacionados
-
 Citado por Google
 -
 Similares em Google
Compartilhar

 Permalink
South African Journal of Economic and Management Sciences
versão On-line ISSN 2222-3436
versão impressa ISSN 1015-8812
S. Afr. j. econ. manag. sci. vol.21 no.1 Pretoria 2018
http://dx.doi.org/10.4102/sajems.v21i1.2106
ORIGINAL RESEARCH
An evaluation of the trade relationships between South Africa and China: An empirical review 1995-2014
Simbarashe Mhaka; Leward Jeke
Department of Economics, Nelson Mandela University, South Africa
ABSTRACT
BACKGROUND: South Africa's (SA) largest trading partner is China. The bilateral trade flows between these two economies have been increasing since the end of the global financial crisis. There are several factors that determine the trade flows between these two economies.
AIM: The research studies the impact of the real exchange rate, market size and economic size on the trade flows between SA and China, applying the gravity model of trade. Time series data for the period of 1995-2014 have been used and a multiple linear regression model was employed in the evaluation process.
METHODS: To determine the impact of the three underlying variables on the bilateral trade flows of SA and China, the ordinary least squares method was used. The explanatory variables consist of the product of SA's gross domestic product (GDP) and China's GDP, which act as the proxy for economic size, the product of South Africa's population and China's population, which act as the proxy for market size, and the real exchange rate between SA and China.
RESULTS: Results revealed that the economic size and the market size have a strong positive impact on trade flows between SA and China and this is consistent with economic theory. On the other hand the real exchange rate has a negative impact on trade flows between SA and China.
CONCLUSION: If two countries each have a large economic and population size trade, this results in high trade flows between the countries as compared to trading with smaller economies. Trade volume is also reduced if the countries trading have a highly volatile exchange rate. Based on the findings of the research, the article recommends that the Department of Trade and Industry should target trade with countries of big economic and market size. The research also shows that the absolute and comparative advantages are not the only basis of trade but other factors should be considered, such as exchange rate, economic size and market size. The central bank should maintain a stable exchange rate between the SA rand and partner countries' currencies before trading. This enhances trade and leads to strong economic growth.
Introduction
Most countries are linked with each other through trade and financial agreements. Some African countries are becoming successful because of the strong economic links they hold with other countries in the world. According to the Organisation for Economic Co-operation and Development (OECD 2017), South Sudan, Chad and Angola make the biggest contribution of most traded export in total exports. Morocco, South Africa (SA) and Tunisia have the largest number of products constituting 75% or more of total African exports (OECD 2017). This makes these countries very competitive in external markets. Exports expansion, imports substitution and international capital movements have all been important in the development of the SA economy (Mohr & Fourie 2008:369). International trade is a major driver of economic growth in all countries. The growth in transport and communication networks has promoted trade in Africa. South Africa has expanded its trading routes and is trading with countries in the North American Free Trade Agreement (NAFTA), United States (US), Germany, India, China, Brazil and countries within the Southern African development community. Recently, SA has signed the Economic Partnership Agreement (EU SADC) which is going to replace the Trade, Development and Cooperation Agreement. South Africa's trade of goods and services has been increasing since 1992 (Department of Trade and Industry [DTI] 2010). This is illustrated in Figure 1.
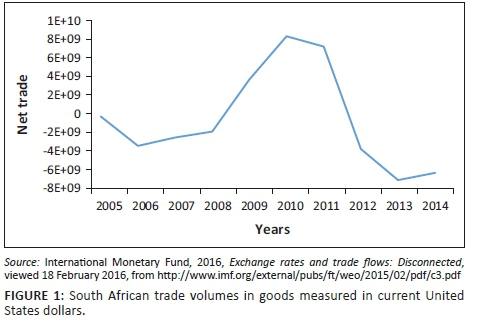
Net trade is the difference between exports and imports. Figure 1 shows net trade conducted in SA from 2005 to 2014. In Figure 1, the net trade in goods in 2005 was very low, with a negative balance. There was a slight increase in net trade from 2006 to 2008, although the net balance remained negative. A sharp increase in trade was recorded from 2009 to 2011. In those years, the net trade became positive; that means that SA recorded a trade sur-plus. The decline in net trade began in 2008 as a result of the global financial crisis. Since then, SA has been facing a trade deficit: it needs to finance from its savings or from borrowings to stabilise the economy.
Dornbursh, Fischer and Startz (1998:265) argue that national economies are becoming more closely interrelated and the notion of globalisation is increasingly accepted. Globalisation occurs when economies are moving towards a global economy (Dornbursh et al. 1998:265). Bhagwati (2010) defines economic globalisation as the integration of national economies into the international economy through trade in goods and services. Expansion in trade shows evidence of this process of globalisation.
East Asian countries like China, Japan and Taiwan have always been SA's largest trading partners (TIPS 2011). According to TIPS (2011), in 1990, 17% of the South African imports were from East Asian countries and in 2009, 21% of South Africa's imports were from East Asian countries. South Africa exports to East Asia amounted to 13% of total exports in 1990 but by 2009 it was about 21% of total exports. It is very interesting to study the trade between SA and China. China is SA's largest trading partner. China's economic performance is higher than that of all other economies. China is regarded as both the top exporter and top importer for SA (DTI 2010). This research will apply the gravity model to investigate the bilateral trade between SA and China and will highlight the impact of economic size, market size and exchange rate on the trade flows.
The gravity model has been used intensively in literature to investigate factors influencing the level of trade between Vietnam and 23 European countries (EC23) in the OECD and to evaluate whether there are potentials for growth in trade between Vietnam and those countries (Thai 2006). The results by Thai (2006) indicated that the bilateral trade flows between Vietnam and EC23 are driven by economic size, market size and exchange rate volatility, but distance and history seem to have no effect on the bilateral trade between Vietnam and EC23 (Thai 2006).
Hilbun (2003) used the gravity model framework to analyse trade in the Western Hemisphere. According to Hilbun, of the five regional trade agreements analysed (NAFTA, Andean Community, Mercosur, Latin American Integration Association, and Central American Common Market), none were significant in its explanation of significant increases in agricultural bilateral trade flows.
Weckstrom (2013) used the gravity model of trade to test Russia's exports to its main trading partners. The results have shown that the distance between Russia and its trading partners does not really affect the Russia exports; the population of the export market seems to be a bad variable to explain Russian exports (Weckstrom 2013). There is a strong correlation between Russian population and Russian exports but there is still no reason to believe that a decline in Russian population would cause an increase in Russian exports (Weckstrom 2013).
An overview of South Africa and China trading
South Africa's bilateral trade with China increased from R205 billion in 2012 to R270 bn 2014, which is a 32% increase, but the composition of the trade was a matter of concern as SA's exports comprised mainly raw materials (Ensor 2014). According to Ensor (2014), China became SA's single largest trading partner in 2009, but the trade balance has been in favour of China. South Africa and China have been working together according to various trade agreements, and these to some extent have led to increased trade between these two countries. China is the top importer from and top exporter to SA (DTI 2010). In short, China has been considered SA's fastest growing trading partner (DTI 2010). The question is: what is determining the trade between SA and China?
South Africa, a leading economy on the African continent, and China, the largest developing country in the world, have forged a unique partnership and are operating at bilateral, continental and multilateral levels; their governments are actively striving to realise the comprehensive strategic partnership envisaged in 2010 (Alden & Yushan 2014). With the pace of trade and investment picking up, coupled with closer international cooperation with Beijing through the G20 and the Brazil, Russia, India, China, South Africa (BRICS) grouping, SA-China ties are assuming a significant position in continental and even global affairs (Alden & Yushan 2014).
There is clear evidence that there is a strong relationship between SA and China. The existence of a Chinatown in most parts of South Africa confirms this evidence. It all started when the South African mining companies organised a formal labour recruitment scheme in what was to become the Union of South Africa, which brought several thousand Chinese workers to the country (Alden & Yushan 2014). Some of these individuals formed the Chinese community in SA, and set up a Chinatown in central Johannesburg (Alden & Yushan 2014).
South Africa exports to China
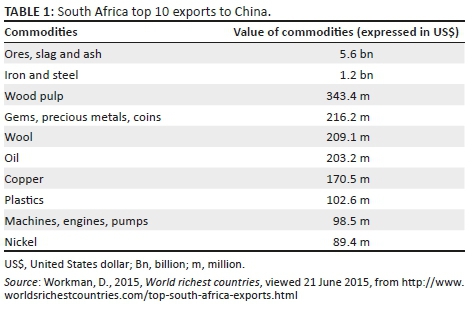
The SA exports to China comprise mainly raw materials. About 90% of SA's top 10 exports to China are raw materials. Hence the DTI is promoting the export of value-added manufactured products to China, mainly by means of trade exhibitions (Ensor 2014).
Alden and Yushan (2014) show that SA has an abundance of mineral resources. China is importing mostly natural resources as inputs for their manufacturing industries; the output from these industries is sold back to SA (Workman 2015). According to Workman (2015) SA's exports to China amounted to $8.7 billion or 9.6% of its overall exports in 2014. The top 10 of SA exports to China made in 2014 are shown in Table 1.
SA-China relations are strengthened by the comparative advantage between these countries, which forms a basis for trade. South Africa has a comparative advantage in various primary sector commodities (metal ores, gold and coal).
In many years, SA's exports performance to China has been fluctuating but remained positive except during 2008-2010 as shown by Figure 2, which shows the annual percentage growth of SA exports to China. The graph uses export data from the years 1995 to 2013 obtained from the World Bank (2017).
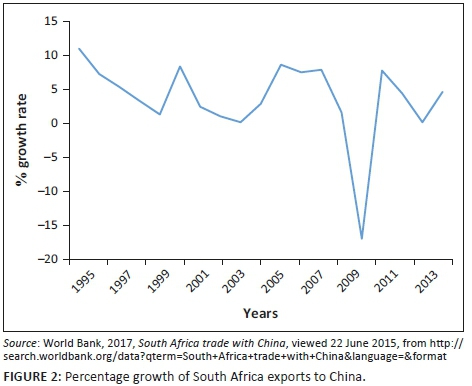
South Africa's export growth to China has been positive in all years from 1995 to 2013 but it was negative during the years 2008-2010. During this period the economy was affected by the global financial crisis and hence the balance of trade worsened into a deficit. The financial crisis affected many economies including the SA economy. The economy performance started diminishing, price inflation was growing and there was high unemployment adding to the crisis.
South Africa imports from China
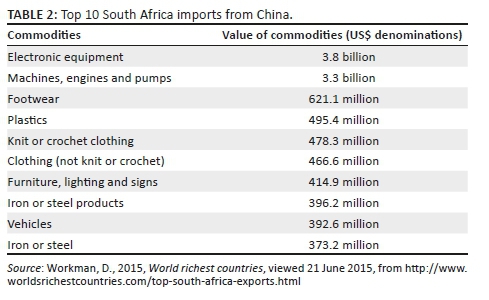
About 100% of the top South African imports from China are manufactured products (Workman 2015). It is now clear that China sources some of its materials for manufacturing in Africa, converts and sells these products all over the world (Workman 2015).
According to Workman (2015), China's exports to South Africa amounted to $15.4 billion or 15.5% of its overall imports in the year 2014. The top 10 SA imports from China made in this year are tabulated in Table 2.
The comparative advantage theory is very useful in explaining SA and China trade. China seems to have a comparative advantage in various secondary sector commodities (textiles and certain foodstuffs, for example). Due to specialisation China will export these commodities to SA. They will accumulate as imports to the SA side. Figure 3 shows SA import growth expressed as an annual percentage for the years 1995-2013.

SA import growth has been positive most years 1995 to 2013, falling to negative only in 1999 and 2009. The 2008-2009 financial crisis also dampened the growth of SA's imports from China. This shows that the crisis reduced trade overall. In all years import growth has been above export growth in SA. This resulted in a negative trade balance between SA and China.
South Africa-China relations
The growth of bilateral, multilateral and south-south relations has tightened the relationship between SA and China. These relationships influence trade. Following diplomatic recognition of the People's Republic of China (PRC) in 1998, South Africa and China have exchanged a number of high-level visits that resulted in a range of agreements covering various issues including economic cooperation (Grimm et al. 2014).
According to the PMG (2010, in Grimm et al. 2014), South Africa had a One China Policy in December 1997 and the diplomatic relations were established in January 1998. The Pretoria Declaration on Partnership was issued in April 2000, a bi-national commission was established in 2001, a strategic partnership was declared in 2004 and a programme for a deepening strategic partnership was established in June 2006 (PMG 2010, in Grimm et al. 2014). A Comprehensive Strategic Partnership was agreed upon in principle during 2010 and a state visit by President Jacob Zuma to China in August 2010 was proposed (PMG 2010, in Grimm et al. 2014). In terms of multilateral partnerships there was support for South Africa's non-permanent seat on the United Nation Security Council (UNSC) from 2011 to 2012, a common vision on climate change (BASIC grouping), south-south cooperation (G77 and China) New Africa-Asia Strategic Partnership (NAASP), support for South Africa's BRIC membership and cooperation in the G20 (PMG 2010, in Grimm et al. 2014).
South Africa-China political relationship
SA-China relations did not just start with trade. History proves that there is political interest between China and SA. In SA, Beijing supported the Pan-African Congress (PAC); this was because the USSR had already secured relations with the ANC, thus precluding closer ANC-China relations (Grimm et al. 2014).
According to Grimm et al. (2014), in 1999, President Mandela made the first state visit to China after the formal diplomatic relationship had begun and in 2000, President Jiang Zemin visited South Africa; at that time, the two heads of state signed the Pretoria Declaration on the Partnership between the PRC and the Republic of South Africa which, for the first time, highlighted enhancing the partnership from both sides. All these political relationships created a foundation for the development of the bilateral relations.
South Africa has a significant impact on China's economy. The support from South Africa has provided China with a base in the international community and international organisations and agencies. According to Niu (2011, cited in Grimm et al. 2014), China's approach to SA is sometimes seen as China's Africa strategy in the broader context: South Africa, albeit just one state among 54 African countries, arguably provides China's African engagement with legitimacy. Hence China's invitation to South Africa to join the BRIC club in 2011. Many Chinese officials have shown that China is willing to deepen their bilateral relations with SA (Niu 2011, in Grimm et al. 2014).
South Africa-China economic relations
For China, SA is the most significant trade partner on the continent and bilateral trade makes up nearly 20% of China's total trade with the continent (Shinn & Eisenman 2012:349-350, in Grimm et al. 2014).
Multilateral ties
It is clear that the relations between SA and China are strengthened by the multilateral relations they hold. According to Molepolle (2015), the relations between China and SA at a multilateral level include the Forum on China-Africa Cooperation (FOCAC), G20, World Trade Organization and the G77.
Alden and Yushan (2014), highlight that, in 2012, the outgoing Chinese President Jintao stated that China and SA shared common interests in many international affairs, and that China hoped to cooperate with SA in the United Nations (UN), G20, BRICS and other international forums to reinforce the collective voice of developing countries and propel the international political and economic order into a more fair and reasonable direction. The mutual support between China and SA has been given concrete meaning through four multilateral forums, namely the UNSC, the FOCAC, BRICS and the G20.
Alden and Yushan (2014) show that SA worked together with China under the UNSC. This was a security council that tried to maintain peace in African countries. Alden and Yushan gave the case of Zimbabwe and sanctions as an example of where SA worked cooperatively with China to block Western inspired sanctions. Of particular significance from a South African perspective was the experience of working with China on African security, which for one diplomat involved with the SA mission underscored the willingness of the Chinese to genuinely seek out, consult and integrate South African (and African) views in formulating UNSC positions (Alden & Yushan 2014).
According to Alden and Yushan (2014), SA is also in a multilateral relationship with China through the FOCAC forum. With regard to FOCAC, SA involvement in the FOCAC process has from the outset been marked by a desire to ensure that African, or at least South African, perspectives are incorporated in the ministerial meetings (Alden & Yushan 2014). Meanwhile, Alden and Yushan show that South African officials in China, for example the ambassadors, are regularly lauded by Chinese officials as being the most active of delegates among the African ambassadors based in Beijing.
In an effort to upgrade to the comprehensive strategic partnership between China and SA, China invited SA to join the BRIC group (Xiong 2012). In 2006, this group officially became a diplomatic political entity called BRIC; SA officially joined in 2011 and the acronym was extended to BRICS. According to the Global Sherpa, cited in Provincial Treasury (2013), the formation of BRICS is an effort by its members to foster cooperation in order to meet global challenges, especially those faced by emerging economies. These countries' collaboration is aimed at meeting the economic needs of this century which include infrastructure development, consumption and increased trade (Provincial Treasury 2013).
Through the BRICS grouping, SA has managed to work together with China. Regarding BRICS and global issues, the various summit declarations highlighted the fact that the BRICS countries shared similar needs, for example, for the democratisation of international institutions and an approach to climate change that took into account developing countries' interests (Alden & Yushan 2014). On controversial foreign policy issues such as Libya (and later Crimea), while no conformity of position was expected, disagreements were expressed behind closed doors and not for the world to hear, to retain the image of BRICS unity; regular consultation, such as the meeting of BRICS foreign ministers at the Hague in the midst of the Ukrainian crisis in early 2014, reinforced this approach (Alden & Yushan 2014). These issues contributed towards a stronger relationship between SA and China.
Finally, as the only African member of the G20, the South African government has a privileged position to work with other leading economies in shaping a coordinated response to the global financial crisis (Alden & Yushan 2014).
Bilateral relations
It can be concluded that currently SA's participation in BRICS is to a certain degree implicitly reliant on and intertwined with its bilateral relationship with China. South Africa and China's relationship became strong after the formation of their bilateral relations. The relations at a bilateral level were created for example as a result of the Bi-National Commission (BNC) and its committees. Xiong (2012) shows that since the formal establishment of relations in 1998 and the creation of the BNC in 2001, trade and investment between China and SA have grown exponentially.
According to Xiong (2012), in December 2001, the president of SA inaugurated the first plenary session of the BNC where separate talks were held between the ministries and departments of foreign affairs, economic cooperation and trade, science, technology, energy and tourism. Since the inception of the Pretoria Declaration, there have been four BNC meetings from 2001 to 2010 (Xiong 2012). At the end of the second BNC meeting in 2004, the joint communique issued announced that the South African customs union would enter into free trade negotiations with China, further reintegrating the commitment to enhance south-south cooperation to safeguard the rights and interest of the developing world in multilateral forums such as the World Tarde Organization (WTO) and the UN as well as mutual support for FOCAC and the New Partnership for Africa's Development (NEPAD) (Xiong 2012). According to the previous president of SA both countries shared common perspectives on the restructuring of the UN, the reform of the global trading system, and enhanced south-south cooperation, hence similar diplomatic sentiments were reiterated in subsequent BNCs with the business and investment forum growing a larger presence (Xiong 2012). Although the BNC was clearly a mechanism to process and organise the dialogue for technical cooperation, its existence provides both the countries a coordinated opportunity in which to hone, revise and further develop bilateral relations on specific issues.
China and SA seek to increase trade between one another. Both governments seek to further solidify and coordinate bilateral engagements through forming the comprehensive strategic partnership in 2010, which may be assumed to be one of the determining factors in the prelude to SA's invitation into BRICS at China's insistence (Xiong 2012). From 23 to 26 August 2010 China and SA further developed bilateral relations by upgrading to adopt a comprehensive strategic partnership.
According to Alden and Yushan (2014) the rapid growth in trade has been the result of a combination of the burgeoning bilateral friendship and of global factors, and these include China's joining the WTO in 2001 and, with Pretoria's formal recognition of China's market economy status, its upgrading to a strategic partnership in 2004.
In 2005, negotiations to create a free trade agreement (FTA) - reportedly initiated by Beijing - began with SA's DTI and hence the proponents of the FTA with China argued that it would help SA to correct the trade imbalance, improve employment and draw new sources of investment into the mining sector while others pointed out that it would offer more economic gains to SA and China while disadvantaging the other Southern African Customs Union countries, whose existing exports already enter China duty free, or nearly so (Alden & Yushan 2014). It was the latter concerns, coupled with the anticipated outcry by the trade unions aligned with the ANC, that caused the issue to languish and drop off the agenda; more recently; however, the FTA has again become a talking point between Beijing and Pretoria (Alden & Yushan 2014).
Alden and Yushan (2014) show that China became the largest bilateral trading partner of both SA and the Southern African region, overtaking countries such as the US. In 2013, the president of China visited SA in March and both countries signed the Terms of Reference for the Joint Inter-Ministerial Working Group, the purpose of which was to supplement mechanisms and coordinate the implementation of major projects and bilateral agreements (Alden & Yushan 2014).
According to the Presidency (2014), SA has signed several strategic agreements with the government of the PRC which aim to strengthen bilateral relations, trade cooperation and create sustainable investment opportunities between the two countries.
According to the Presidency (2014) the following agreements were signed:
-
A 5-10 Year Strategic Programme on Cooperation between the People's Republic of China and the Republic of South Africa: this agreement focuses on various bilateral cooperations including Political Mutual Trust and Strategic Coordination, Mutual Beneficial Economic Cooperation and Trade, People-to-People Exchanges and Cooperation, African Affairs and China-Africa Relations as well as Cooperation in International Affairs and BRICS-related issues (The Presidency 2014).
-
Agreed minutes on further improving economic cooperation in trade and investment between the Ministry of Trade and Industry of the Republic of South Africa and the Ministry of Commerce of the People's Republic of China (The Presidency 2014).
-
Action plan on Agriculture Cooperation between Republic of South Africa and the People's Republic of China (2014-2016) (The Presidency 2014).
-
Protocol of phytosanitory requirements for the export of maize from the Republic of South Africa to the People's Republic of China (The Presidency 2014).
-
Protocol of phytosanitory requirements for the export of apple fruit from the Republic of South Africa to the People's Republic of China (The Presidency 2014).
-
Protocol of phytosanitory requirements for the export of dates from the People's Republic of China to the Republic of South Africa (The Presidency 2014).
Theoretical and empirical review
Markusen (2005:1) shows that trade theory consists of a portfolio models. There are many underlying motives for trade, and it is probably productive to have a series of models analysing just a few of these at a time, rather than to attempt one grand model, which includes all possible bases for trade (Markusen 2005:1). Theories of trade are grouped into traditional and new theories.
Theories of international trade
Comparative advantage theories of trade in goods (traditional theories)
One of the traditional trade theories is mercantilism. This theory shows that national wealth is reflected by the country's holding of precious metals and trade is a zero sum game (Appleyard et al. 2010:18). A zero sum game is one in which one country benefits at the expense of its trading partners (a zero sum game is a game such as poker where one person's winnings directly match another player's losses) (Appleyard et al. 2010:19).
Appleyard et al. (2010:19) explain that the acquisition of precious metals thus became the means for increasing wealth and well-being and the focus of emerging European nation states, and hence a strong army, strong navy and merchant marine, as well as a productive economy were critical to maintaining and increasing the power of the state. This theory shows how countries used to trade. Trade was done by the use of power; rich nations tried to benefit at the expense of poor nations. It also shows that trade is not a mutually benefitial process. According to Levich (2001), the theory of mercantilism states that the world only contained a fixed amount of wealth and that to increase a country's wealth, one country had to take some wealth from another, through having a higher import or export ratio. So, this tendency, to export more and import less and to receive in exchange gold (the deficit is paid in gold), is called mercantilism (Levich 2001). However, David Hume and his price specie flow model and Adam Smith and his invisible hand challenged the basic tenets of mercantilism.
According to Appleyard et al. (2010:22), David Hume and the price species flow mechanism challenged the mercantilism views of long-time trade surplus. He argued that the accumulation of gold by means of trade surplus would lead to an increase in the money supply and therefore to an increase in prices and wages and the increase would reduce the competitiveness of the country with a surplus (Appleyard et al. 2010:22). Hume argued that one country could not maintain a trade surplus for a long time since this surplus leads to an increase in money supply, which will increase domestic prices and hence lower exports and raise imports (Appleyard et al. 2010:22). This theory is important to this research, since it shows the automatic adjustment of the trade disequilibrium within a country. The theory states that a trade surplus (or deficit) automatically produces internal repercussions that work to remove that surplus (or deficit) (Appleyard et al. 2010:22). Therefore, upon engaging in trade, a nation will end up with a zero trade balance.
Adam Smith also critisised the mercantilism views and stated that a nation's wealth is reflected in its productive capacity and trade is a positive sum game (Appleyard et al. 2010: 24). A positive sum game occurs when both countries benefit from their trade. Appleyard et al. (2010:24) indicates that Smith concluded that countries should specialise in and export those commodities in which they have an absolute advantage and should import the commodities in which the trading partner has an absolute advantage. Each country should export those commodities they produce more efficiently because the absolute labour required per unit was less than that of the prospective trading partner. According to Kilic (2002), if a country or individual is absolutely more efficient at the production of a good than another country or individual, then we say that they have absolute advantage in the production of that good. This theory shows that both countries engaging in trade will benefit from that. This theory is important to this research because it shows that trade is determined by the set of natural resources that a country has. These natural resources will determine the country's absolute advantage. Moreover, as the country start trading, this model will show how commodities will flow to and from one country.
According to Appleyard et al. (2010:24), it is clear that Adam Smith argued that countries could trade, based on an absolute advantage in the production of only one set of commodities that the two countries are to exchange. Therefore, absolute advantage forms the basis of trade. The question is what if only one country has absolute advantage for both goods? According to Smith in that case there is no basis for trade because trading in these circumstances has no mutual benefits (Appleyard et al. 2010:26).
Ricardian comparative advantage challenged these statements made by Smith that there is no trade if one country has an absolute advantage in the production of both commodities. This theory does make it clear that even if a country is absolutely more or less efficient in the production of all commodities, a basis for trade still exists if there is a difference in the degree of relative efficiency across commodities (Appleyard et al. 2010:39). A comparative advantage exists whenever the relative labour requirements differ between two countries; this means that, the internal opportunity cost of the two commodities is different for the two countries prior to trade and both countries may gain if they undertake to trade using this base (Appleyard et al. 2010:33). Ricardian comparative advantage demonstrated that countries could trade using the basis of comparative advantage and gains from trade (Appleyard et al. 2010:40). According to Kilic (2002), if a country or individual is relatively more efficient in the production of a good than another country or individuals then we say that they have comparative advantage in production of that good. David Ricardo's theory gave solutions to Adam Smith's shortfalls. This theory is important to this research because it encourages a theoretical discussion of what determined trade in the past decades. This theory also shows the flows of commodities between two countries, triggered by the comparative advantage principle. The theory also shows that trade is a mutually beneficial transaction, where all parties engaging in trade come to benefit.
The Heckscher-Ohlin theory also supported the Ricardian comparative advantage theory. Heckscher-Ohlin assumes that relative factor intensities are different across commodities and that these differences are consistent across countries, which leads to pre-trade price differences (Appleyard et al. 2010:1310). The theory suggests that the country with abundant capital will be able to produce relatively more of the capital-intensive good, while the country with abundant labour will be able to provide to produce relatively more of the labour intensive good (Appleyard et al. 2010:133). The Heckscher-Ohlin theory states that a country will export the commodity that uses relatively intensively its relative abundant factor of production and it will import the good that uses relatively intensively its relatively scarce factor of production (Appleyard et al. 2010:135).
The Heckscher-Ohlin theory states that countries trade because of differences in the factor abundance and the factor intensities of the goods they produce (Markusen 2005:3). The differences determine which countries have comparative advantage over others. In a case where country (A) is capital abundant and country (B) is labour abundant, this is represented by: [(K/L)*A > (K/L)*B].
K represents capital factor, L represents labour factor, A represents country A and B represents country B.
The inequality shows that the ratio of capital to labour in country A exceeds the ratio of capital to labour in country B. Therefore, Appleyard et al. (2010:128) argues that if the inequality is like that, then country A will produce and export capital-intensive goods while importing labour-intensive goods from country B. This model is important to this research because it explains the basis for trade. It modifies Ricardo's comparative advantage theory and shows the flows of commodities between two countries.
Non-comparative advantage theories of trade (new trade theory)
The new trade theory shows that trade happens not because of comparative advantage but the principal motives for trade are scale economies, imperfect competition and product differentiation (Markusen 2005:3). The new trade theories divert from the traditional theory assumptions that there were constant returns to scale, perfect competition and homogenous products.
The theory of intra-industry trade assumes that because of intra-industry specialisation, each country will import some products even in industries in which it is a net exporter, and vice versa; that is, there will be intra-industry trade (Krugman 1983:344). Countries that export and import items in the same product classification are engaging in intra-industry trade (IIT) (Appleyard et al. 2010:186). According to Appleyard et al. (2010:185) IIT was also an aspect of the Linder theory, since it argues that one country can have a comparative advantage and a comparative disadvantage regarding same product due to product differentiation. This theory helps us to show if any trade agreements between China and SA are effective. The effectiveness of trade agreements is shown by the presence of IIT.
The other model is the Krugman model. This model rests on two features, that is, economies of scale and monopolistic competition (Appleyard et al. 2010:187). Appleyard et al. (2010:187) shows that in Krugman, labour is assumed to be the only factor of production and the economies of scale (which are internal to the firm) are incorporated into the equation for determining the amount of labour required to produce given levels of output by a firm, as shown here: L = a + bQ.
L stands for labour needed by a firm, a represents a constant (technologically determined) number, Q represents the output level for the firm and b specifies the relation at the margin between the output level and the amount of labour needed.
Appleyard et al. (2010: 187) argue that the world market is characterised by the existence of the monopolistic competition market structure. In monopolistic competition, there are many firms operating, there are no barriers to entry and exit. In addition, firms earn zero amounts of profits in the long run. However, the output for these firms is not homogenous products. Appleyard et al. (2010:187) shows that the products differ from each other and each firm's product possesses a certain amount of consumer brand loyalty. This product differentiation leads to advertising and sales promotion as firms attempt to differentiate their products in the minds of consumers (Appleyard et al. 2010:187).
To introduce international trade, suppose the home country is country X and the other country is country Y. Country Y is identical to country X in terms of its tastes, technology and other characteristics of factors in production (country Y might be identical in size) (Appleyard et al. 2010:188). Traditional theories could conclude that, with these same general supply and demand conditions (and hence relative prices), the two countries would have no incentive to trade with each other; however, Krugman (and Linder) would disagree (Appleyard et al. 2010:188).
Appleyard et al. (2010:189) show that when the two countries open up to trade, the important point to note is that the market size is being enlarged for each representative firm in each country, because there are now more potential buyers for every firm's goods. When the market size is enlarged, economies of scale may come into play and production costs fall for all goods. If the firm being considered is in country X, the opening of the country to trade with country Y means that consumers in both countries are now consuming this product and country Y's consumers now add country X products to their consumption bundles, just as country X's consumers add country Y's products to their consumption bundle.
As Krugman's theory of trade patterns makes several very strong simplifications compared to the real world, it cannot be directly applied to empirics, as it is (Weckstrom 2013). However, this theory is useful to this research since it gives a more theoretical discussion that will assist us in understanding the international trade flows. It also explains the basis of trade if countries have economies of scale and if they are in a monopolistic competition market structure.
The Linder theory has also an important implication regarding trade. Linder is concerned only with manufactured goods. Linder implies that international trade in manufactured goods will be more intense between countries with similar per capita income levels than between countries with dissimilar per capita income levels (Appleyard et al. 2010:183). Trade, according to Linder's theory, will occur in goods that have an overlapping demand (Appleyard et al. 2010:182). Linder's theory is important to this research because it explains the composition and pattern of a country's trade. Appleyard et al. (2010:183) show that the determination of the trading pattern by observing overlapping demands has important implications for the types of countries that will trade with each other.
The most important theory of trade that is relevant to the study is the gravity model of trade. According to Weckstrom (2013), the gravity model was first discovered in physics, when Newton found out that the gravity between two objects correlates with the masses of these objects and the distance between the objects. The same principle was found to work in international economics by Jan Tinbergen in 1962; he was interested in international trade flows that would prevail if no trade barriers were being used (Weckstrom 2013).
The Economic Watch (2010) explains that the gravity model of trade predicts the bilateral trade flows based on the economic sizes of (often using gross domestic product [GDP] measurements) and distance between two countries. The aim of this thesis is to predict the trade volume between SA and China and thereby use these results to test the trade balance hypothesis. Kowalski, Lattimore and Bottini (2009:35) show that in order to assess SA trade performance in a comparative framework, an econometric model based on the gravity model of international trade was developed.
The basic form of the gravity model is given as: Fsc = G (MsMc ÷ Dsc)
Fsc is the trade flow between SA and China, Ms and Mc are the GDP of SA and China, Dsc denotes the distance between SA and China and G is a constant.
Economic Watch (2010) argues that while the model in its basic form consists of factors that have more to do with geography and spatiality, the gravity model is used to test hypotheses rooted in purer economic theories of trade as well. The gravity model estimates the pattern of international trade. The gravity equation of international trade is often motivated using new trade theory models, which are models of increasing returns (Economic Watch 2010). Nowadays there is more trade between countries. The research uses this model to show trade flows between SA and China. It is important in modelling and understanding international trade flows.
Economic theories of trade agreements
The theory of second best
According to Lipsey and Lancaster (1956-1957) in Snorrason (2012:15), the general theory of the second best states that if a constraint is introduced into a general equilibrium setting which prevents the attainment of one of the Pareto conditions, other Pareto conditions, although still attainable, are in general no longer desirable. Free trade means that there are no distortions in trade. Snorrason (2012:15) indicates that Pareto optimality is achieved exclusively under free trade so that other cases where there are distortions, for example tariffs, subsidies, taxes or monopolies, are suboptimal.
The theory of second best addresses this by stating that, in the presence of distortions, if not all the conditions for Pareto optimality can be satisfied, then the removal of some of the distortions does not necessarily increase welfare, nor does the addition of other distortions necessarily decrease it (Snorrason 2012:15). One suboptimal situation is replaced by another suboptimal situation and thus welfare may remain unaffected, increased or decreased. In a system with several distortions, the removal of any single distortion cannot be presumed to be improving welfare; thus, if an economy is prevented from attaining all the conditions for maximum welfare simultaneously, the fulfilment of one of these conditions will not necessarily leave the economy better off and this is the general theory of second best (Snorrason 2012:16).
The traditional approach to trade agreements
The World Trade Report (2009:21) states that the main logic of the terms-of-trade (or traditional) approach is that countries that have market power (that can influence their terms of trade) cannot resist the temptation to act in their own interests. According to Jonhson (1954) in the World Trade Report (2009:21), in a situation where each country sets trade policy in an attempt to improve its terms of trade and increase national income, the result is a 'non-cooperative equilibrium' (known as Nash equilibrium) which is inefficient as the unilateral actions of countries cancel out one another. This situation, which is often referred to as a 'prisoners' dilemma' driven by terms of trade, can be avoided through a trade agreement between countries allowing them to cooperate rather than act unilaterally (World Trade Report 2009:22). By cooperating in binding agreements to reduce their trade restrictions, countries overcome this inefficiency (Mayer 1981 in the World Trade Report 2009).
The commitment approach to trade agreements
The commitment theory focuses on a domestic source of inefficiency. When setting trade policy, a government may be unable to make credible economic or political commitments to the private sector or the parliament (World Trade Report 2009:23). The lack of economic commitment leads to a so-called time-inconsistency problem and this is a situation where the decision of the government to implement a certain policy at some future time is not optimal when the future period arrives (World Trade Report 2009:23). In these models, the government wishes to use a discretionary trade policy to increase social welfare (for example, in response to unexpected events, or to allow temporary protection to an infant industry). However, the use of trade policy changes the behaviour of participants in the economy, that is, if agents anticipate the policy that the government will implement, they can react to it in a way that will reduce the impact that it has on them (World Trade Report 2009). This implies that the government will not be able to use a discretionary trade policy as intended, and this results in a socially inefficient trade policy.
Empirical literature on the determinants of trade
According to Melitz and Ottaviano (2007), larger and more integrated markets exhibit higher productivity and lower mark-ups and through the comparative advantages there will be high trade between these markets. Bigger markets exhibit higher levels of product variety and host more productive firms that set lower mark-ups (hence lower prices) and these firms have higher output and high sales (Melitz & Ottaviano 2007). This creates the basis of trade between countries with big markets. Melitz and Ottaviano (2007) indicated that trading partner size have an influence on trade flows. On the export side, a larger trading partner represents increased export market opportunities and on the import side, a larger trading partner represents an increased level of import competition (Melitz & Ottaviano 2007). Khumalo, Mishi and Dlodlo (2013) argue that trade in SA increases with the size of the economy and trade increases more than proportionately with the size of the economies. As SA becomes more developed, its trade with trading partners will increase. The larger the economic size of the exporting and importing countries, the larger the quantity of goods the exporting country can produce as well as sell (Khumalo et al. 2013).
The market size of countries has influence on international trade. The market size of a particular country is measured using the country's population size. The higher the population the, higher the productivity and less the cost of production since there will be abundant labour. Hence, countries with a high population tend to trade more with other countries. According to Matha (2000), one main implication is that country size differences also serve as one of the factors that determine the emergence of international trade. Matha goes on to say that the total variable trade costs, incurred in trade, are smaller for the individual firms in the larger country.
According to Dell'Ariccia (1998:7), the exchange rates experience significant and persistent deviations from the purchasing power parity, adding an exchange risk component to import and export activities. Then an increase in exchange rate uncertainty may lead risk-averse firms to reduce their foreign activity, reallocating production to their own domestic markets and a negative correlation between exchange rate volatility and trade exists (Dell'Ariccia 1998:16). Dell'Ariccia analyses the effects of exchange rate volatility on bilateral trade flows. This study employs a gravity model and panel data from Western Europe. The results show that the exchange rate uncertainty has a negative effect on international trade. However, the results from the Hausman test rejects the hypothesis of the absence of simultaneous causality.
Baak (2004) investigates the impact of exchange rate volatility on exports among 14 Asia-Pacific countries, where various measures to raise the intra-region trade are being implemented. The empirical tests, using annual data for the period from 1980 to 2002, detect a significant negative impact of exchange rate volatility on the volume of exports. In addition, various tests using the data for subsample periods indicate that the negative impact had been weakened since 1989, when the Asia-Pacific Economic Cooperation (APEC) launched, and surged again from 1997, when the Asian financial crisis broke out. Also, the test results show that the GDP of the importing country, the depreciation of the exporting country's currency value, the use of the same language and membership of APEC have positive impacts on exports, while the distance between trading countries has negative impacts.
Nicita (2013) investigates the importance of exchange rates in international trade by analysing the impact that exchange rate volatility and misalignment have on trade and then by exploring whether exchange rate misalignments affect governments' decisions regarding trade policies. The methodology consists of estimating fixed effects models on a detailed panel data set comprising about 100 countries and covering 10 years (2000-2009). The findings of this study are generally in line with those of the recent literature in supporting the importance of exchange rate misalignment while disregarding that of exchange rate volatility. In magnitude, exchange rate misalignments result in trade diversion quantifiable in about 1% of world trade. This article also shows evidence supporting the argument that trade policy is used to compensate for some of the consequences of an overvalued currency, especially with regard to anti-dumping interventions.
The relative distance between the trading partners should also have a negative impact on trade patterns. Trade costs tend to increase together with distance. The longer the distance between the two trading partners, the higher the trading costs. Assuming that the countries have a FTA, the cost of trade includes the cost of transportation and the cost of insurance, storage cost and other costs. The longer the distance, the higher these costs. Distance has a negative coefficient as expected which means that trade is higher for two countries that are closer to each other (Khumalo et al. 2013). Distance (or transport costs) is shown to play an important role in determining the volume of exports and imports. While trading partners closer to SA have a comparative advantage, exports from SA experience a greater impact on the volume traded than imports into SA (Holden & McMillan 2013:10). This finding is explained by the composition of trade in exports and imports. Exports from SA are high bulk and expensive to transport while imports are largely high value and proportionately cheaper to transport; furthermore, over time the impact of distance on South African exports is shown to be declining while its impact on imports into SA remains relatively unchanged (Holden & McMillan 2013:10).
Binh, Duong and Cuong (2006) apply the gravity model in order to analyse bilateral trade activities between Vietnam and 60 countries from 2000 to 2010. The research exploits panel data on international trade in Vietnam taken from the databanks of the International Trade Centre, International Monetary Fund and World Bank. The estimated results reveal that economic size of Vietnam, economic size and market size of foreign partners, distance and culture have huge effects on bilateral trade flows between Vietnam and these 60 countries. By applying the method of speed of convergence, the study also finds that Vietnam has trade potential especially with some new markets such as Africa and western Asia.
Sisaki (2013) builds a two-country, two-sector, non-scale growth model and investigates the relationship between trade patterns and the growth rate of per capita real consumption. The study considers negative population growth as well as positive population growth. The results show that as long as the population growth rates of the two countries are different, if the country that accumulates capital stock has negative population growth, trade patterns are sustainable in the end. This is true irrespective of the population growth rate of the other country. Moreover, we show that, if the country that accumulates capital stock has a positive population growth, two trade patterns are sustainable in the long run. In this case, each country's per capita growth is determined either by the population growth of the capital-accumulating country or by the population growth of both countries, depending on which of the two trade patterns is realised.
According to Doumbe and Belinga (2015) the purpose of their empirical analysis is to investigate, based on the gravity model, Cameroon's bilateral trade flows with 28 European Union countries, signatories of the EU-Cameroon FTA on 15 January 2009. Although said agreement enforcement day was scheduled for 4 August 2014, it is important to analyse the trade trends among these 29 countries. The research findings reveal that Cameroon's bilateral trade with European Union countries is affected positively by economic size and per capita GDP and influenced negatively by the distance between the trading partners. The result of applying the gravity model reveals that the product of two countries' GDPs has positive and significant impact on bilateral trade; indeed, a 1%-point increase in product of the GDPs leads to an increase in the bilateral trade volume of Cameroon with the concerned trade partners by 1.2808% and about the distance factor, 1% point increase in distance leads to decrease in the bilateral trade volume of Cameroon by 2.0306%.
Nuroglu (2010) investigates bilateral trade flows and their determinants among six big Organization of the Islamic Conference (OIC) economies by using panel data analysis and cross sectional data. The paper extends the original gravity model of bilateral trade with population and volatility of exchange rates, and then uses the modified gravity model in panel data analysis. It shows how the income and population of a country, distances between two countries and volatility of exchange rates affect bilateral trade flows among six big countries of the OIC. The paper gives special emphasis to the influence of the population on a country's trade flows and approaches the issue of population size from a scientific perspective. It is shown that the impact of population on bilateral trade flows is positive for the exporter country, while it is negative for the importer country.
There are few studies that are aimed at evaluating the bilateral trade relationships between SA and China. The article is therefore aimed at covering this gap.
Data methodology and research methodology
The model
From all the trade theories, the gravity theory of trade is used to evaluate the bilateral trade flows between South Africa and China. The gravity model has been widely used to analyse bilateral trade flows between country pairs. According to Teweldemedhin and Van Schalkwyk (2010:158), the gravity model was successfully applied for over 40 years to explain trade flows in empirical literature and, thus, using the gravity model, the magnitude of trade flows is estimated among trading countries. In examining the impact of market size, economy size and real exchange to SA-China trade flows the explanatory variables are the GDP (proxy for economy size), the population size (proxy for economic size) and real exchange. According to Thai (2006) the estimated gravity model has the following form: Log (Tijt) = a0 + a1log(Yit Yjt) + a2log(Nit Njt) + a3Erijt + eijt.
In this model:
-
j = China
-
i = South Africa
-
t: years of target
-
log Tijt: Log of the SA trade with China in year t
-
a0: the intercept
-
log Yit: log of SA GDP in year t
-
log Yjt: log of China GDP in year t
-
log Nit: log of SA population in year t
-
log Njt: log of China population in year t
-
Erijt: log of the real exchange rate between SA and China in year t
-
Eijt: error term
This gravity model will be estimated with ordinary least squares (OLS) regression analysis. The multiple linear regression model will be used since the model consists of more than two variables. The equation consists of logarithms both sides, leading to a log log model. The above equation shows the natural logarithm and the error term eijt has been added. This has produced a linear relationship which will allows the interpretation of the coefficients as elasticity.
The coefficient can be interpreted as follows: if SA's GDP in year t (Yit) or China's GDP in year t (Yjt) increases by 1%, the trade volume (Tijt) will increase by a percent, everything else held constant. Likewise, the GDP and population variables have a positive coefficient, showing that if the population or GDP between SA and China increases by 1%, then trade flows will increase by a percent, ceteris paribus.
Data and definition of variables
The gravity model of trade is used to determine the bilateral trade flows between two or more countries (Thai 2006). The model can be used to determine the effect caused by the economy size, market size and exchange rate towards the volume of trade between two or more countries.
The research thesis will estimate the bilateral trade between SA and China while at the same time showing the positive and negative effect caused by several variables within these two countries. The model contains the SA-China annual trade flows to the left, that is, the dependent variable (Y-variable) shows the logarithm of the SA trade with China in year t represented by log(Tijt). This is the annual trade (imports plus exports of SA obtained from the World Bank database). The aim is to explore the relationship between trade volume and economy size, market size and exchange rate (explanatory variables).
The right-hand side of the equation starts with the a0 variable, which is a constant variable. Hence, a0 becomes the B0 of the model, the intercept. The right-hand side of the model contains four different types of data to be inserted. The data shows the GDPs for both countries (these act as proxy for economy size), the population for SA and China (which act as a proxy for market size), and the exchange rates between SA and China. The results will show the relationship between the annual trade flows between SA and China with these three variables.
The first group of data gives the product of SA's and China's GDP and is measured in current US dollars. a1 becomes the B1 of the model and it is the coefficient for the two countries' GDP. GDP measures the total output that is produced within a country by both the citizens and the foreign people who reside in a given country. The economy size of each country is given by the country's GDP. The economy size of two countries is supposed to have a positive impact towards trade; this is a proxy, which tells us what economic theory states in this regard. The higher the product of two countries' GDP, the higher the volume of trade between those countries. The GDP data used shows the percentage annual change of GDP in a particular country.
The next set of data shows the product of the two countries' population. a2 becomes the B2 of the model and it represents the coefficient for the two countries' population. The population represents the country's market size. The market size is supposed to have a positive effect towards trade. The higher the product of the market size, the higher the volume of trade between the two countries concerned.
The exchange rate between two countries also affects trade. According to Sibanda (2012), the real exchange rate is the nominal exchange rate that takes the inflation differentials among the countries into account. a3 becomes the B3 of the model and represents the coefficient for the exchange rate between two countries. Exchange rate is included in the gravity model of trade as an explanatory variable. The data of the real effective exchange rate between SA and China will be inserted into the model. According to Thai (2006) the effect of real exchange rate on bilateral trade is expected to be negative, that is, if the SA rand appreciates (represented by a rise in exchange rate), exports will be made more expensive and imports will be cheaper. Hence, in short, an increase in exchange rate will lead to a decrease in the volume of trade between the two countries concerned. The nominal exchange rate is calculated as official exchange rate (local currency units relative to US dollars) of China divided by the official exchange rate of SA. The nominal exchange rate is then multiplied by China's GDP deflator and divided by SA's GDP deflator to obtain the real exchange rate.
In order to estimate the influence of GDP, population and exchange rate that are hypothesised to influence the trade volume between SA and China, the OLS estimation method has been employed.
Robustness and diagnostic checks of the model
The robustness checks the dynamic fit of the variables to the model in relation to whether their presence will affect the outcome of the results. The individual relationship of the variables and the interaction effects help to show the overall relevance of the variables and their worth in ascertaining that the previous GDP, population and exchange rate largely contribute to the volume of trade between two countries
The diagnostic tests on the other hand test for heteroscedasticity, autocorrelation and normality of the variables which help to examine the relationship between trade flows and influential variables so as to validate the parameter evaluation outcomes achieved by the estimated model. These checks test the stochastic properties of the model such as residual autocorrelation, heteroscedasticity, normality and goodness of fit.
Heteroscedasticity
The sequence of random variables is heteroscedastic if the random variables have different variances. On the other hand, a sequence of random variables with a constant variance are said to be homoscedastic. There are a number of formal statistical tests for heteroscedasticity. One such popular test is the white test for heteroscedasticity.
The test is useful because it has the secondary advantage of testing for specification bias which helps us assess whether the model is spurious or well fitted. After running the regression the residuals are obtained and then the test regression is established by regressing each product of the residuals on the cross products of the regressors and testing the joint significance of the regression. The null hypothesis for the white test is homoscedasticity and if we fail to reject the null hypothesis then there is homoscedasticity. If the null hypothesis is rejected then there is heteroscedasticity:
H0: Homoscedasticity
H1: Heteroscedasticity
Reject H0 if the white test result ( ) is greater than the chi-square critical value.
Autocorrelation
The Lagrange Multiplier (LM) test centres on the value of the R2 for the auxiliary regression. If one or more coefficients in an equation are statistically significant, then the value of R2 for that equation will be relatively significant, while if none of the variables is significant, R2 will be relatively low (Gujarati & Porter 2008). The LM test operates by obtaining R2 from the auxiliary regression and multiplying it by the number of observations, T.
The test can be done by using the following identity: TR2 ≈ X2 (m).
In this identity, m is the number of regressors in the auxiliary regression (excluding the constant term), equivalent to the number of restrictions that would have to be placed under the F-test approach (Gujarati & Porter 2008).
Estimation issues
The aim is to use stationary data. Stationary data means that the series evolves around the constant mean or the zero mean. Unfortunately, time series data is inherent to this principle. Time series data result in stationarity problems. In other words, the data do not evolve around the constant mean. If this data are used without making it stationary, it will produce biased results. The results will not be accurate. Hence, the model was turned into a log log linear regression model the data turned to logarithms. In this study we have taken explicit account of non-stationarity and have applied the augmented Dickey-Fuller unit root test in which we tested for unit root in the second difference. It is worth knowing that there is no multicollinearity between the variables used in this model.
Estimation results
The estimation results of bilateral trade between SA and China using the linear gravitational model equation are given in Table 3. The first column shows the three variables plus the constant; this is followed by a column that shows the coefficients of the variables and then the standard error column, t-statistic column that shows if the variables are significant or insignificant, and the last column shows the probability that the estimation is wrong.
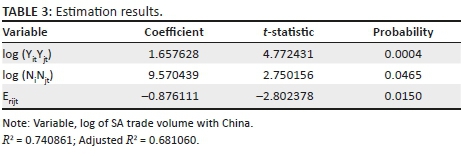
The gravitational equation of trade runs through the OLS method in this study. However, after the tests were made, the estimated coefficients have the expected signs. The determinants of bilateral trade between SA and China, according to this study, are the economy size, the market size and the real exchange rate.
The results from the OLS method show that there is a positive relationship between trade flows and economy size. If the sizes of the economies (measured by the two countries' GDP) increase by 1%, the bilateral trade flows between SA and China will increase on average by 1.66%. It can be concluded that although the results show a positive relationship, the increase of the economic size has no huge effects on the trade flows of these two trading partners. According to the World Bank (2017), the average annual GDP growth rate for China from 2000 to 2016 is 9.49088%. For SA, the annual GDP growth rate is 2.970282%. The average annual GDP growth rate for the two countries is 6.230581% (World Bank 2017). If these two countries maintain their average growth rate, trade flows are expected to increase by 10.34% on average.
The market sizes of SA and China have a significant and strong positive effect on their bilateral trade flows. If market sizes of SA and China (measured by the population size) increases by 1%, the bilateral trade will increase by 9.57% on average. Market size has quite huge effects on the two countries' bilateral trade as compared to the economy size. Based on the previous years' (2000-2016) data, population growth rate for China on average was 0.553267% (World Bank 2017). For SA, average annual population growth rate in the same years was 1.406316% (World Bank 2017). Therefore, the average population growth rate for the two countries is 0.979791%. Assuming the two countries maintain this growth rate, the trade flows between these countries is expected to increase by almost 9% on average.
The estimated coefficient for the real exchange rate is significant but negatively correlated with trade variation between SA and China. What this means is that a 1% depreciation of SA currency will increase bilateral trade by about 0.88% on average. The South African rand is losing its value. The rand value is falling. Hence, according to the results, if the rand continues to fall, the trade flows between SA and China will also decline.
The findings of this article are consistent with other empirical work in explaining bilateral trade variation using the gravity model. According to Thai (2006), the economy size and market size have a strong influence on trade as a larger country can produce more goods and services for export; high income together with big market size will increase the demand for importing goods and the negative coefficient of the real exchange rate on bilateral trade is also in line with other papers such as that of Dell'Aricaca (1998).
Figure 4 plots the time effects of bilateral trade between SA and China; these effects are all individually significant. There has been a steady increase in trade between SA and China from 1995 to 2002. Trade volume between SA and China increased sharply after 2000-2008 and decreased in 2009. It rose sharply again after 2009-2011, after which it started decreasing.
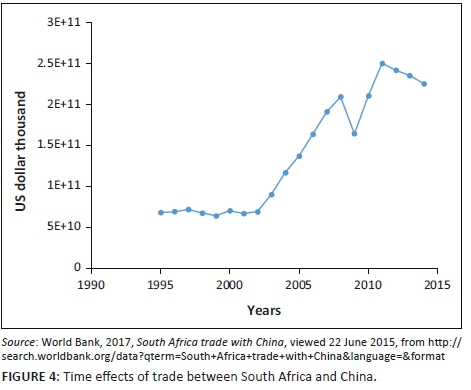
Figure 4 shows that the volume of trade between SA and China increased from 1995 until 2015.
Summary of the study and conclusions
The purpose of this research is to evaluate the impact of economy size, market size and real exchange rate on trade flows between SA and China for the period 1995-2015 applying the OLS method.
The results revealed a positive relationship between trade flows and the two variables tested, namely economy size and market size. The results of the last variable test have proven a negative relationship between trade flows and exchange rate.
There is a positive relationship between economy size and bilateral trade flows between SA and China. This indicates that trade improves with increase in GDP between these two countries or decreases as the GDP between these countries falls.
The other variable tested for was market size which is determined by the size of the population. The bilateral trade flow increases together with growth in population. There is a positive relationship between population size and bilateral trade flow between SA and China.
The results show evidence of a small but significant negative effect of the real exchange rate on bilateral trade between SA and China. Exchange rate volatility has an impact on trade but its contribution to trade is quite limited. The results computed from this model are in line with the theoretical findings.
The empirical results have a number of policy implications. China seem to be the fastest growing SA trading partner. Several studies indicate that with the current economic performance in China, China will be the most powerful and leading state in economic performance and is likely to be a controlling state in the whole world. Therefore, SA must maintain and also make efforts to strengthen the bilateral relations with China so that as the economy grows there are spillover benefits from trading. Since there is a positive relationship between economic size and bilateral trade flows between SA and China, policies to boost economic growth in SA should be implemented so as to increase the volumes of trade. Female-owned business could be a source of job creation, generating diversity of the business population, stimulating innovation and change in production and marketing practices; therefore, the government must promote policies that create a more gender balanced economy to expand growth (IMF 2014). Lazzaro (2014) argues that there is a lot of work that women do in society that is not compensated. Child-rearing and homemaking are good examples. These contribute to the GDP. According to Lazzaro's argument, SA government should introduce a parental compensation fund, which will improve GDP.
On the other hand, a growth in population also increases trade volume. Population is a proxy for market size. A high population entails a high market for both foreign and local goods. The government of SA must raise the value of their child support grant, they must make primary education free for all and subsidise secondary and tertiary education. This boosts the population and has a long-term positive effect on trade.
Real exchange rate volatility has negative impacts on trade. The South African Reserve Bank must manage the exchange rate movements more efficiently in order to encourage trade. A fixed exchange rate policy must be adopted. The government should keep enough reserves in order to remain secure when the exchange rates moves from its controlled level. This can work only if the government has sufficient foreign reserves to control any disturbance to the fixed exchange rate. The Department of Trade and Industry should target trading with countries with larger economies and markets. The government should loosen trade restrictions on countries with larger economies and markets.
Acknowledgements
Competing interests
The authors declare that they have no financial or personal relationships that may have inappropriately influenced them in writing this article.
Authors' contributions
S.M. was responsible for the introduction, overview of South Africa and China trade and the theoretical and empirical literature. L.J. wrote the methodology and conclusion.
References
Alden, C. & YuShan, W., 2014, South Africa-China relations: Evolving cooperation, collaboration and competition, viewed 29 April 2015, from http://www.saiia.org.za/opinion-analysis/ [ Links ]
Appleyard, D.R., Field, A.J. & Cobb. S.L., 2010, International economics, 7th edn., McGrew Hill, Singapore. [ Links ]
Baak, S., 2004, Exchange rate volatility and trade among the Asia Pacific Countries, viewed 23 September 2017, from http://repec.org/esFEAM04/up.29293.1080736850.pdf [ Links ]
Bhagwati, J., 2010, Outward orientation: Trade issues, viewed May 2015, from http://www.academia.edu/190290/Bhagwati [ Links ]
Binh, D.T.T., Duong, N.V. & Cuong, H.M., 2006, Applying gravity model to analyse trade activities of Vietnam, viewed 23 September 2017, from http://www.freit.org [ Links ]
Dell'Ariccia, G., 1998, Exchange rate fluctuations and trade flows: Evidence from the European Union, viewed 17 March 2017, from https://www.imf.org/external/pubs/ft/wp/wp98107.pdf [ Links ]
Dornbusch, R., Fischer, S. & Startz, R., 1998, Macroeconomics, 12th edn., McGraw-Hill International Edition, New York. [ Links ]
Doumbe, E.D. & Belinga, T., A gravity model analysis for trade between Cameroon and twenty-eight European Union countries, viewed 29 September 2017, from https://file.scirp.org/pdf [ Links ]
DTI, 2010, Industrial policy action plan: Economic sectors and employment cluster, IPAP, South Africa, pp. 43-59. [ Links ]
Economy Watch, 2010, Gravity model of trade: Trade in world of global trade. International economic trade, viewed 09 April 2015, from http://www.economywatch.com/international [ Links ]
Ensor, L., 2014, Bilateral trade with China on the increase, viewed 21 June 2015, from http://www.bdlive.co.za/business/trade/2014/03/12/bilateral-trade-with-china-on-the-increase [ Links ]
Grimm, S., Kim, Y., Anthony, R., Attwell, R. & Xioo, X., 2014, South African relations with China and Taiwan: Economic realism and the one-China doctrine, viewed 23 June 2015, from http://www.ccs.org.za/wp…/02/Research-Report_FEB-2014_Formatting.pdf [ Links ]
Gujurati, G.N. & Porter, D.C., 2008, Basics econometrics, 5th edn., McGraw-Hill/Irwin, New York. [ Links ]
Hilbun, B.M., 2003, Analysis of trade in the Western hemisphere utilising a gravity model framework, viewed 01 May 2015, http://www.etd.lsu.edu/docs/available/etd-04192006-102931/…/Hilbun_thesis.pdf [ Links ]
Holden, M. & Macmillan, L. 2013. Do free trade agreements create trade for South Africa. viewed 18 June 2018, from https://www.scribd.com/document/57009792/Evaluation-of-Benefits-of-Trade-Agreements-for-S-a [ Links ]
International Monetary Fund, 2014, Achieving stronger growth by promoting a more gender balanced economy, viewed 12 October 2015, from http://www.oecd.org/g20/topics/employment-and-social-policy/ILO-IMF [ Links ]
International Monetary Fund, 2016, Exchange rates and trade flows: Disconnected, viewed 18 February 2016, from http://www.imf.org/external/pubs/ft/weo/2015/02/pdf/c3.pdf [ Links ]
Khumalo, S.A., Mishi, S. & Dlolo, 2013, Influence of trade agreements on South Africa's Trade patterns, viewed 14 March 2017, from www.essa2013.org.za/fullpaper/essa2013_2678.pdf [ Links ]
Kilic, R., 2002, Absolute and comparative advantage: Ricardian Model, viewed 21 November 2017, from https://msu.edu/course/ec/340/Kilic [ Links ]
Kowalski, K., Lattimore, R. & Bottini, N., 2009, South Africa trade and growth, OECD trade policy working paper, viewed 09 April 2015, from http://www.oecd.org/trade [ Links ]
Krugman, P., 1983, 'New theories of trade among industrial countries', American Economic Review 73(2), 343-347. [ Links ]
Lazzaro, J., 2014, Five policies to boost US GDP growth and create jobs, viewed 13 October 2015, from http://www.ibtimes.com/five-policies-boost-us-gdp-growth-create-jobs-1546906 [ Links ]
Levich, P., 2001, The theory of international trade, viewed 21 November 2017, from http://people.stern.nyu.edu/rlevich [ Links ]
Markusen, J. 2005, Modelling the offshoring of white collar services: From comparative Advantage to the new theories of trade and FDI, viewed 22 June 2015 from http://www.nber.org/papers/w11827 [ Links ]
Matha, T., 2000, Factor endowments, country size, and economic integration: The effects on structure of trade and industry, viewed 18 February 2016, from http://www.snee.org/filer/papers/46.pdf [ Links ]
Melitz, M.J. & Ottaviano, G.I.P., 2007, Market size, trade and productivity, viewed 18 June 2018, from http://docplayer.net/33771230-Market-size-trade-and-productivity.html [ Links ]
Mohr, P., Fourie, L. & Associates, 2008, Economics for South African students, 4th edn., Van Schaik, Pretoria. [ Links ]
Molepolle, S., 2015, Trade: South Africa vs China, viewed 22 June 2015, from http://www.tips.org.za/files/presentation_on_south_africa_-china_trade_and_investment_relation.ppt [ Links ]
Nicita, A., 2013, Exchange rate, international trade and trade policies, viewed 02 November 2017, from http://unctad.org/en/PublicationsLibrary/itcdtab57_en.pdf [ Links ]
Nuroglu, E., 2010, The impact of population on bilateral trade flows in the case of OIC, viewed 29 September 2017, from https://www.researchgate.net/profile/Elif_Nuroglu/publication [ Links ]
Organisation for Economic Co-operation and Development (OECD), 2017, African economic outlook: Entrepreneurship and industrialisation, viewed 20 November 2017, from http://www.africaneconomicoutlook.org [ Links ]
Provincial Treasury, 2013, South Africa's position in BRICS, viewed 24 June 2015, from http://www.treasury.gpg.gov.za/…/South%20African%20position%20in%20B [ Links ]
Republic of South Africa, 2014, The Presidency, viewed 27 June 2015, from http://www.thepresidency.gov.za/pebble.asp?relid=18588 [ Links ]
Sibanda, K., 2012, The impact of real exchange rates on economic growth: A case study of South Africa, viewed 08 October 2015, from http://contentpro.seals.ac.za/iii/cpro/app?id=6333087976197716&it emId=1007129&lang=eng&service=blob&suite=def [ Links ]
Sisaki, H., 2013, Positive and negative population growth and long run trade patterns: A non-scale growth model, viewed 23 September 2017, from https://www.econ.kyoto-u.ac.jp [ Links ]
Snorrason, S.Th., 2012, Asymmetric economic integration: Size characteristics of economies, trade costs and welfare, viewed 09 March 2017, from https://www.amazon.ca/Asymmetric-Economic-Integration-Characteristics-Economies/dp/3790828602 [ Links ]
Thai, T.D., 2006, A gravity model for trade between Vietnam and twenty-three European countries, viewed 01 May 2015, from http://www.divaportal.org/smash/get/diva2:518029/FULLTEXT01.pdf [ Links ]
The Presidency Republic of South Africa, 2014, South Africa signs agreements of cooperation with China, viewed 21 November 2017, from http://www.thepresidency.gov.za [ Links ]
TIPS, 2011, South Africa trade relations with the European Union and Asia, viewed 21 November 2017, from https://www.tips.org.za/research…/trade [ Links ]
Teweldemedhin, M.Y. & Schalkwyk, H.D., 2010, Regional trade agreements and its impact on trade flows for South African products, viewed 20 March 2017, from http://www.academicjournals.org/article/article [ Links ]
Weckstrom, A., 2013, Gravity model of trade and Russian exports, viewed 01 May 2015, from http://www.epub.lib.aalto.fi/en/ethesis/pdf/…/hse_ethesis_13325.pdf [ Links ]
Workman, D., 2015, World richest countries, viewed 21 June 2015, from http://www.worldsrichestcountries.com/top-south-africa-exports.html [ Links ]
World Bank, 2017, South Africa trade with China, viewed 22 June 2015, from http://search.worldbank.org/data?qterm=South+Africa+trade +with+China&language=&format [ Links ]
World Trade Report, 2009, Flexibility in trade agreements, viewed 09 March 2017, from https://www.wto.org/english/res_e/booksp_e/anrep_e/wtr09-2b_e.pdf [ Links ]
Xiong, F.H., 2012, China - South Africa relations in the context of BRICS, viewed 26 June 2015, from http://www.wiredspace.wits.ac.za/bitstream/handle/10539/12020/Xiong.thesis.pdf? [ Links ]
 Correspondence:
Leward Jeke
lewardjeke@gmail.com
Received: 18 Sept. 2017
Accepted: 30 May 2018
Published: 22 Oct. 2018

