


Services on Demand
Article
 English (pdf)
 Article in xml format
 Article references
Indicators

Related links
-
 Cited by Google
 -
 Similars in Google
Share

 Permalink
South African Journal of Economic and Management Sciences
On-line version ISSN 2222-3436
Print version ISSN 1015-8812
S. Afr. j. econ. manag. sci. vol.21 n.1 Pretoria 2018
http://dx.doi.org/10.4102/sajems.v21i1.1689
ORIGINAL RESEARCH
What do deviation cycles measure? An analysis of the informational content of filter-based business cycles
Willem H. Boshoff; Lewis McLean
Department of Economics, Stellenbosch University, South Africa
ABSTRACT
BACKGROUND: Empirical business cycle research typically commences with the extraction of a so-called deviation cycle using a time-series smoothing filter. This methodology is appealing for its pragmatism; it is easy to implement, and the output it produces is conveniently interpreted as percentage deviations from the natural level of output. However, recent literature offers staunch criticism of deviation cycle analysis, especially with regards to the assumption implicitly underlying it - that business cycle fluctuations are restricted to distinct intervals on the frequency domain
AIM: Despite its lack of a basis in theory, the analysis of deviation cycles over particular frequency ranges may still yield useful stylised business cycle facts. This, however, hinges on whether the information that a frequency filter captures consistently aligns with relevant theory-based business cycle concepts. Whether this is the case is an empirical matter, and herein lies the rationale for our research.
SETTING: We investigate the informational content of South Africa's output deviation cycles
METHODS: We extract deviation cycles at standard high- and medium-frequency ranges (denoted as short- and medium-term deviation cycles respectively) and analyse their informational overlap with the components of an alternative theory-based estimate of the business cycle, decomposed into demand, supply, domestic and foreign sources of business cycle dynamics.
RESULTS: Our findings suggest that the contents of deviation cycles extracted over a high-frequency range do not neatly correspond to the transitory 'demand-driven' business cycle, while cycles extracted over a medium-frequency range correspond closely to the combined path of permanent output shocks.
CONCLUSION: One should thus be cautious of drawing strong conclusions about the nature of business cycles from filter-based deviation cycle estimates, particularly if the objective of the study relies on assuming that high-frequency deviation cycles correspond to transitory demand shocks.
Introduction
Empirical business cycle research typically commences with the extraction of a so-called deviation cycle using a time-series smoothing filter. This methodology is appealing for its pragmatism; it is easy to implement, and the output it produces is conveniently interpreted as percentage deviations from the natural level of output. However, recent literature offers staunch criticism of deviation cycle analysis, especially with regard to the assumption implicitly underlying it: that business cycle fluctuations are restricted to distinct intervals on the frequency domain. If permanent shocks are a significant driver of the business cycle (as real business cycle theory suggests), business cycle dynamics may be inextricably linked to the low-frequency permanent component of output, presenting challenges for the core assumption underlying frequency-based business cycle analysis (Canova 1998; Harding & Pagan 2002). In short, the core assumption underlying deviation cycle analysis of business cycles may be at odds with economic theory, causing us to doubt its usefulness as a means of studying business cycles.
Despite the lack of a neat alignment between method and theory, the analysis of deviation cycles over particular frequency ranges may still yield useful stylised business cycle facts. This however hinges on whether the information that a frequency filter captures, consistently aligns with relevant theory-based business cycle concepts. Whether this is the case is an empirical matter, and herein lies the rationale for our research. We investigate the informational content of South Africa's output deviation cycles extracted at standard high- and medium-frequency ranges (denoted as short- and medium-term deviation cycles respectively) by comparing them with the components of an alternative theory-based estimate of the business cycle, decomposed into demand, supply, domestic and foreign sources of business cycle dynamics.
Our theory-consistent estimate of the business cycle consists of structural shocks to real output, which we estimate via an open-economy structural vector autoregressive (SVAR) model and identify by imposing long-run restrictions in the style of Blanchard and Quah (1989). In addition to its strong theoretical coherence, we selected the Blanchard-Quah identification strategy on account of its decomposability, which allows us to isolate the source of business cycle dynamics. Using one such decomposition allows us to differentiate permanent and transitory fluctuations in real output, what real business cycle theorists regard as demand and supply shocks (Plosser 1989). Isolating these sources of fluctuations in real output allows us to test whether short- and medium-term deviation cycles correspond neatly to transitory or permanent components of real output. Similarly, we also use the Blanchard-Quah identification strategy in conjunction with the open-economy specification of our SVAR to decompose real output into domestic and foreign shocks and assess whether either of these aligns more closely with deviation cycles extracted at different frequencies.
Subsequent to obtaining our estimates of the business cycle, the bulk of our analysis centres on simple Pearson correlations between our statistically identified components of the business cycle and our short- and medium-term deviation cycles estimates. While rudimentary, we deem this approach appropriate and sufficiently robust, given that we are comparing information extracted from the same time series. However, we supplement our analysis of the informational content of deviation cycles extracted over medium-range frequencies by testing for cointegration with the decompositions of our benchmark SVAR business cycle estimate. We thereby take advantage of the apparent nonstationarity of our medium-term deviation cycles estimate to determine what information is sufficient to render this time series stationary. Given that cointegration in a univariate setting implies that the two series contain the same underlying stochastic trend (Engle & Granger 1987), we regard cointegration between these series as an indication of extensive informational overlap.
Literature
Harding and Pagan (2005) develop a taxonomy of business cycle concepts that are typical in the applied literature of business cycle analysis, distinguishing between classical, deviation and growth rate cycles. Classical cycles, the original business cycle concept used by Burns and Mitchell (1946), as well as central banks and research institutes such as the NBER, refers to cycles in the level of the output series. Deviation cycle analysis involves identifying and removing a so-called 'permanent component' from the output series; the remainder is then a set of serially correlated deviations called deviation cycles.1 Growth rate cycles, that is, cycles in growth rates, capture periods of accelerating and decelerating growth. These are a special type of deviation cycle, wherein the previous value of output is regarded as the permanent component. Economies experiencing sustained growth do not often exhibit classical cycles (see Mintz 1969) and mainstream business cycle research consequently departs predominantly from the analysis of deviation cycles. For a more thorough discussion of different business cycle concepts see Harding and Pagan (2005) or see Du Plessis (2006) for a concise summary.
Deviation cycle analysis is based on the decomposition of a time series into a growth component and a cyclical component. When applying this decomposition to real output data, the cyclical component is regarded as a measurement of the business cycle, and the permanent component is often interpreted as a measure of Lucas's (1977) concept of potential output. These applications are common in the literature of applied macroeconomics, forming the basis of numerous papers in the South African and international literature. For example, Boshoff and Fourie (2010) incorporate an analysis of deviation cycles in South African real output as part of their assessment of the relationship between economic activity and trade in the early Cape colony, where they find evidence that deviation cycles in productivity and trade are positively related. Kabundi and Loots (2007) depart from the extraction of deviation cycles and subsequent estimation of dynamic correlation coefficients in their analysis of co-movement between South African real output and those of the other 13 Southern African development community countries, and similar research has been conducted for South Africa and Germany (Kabundi & Loots 2010) and South Africa and the United States of America (U)S (Kabundi 2009). In the international literature, deviation cycles have served as a point of departure for establishing stylised facts about business cycles in developed and developing countries.2
The widespread usage of the deviation cycle method makes due consideration of its weaknesses a worthy concern. In this regard, Harding and Pagan (2002) have raised staunch criticisms of filter-based business cycle analysis. Firstly, they argue that the practice of shifting all information beyond the short-term into a permanent component may be associated with significant loss of information relevant for business cycle research. Their position departs from real business cycle theory, which implies that business cycles should not necessarily be regarded as transitory disturbances to a smooth long-run growth path (Blanchard 1997; Krugman 1998; Sargent 1999; Solow 2000). From this theoretical point of departure, it is arguable that the removal of permanent shocks from real output is at odds with business cycle research, particularly if the aim of that research is to obtain a plausible overall representation of business cycles. However, Harding and Pagan (2002) also note that removing a filter-estimated trend from real output data does not necessarily remove the permanent shocks to the time series. Thus, even if the researcher's aim is to isolate transitory shocks to real output, frequency filters do not necessarily deliver the desired result. In sum, it might be said that the core contention that underlies Harding and Pagan's (2002) critique is that deviation cycle analysis unduly circumvents the statistical identification problem that is fundamental to business cycle research, providing convenient estimates of quantities that may not correspond to any theoretical notion of the business cycle.
Despite this identification deficit, deviation cycles may still yield useful stylised facts and insights into business cycle dynamics. Frequency filters are advantageously flexible, allowing researchers to check the robustness of their results by isolating and analysing cyclical variation in real output at various frequency ranges, and recent research based on deviation cycle analysis has used this flexibility to conduct business cycle research that investigates and accounts for the impact of frequency range choices on stylised business cycle facts. For example, Comin and Gertler (2006) show that the high-frequency characterisation of business cycles provides limited insight into their nature given that economies also exhibit medium-term fluctuations. Comin et al. (2012) use the same concepts to show that short-term business cycles tend to have large and persistent effects in developing countries, and thus propagate into medium-term fluctuations. This research seems to indicate that an analysis of medium-term deviation cycles may be an appropriate point of departure to understanding of business cycle dynamics and propagation. However, regardless of frequency range choices, research on the dynamics of deviation cycles still departs from an atheoretical basis and thus remains exposed to the Harding and Pagan (2002) critique: given the purely statistical basis of this methodology, the researcher simply cannot know precisely what information is captured at any choice of frequency ranges.
It is on account of this problem that we provide this evaluation of the informational content of deviation cycles in South African real output. We extract deviation cycles over frequencies conventionally used to capture short- and medium-term business cycle movements and compare them with business cycle estimates obtained from a structural econometric model. As discussed below, our SVAR estimate of the business cycle can be decomposed into transitory and permanent shocks (loosely interpreted as demand and supply shocks) and into domestic and foreign shocks. Comparison with these decompositions of the business cycle allows us to observe the extent to which deviation cycles, extracted at different frequencies correspond to these sources of business cycle fluctuations in South African real output.
Methodology
We use the Christiano and Fitzgerald (2003) (CF) filter to extract deviation cycles for domestic output. Our choice of filters was informed by research that suggests that the CF filter outperforms others when considering longer-term fluctuations (Zarnowitz & Ozyildirim 2006). We define the high-frequency (i.e. short-term) deviation cycle as the component of output corresponding to a frequency range of 6-32 quarters. This is the business cycle frequency range used by King and Watson (1995), King and Rebelo (1999) and Guay and St-Amant (2005). Medium-term deviation cycles are extracted for a frequency range of 6-200 quarters. The medium-term deviation cycles thus contain both high- and medium-frequency components, where the medium-frequency component ranges from 32 to 200 quarters.
As noted previously, filters are statistical instruments with no basis in economic theory. However, an alternative approach to estimating business cycles that grapples directly with the identification problem is the SVAR identification strategy developed by Blanchard and Quah (1989). In their influential paper, Blanchard and Quah (1989) show that it is possible to recover permanent and transitory structural shocks to real output from a two-variable reduced-form VAR by restricting the long-run response of real output to transitory shocks to zero. Consistent with real business cycle theory, one can then represent the contribution of transitory shocks and permanent shocks to the evolution of real output.
Following this work, various authors investigate the sources of business cycles using VAR estimation and the Blanchard-Quah identification strategy, and some have subsequently extended the framework to a greater number of variables, thus increasing the number of distinct structural shocks that may be estimated. For instance, Karras (1993) estimates such a model for the US, Ahmed and Park (1994) for a sample of small open economies, Karras (1994) for various European economies, West (1992) for Japan and Du Plessis, Smit and Sturzenegger (2008) for South Africa. In all instances, these authors use the Blanchard-Quah identification strategy to recover permanent and transitory shocks to real output, which they often interpret as aggregate demand shocks (transitory shocks to real output) and supply shocks (permanent shock to real output). They then cumulate the demand or supply shocks to derive a demand- or supply-based estimate of the business cycle. This is precisely the approach we take to obtain a structural estimate of the components driving fluctuations in real output for South Africa.
The study by Du Plessis et al. (2008) provides the basis for our SVAR-based estimate of the factors underlying the South African business cycle. Their study departs from a three variable SVAR, wherein government expenditure as a percentage of GDP and the real interest rate are used to identify demand shocks to output. We extend the Du Plessis et al. (2008) study along two dimensions. Firstly, we incorporate data following the sample period set out in their study (2007Q1 - 2015Q3), which allows us to observe how output has evolved since the recent financial crisis and subsequent European debt crisis. Secondly, we add two variables to the model that allow us to explicitly model the evolution of South African output in response to global shocks. Given that the Blanchard-Quah decomposition is standard in the literature we provide a cursory description of the identification procedure. See Du Plessis et al. (2008) or Clarida and Gali (1994) for a more extensive overview of this procedure for VARs of three or more variables; also see Enders (2010) for an introduction to VARs, SVARs and the Blanchard-Quah identification strategy for the case of a two-variable VAR.
Variable selection is the first step to achieving identification via the Blanchard-Quah methodology. Following Clarida and Gali (1994) and Du Plessis et al. (2008), the domestic components of our model consist of real GDP (yt) along with two sources of demand shocks, namely government expenditure as a percentage of GDP (gt) and the real interest rate (rt). Tests for unit roots in these variables were performed and the results are excluded for brevity (results are available upon request). We find a unit root in all series except for the real interest rate.
The model estimated by Du Plessis et al. (2008) does not explicitly account for the impact of global shocks and their dynamics in relation to the other (domestic) variables. Given South Africa's small open-economy status, taking into account the effect that global shocks have on the economy seems appropriate. To this end, we augment the model proposed by Du Plessis et al. (2008). Following Balcilar and Tuna (2009), we add two additional variables chosen to identify global shocks to the economy: a trade weighted proxy for world output  and the rand-denominated real oil price
  . Augmented Dickey-Fuller (ADF) tests confirm that these variables are difference stationary.
Variable section is important for obtaining a well-specified VAR, but it should be noted that our interest lies in the evolution of the structural shocks underlying these variables and the extent to which they determine the evolution of real output in particular. We are not interested in the causal parameters of these variables as determinants of real output. Additional variables that may constitute further sources of transitory and permanent shocks abound, but we have chosen to limit our specification to these five variables on account of data availability, the precedent set by Du Plessis et al. (2008), in the case of domestic variables, and that of Balcilar and Tuna (2009), in the case of external variables.
The next step in following Blanchard and Quah (1989) is to ensure that our data are stationary. Thus we first-difference  and
and  , and we find that they are difference stationary - we denote these as
  and
and  . While ADF tests indicates that gt is difference stationary, we hold the argument maintained by Du Plessis et al. (2008), that the ratio of government expenditure to GDP cannot possibly be the product of a unit root process.3 Tests of the stability of the VAR did not indicate that including gt in levels destabilises the system.
Our system of equations can be represented as a vector moving-average process of the form Yt = C(L)εt, where  is our vector of dependent variables,
  our vector of structural shocks.
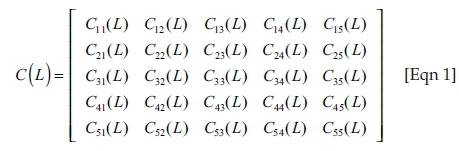
C(L) is an infinite order lag polynomial matrix defined as C(L) = C0 + C1L + C2L2 + C3L3 … in the lag operator L, where each Cn for n = 0,1,2, is a 5×5 matrix containing the contemporaneous impact of εt−n on Yt. The matrix C(L) thus represents the cumulative impact of all preceding structural shocks on the system of variables Yt.
Each of the five structural shocks contained in the vector εt are assumed to be independently, identically distributed and serially uncorrelated. We will refer to these, from left to right, as the oil price shock  , global output shock
  , domestic output shock
  , government expenditure shock
  and real interest rate shock
  . Despite our naming convention, it is important to note that variation due to these five shocks do not correspond uniquely to any one of these five variables. As discussed in Enders (2010), this representation assumes that the system of variables is endogenous to five distinct structural shocks. This is made clear by the unrestricted matrix C(L), which allows each shock contained in εt to impact Yt to an arbitrary extent. Consequently, given the current state of the matrix C(L) it is not possible to differentiate these shocks from one another, that is, the system Yt = C(L)εt is an unidentified VAR. However, we can identify the structural shocks in εt by placing a sufficient number of restrictions on C(L), the required number of restrictions being 10 in this instance (see Enders 2010). This is precisely the crux of the Blanchard-Quah identification strategy, that we can recover structural shocks underlying the progression of a set of endogenous variables Yt via imposing theory-based restrictions on the long-run impact of the shocks εt on the variables Yt.
In addition to standard normalisation assumptions on εt, the remaining assumptions required to achieve identification are a set of restrictions on C(L) However, because we have assumed that the shocks in εt are independent and serially uncorrelated, we can identify εt by imposing restrictions on the matrix:
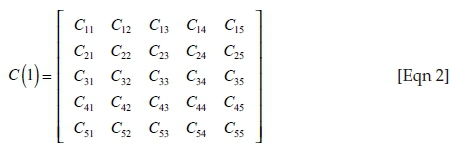
This we obtained by setting L = 1. The matrix C(1) represents the cumulative impulse response of the vector Yt to a single pulse of all five elements of εt. In its current state, the matrix C(1) would allow for any of our five structural shocks to have a permanent effect on any one of the five variables in our VAR. However, if we are willing to assume that our unobserved structural shocks do not permanently affect a sufficient number of variables in our model (i.e. if we assume that a sufficient number of elements in C[1] are in fact zero) then we can recover each of the distinct shocks in εt.
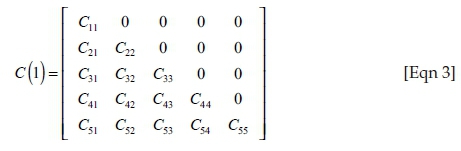
Following Balcilar and Tuna (2009), we thus achieve identification by imposing the following 10 restrictions on the matrix C(1). Firstly, we assume that permanent shocks to world output  do not affect the real price of oil in the long run. This implies that C12 = 0. Next, the assumption that South Africa is a small open-economy implies that domestic shocks to domestic variables have no long-run impact on foreign variables, and as such that C13 = C14 = C15 = C23 = C24 = C25 = 0. Lastly, we assume that monetary shocks
  do not have a long-run impact on government expenditure and domestic output, and that shocks to government expenditure
  do not have a long-run effect on domestic output, implying that C34 = C35 = C45 = 0. Incorporating the above on the matrix C(1) gives the identified long-run impact of the shocks on the endogenous variables:
From these assumptions we have a sufficient number of restrictions to estimate the matrix C(1) and hence to identify the shocks in εt. For the sake of brevity, we do not discuss the process of obtaining εt in detail here, as the process of moving from restrictions on C(1) to estimates of εt is a matter of mere computation now that we have restricted C(1) to a lower-triangle matrix. (Clarida and Gali, 1994, provide a step-by-step guide to this process.) However, for completeness sake we note succinctly that as under our 10 identifying assumptions the matrix C(1) may be obtained as the lower-triangle Cholesky decomposition C(1) C(1)' = R(1) ΣR(1)', where Σ and R(1) are respectively the variance-covariance matrix and cumulative impulse response matrix of an unidentified VAR of the form Yt = R(L)ut, and where ut is its vector of reduced-form disturbances. Once we have estimated Yt = R(L)ut, we can write  , thus identifying εt (Clarida and Gali 1994).
With εt identified we can assess the informational content of deviation cycles extracted at different frequency ranges. We compare the content of deviation cycles with a range of combinations of structural shocks, with particular emphasis on the path of transitory shocks, that is, the demand-based business cycle as defined in Du Plessis et al. (2008) ( and
and  ), the path of aggregate supply disturbances, which we define as the combination of all permanent shocks to yt (
 and
and  ), the combined path of domestic shocks, both transitory and permanent (
 and
and  ), and the path of global shocks to output
  and
and  .
.
As a final note on our methodology, we acknowledge that the results of our analysis rest on whether or not the Blanchard-Quah identifying assumptions hold for our five variable VAR. With respect to the assumptions of spherical and serially uncorrelated error terms, we can (and do) test this, but we unfortunately cannot test whether our restrictions on the long-run impact matrix are valid. Our analysis also relies on the general efficacy of the Blanchard-Quah identification strategy. Lippi and Reichlin (1993) show, for instance, that several nonstandard moving-average representations produce results quite different from those obtained by Blanchard and Quah (1989) in their original application of the strategy. Even so, it must be remembered that the business cycle is an unobserved theoretical construct, and hence quantifying it necessarily requires some assumptions about the process underlying it. In the case of frequency filters, the implicit identifying assumption seems to be that the business cycle is in all instances restricted to a subset of the frequency domain, and this is clearly far removed from explicit economic reasoning. In contrast, the Blanchard-Quah identification strategy provides a set of explicit and economically sensible assumptions that produce an estimate of the business cycle. Notwithstanding the inevitability that the Blanchard-Quah identifying assumptions may not hold, the business cycle estimates it produces follow from a sensible application of economic theory. Hence, we propose that in the absence of any objective alternative measure of the business cycle, our method of assessing the informational content of filter-based deviation cycles provides an important step in the direction of becoming critically aware of the limitations of deviation cycle analysis and filter-based business cycle estimation broadly.
Data
We estimate deviation cycles and SVAR-based structural shocks to real output on a sample period from 1961Q2 until 2015Q3, chosen on the basis of data availability. We define real output, our variable of interest, as real GDP measured at a quarterly frequency. Quarterly data for South African real output and government expenditure and monthly data for the repo rate were obtained from the South African Reserve Bank (SARB 2016).
Quarterly real output for the US, the United Kingdom (UK), Australia and Japan (all obtained from the International Monetary Fund's International Financial Statistics Database, 2016) and Europe (obtained from the Organisation for Economic Co-operation and Development's OECD.stat database, 2016) were averaged to construct a proxy for global output. This selection was informed by the variables used by Boshoff (2010), updated to include Japan on account of its importance as major trading partner to South Africa. Note that China was initially considered as an additional economy to be included in our measure of global output but was omitted due to the limited availability of data detailing real output in China prior to the mid-1970s.
Monthly and quarterly South African consumer price index (CPI) and the quarterly series of the West Texas Intermediate (WTI) spot oil price and the rand-dollar exchange rate (used to convert the spot oil price to rand) were obtained from Quantec's EasyData database. We calculate the quarterly real interest rate from monthly data using the 'within-quarter' formula from Du Plessis, Smit and Sturzenegger (2007). The WTI spot oil price was first converted to nominal rand, then to real rand using the quarterly CPI. All data are seasonally adjusted with 2010 as the base year.
In the final specification of our SVAR, the real rand-denominated oil price, our proxy for global output and domestic real output, are specified in log-differences; the ratio of government expenditure to GDP and the real interest rate are included in levels.
Estimation and results
We apply the CF filter to the log of South African real GDP data. The results are reported in Figure 1, which shows both the high- and medium-frequency deviation cycles along with the medium-term component. Recall that our high-frequency deviation cycles are the variations in real output within the frequency range of 6-32 quarters, and that the medium-term deviation cycle encompasses both the high-frequency and medium-frequency component, that is, it encompasses the frequency range of 6-200 quarters. As such, the difference between the medium-term cycles and the medium-frequency component (i.e. the variation in real output in the frequency range from 32 to 200 quarters) gives the high-frequency deviation cycles. Values are expressed as a percentage of the low-frequency component. The shaded area indicates the period following the financial crisis.
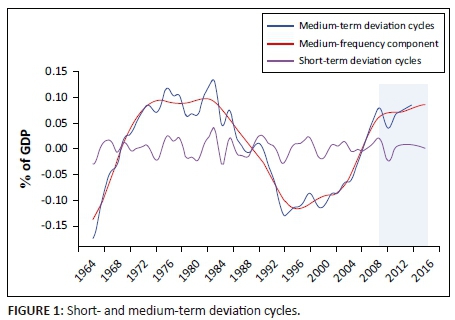
Several features of Figure 1 are worth noting. The medium-frequency component is clearly characterised by a larger amplitude across the entire sample period. Following Giannone and Reichlin (2005), we interpret this as an indication that short- and medium-frequency components of South Africa's business cycle contain distinct information. Historically, the medium-term deviation cycle reaches a local minimum during the time that South Africa underwent its democratic transition and started to recover thereafter. This feature is consistent with Boshoff (2010), who finds that the medium-term deviation cycle starts declining relative to the low-frequency component in the early 1980s and falls below the low-frequency component in the late 1980s. Boshoff (2010) attributes this marked decline to the political unrest, economic sanctions and subsequent debt standstill that characterised South Africa in the 1980s. Note that the cycle only moved above its permanent component recently, since 2005. Similar to Boshoff (2010), we find that since about 2002 the short-term deviation cycle is smaller in comparison with the medium-frequency component, a finding which he ascertains implies that 'strong output growth since 2003 could be ascribed to a longer-term momentum, rather than short-term spikes'. However, since the onset of the crisis, the short-term deviation cycle again increases relative to the medium-frequency component, in line with the recent sluggish and volatile output growth discussed previously.
For our theoretical benchmark, we estimate the SVAR described above at six lags. We conducted standard specification tests for normality and autocorrelation on the unrestricted VAR (the results have been omitted for brevity and are available upon request). Tests for autocorrelation were deemed passable, but it should also be noted that the unrestricted VAR did not pass tests for the joint normality of the residuals. This result seemed to follow primarily from world output, whose residual series is platykurtic on account of the great recession. Adding additional lags did not correct this misspecification. We do not attempt to correct for this finding by including outlier dummy variables, as this would unduly reduce the information contained in the residual series (and hence in our estimates of the vector of structural shocks). Furthermore, we maintain that non-normality is not so problematic in this context. While the assumption that the residuals are uncorrelated is necessary for the structural decomposition of the estimated residuals into structural shocks (Clarida & Gali 1994), the assumption of spherical residuals is only necessary for statistical inference with ordinary least squares. We thus proceed, noting that inference on the coefficients of our model is biased.
Table 1 provides a first look at the extent of the informational overlap between combinations of structural shocks to output and deviation cycles at different frequency ranges. We also check for correlation between the medium-term deviation cycle and structural shocks in differences, on account of the apparent nonstationarity of these series. Of course, filtered data is mean-reverting by design, but we investigate the extent of the relationship between changes in these series so as to check the robustness of our result in levels. Correlation between cycles and structural shocks is positive for all but the shock to the real interest rate,  . The positive contemporaneous correlation with the shock real price of crude oil, found for all three series, is a counterintuitive result. However, as was mentioned in our discussion of the Blanchard-Quah methodology, it must be remembered that
  cannot strictly be interpreted as oil price shocks;
  is the series of shocks that has a permanent effect on the price of oil after factoring out the systematic relationship between the oil price and the other variables included in our SVAR model. Presumably, this series will contain shocks underlying variations in commodity prices more generally, where we might anticipate that positive shocks to commodity prices will be positively related to domestic real output. All other positive correlations are consistent with our intuition.
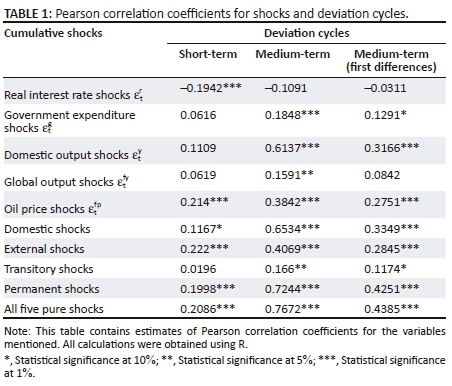
With reference to short-term deviation cycles, we find that there is substantial correlation with the negative demand shocks that correspond to the real interest rate  . The pure demand shock underlying government expenditure
  exhibits a positive correlation with the short-term cycles but is the least correlated with short-term cycles of all of the pure shocks (the correlation coefficient is also statistically insignificant). Interestingly, the combined path of these transitory shocks produces the smallest correlation coefficient of all the combinations we consider, seemingly indicative of some degree of countercyclicality between these demand shocks. This result can also be observed in Figure 2a, which shows that the combined path of transitory shocks is characterised by low variance relative to that of the short-term deviation cycles.
In contrast with these results, it is interesting to note the correlation coefficient corresponding to  . While the other permanent shocks (
 and
and  ) show no significant correlation with the short-term deviation cycle, the oil price shock
  is the pure shock with the single highest correlation with the series of short-term deviation cycles. The correlation coefficient on
  of 0.214 even exceeds the correlation associated with the combination of all permanent shocks (
 and
and  ) as well as the correlation with all five shocks. Only the correlation coefficient of 0.222 associated with the combination of external shocks (
 and
and  ) exceeds the coefficient associated with
  (a result that in any case appears to be primarily driven by the correlation with
  ). Observing the patterns in Figures 2b and 2d, it is apparent that the series of permanent and external shocks appear to align closely with the short-term deviation cycle turning points. In contrast, the combined path of domestic shocks (Figure 2c) exhibits cycles that occur over longer periods than those of the short-term deviation cycles.
In sum, the two factors most strongly related to short-term deviation cycles are transitory shocks associated with the real interest rate and permanent shocks associated with real oil prices. Short-term deviation cycles, frequently interpreted as transitory demand shocks, do not appear to be strongly related with the combined path of (domestic) transitory shocks. We regard these findings as cursory evidence corroborating the critique of Harding and Pagan (2002), illustrating that high-frequency deviation cycles in South African output do not neatly correspond to transitory shocks.
Turning now to observations regarding medium-term cycles, permanent shocks (with a correlation of 0.7244) account for a far greater proportion of deviation cycle variation at this frequency than do transitory shocks (0.166). The varying extents of overlap between medium-term cycles and transitory and permanent shocks is evident in Figures 3a and 3b. Note that while the combined path of all five structural shocks exhibits the highest overall correlation (0.7672) with the medium-term cycles, it is only marginally more correlated than the combined path of all permanent structural shocks (which shows a correlation coefficient of 0.7244).
It is particularly interesting to note that the combination of transitory shocks is more strongly correlated with medium-term cycles than with short-term cycles. In fact, barring the correlation reported for the real interest rate, it seems that the cycles and shocks are more strongly related in the medium term for all of the reported combinations of structural shocks - this observation is robust, holding for the correlations reported for both the levels and differences of these series. Tentatively, we regard the finding that the combined path of transitory shocks is more strongly correlated with medium-term cycles than with short-term as a corroboration of the notion that medium-term deviation cycles are less prone to discarding relevant business cycle information.
Considered along the domestic-external dichotomy, we find that the combined path of domestic shocks to output has a reportedly higher correlation with medium-term cycles than do external shocks - these series are depicted in Figures 3c and 3d. Referring again to Table 1, these findings contrasts with what we observe for short-term cycles, which are reportedly more strongly correlated with external shocks than with domestic shocks. This result appears to be primarily driven by correlation with the permanent domestic shock  . This is an intuitive result, indicating that what would often be interpreted as domestic supply (permanent) shocks account for the majority of the medium-term variation in domestic output.
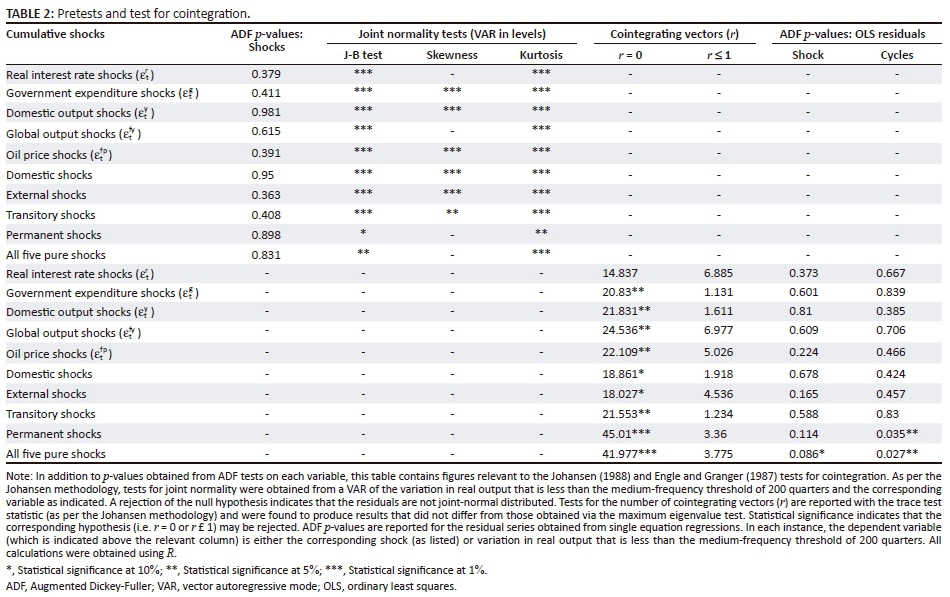
In order to further investigate the overlap between medium-term cycles and different combinations of structural shocks, we test for cointegration between these series. We test the stationarity of the medium-term cycles and find them to be difference stationary. Thus, if a regression of these cycles on a series of structural shocks yields stationary residuals, this might be regarded as an indication that the cycles capture the same stochastic trend as the shocks. For these tests, we capture the medium-term component of the business cycle by simply removing the long-term component - that is, we use the information captured in the frequency range 1-200 quarters. This leads to better behaved specification tests than for results obtained using medium-term cycles as defined earlier but does not change the conclusions we draw from our tests for cointegration.
Table 2 presents specification tests and tests for cointegration for the medium-term cycles and 10 different combinations of structural shocks to domestic output. Following the Johansen (1988) procedure, we first test for stationarity among the combinations of structural shocks; we find that none of these series is stationary at any traditional level of significance. We then estimate an unrestricted VAR for the cycles and each one of the combinations of structural shocks in levels. Each VAR was run with a lag length selected by the Akaike information criterion (AIC). Specification tests reported in Table 2 indicate that the only VAR that passes the Jarque-Bera (J-B) test for joint normality at the 5% level is the VAR containing the combined path of permanent shocks to real output. However, even the combined path of permanent shocks to output fails the joint test for normality with regard to kurtosis at the 5% level. For completeness sake, in Table 2 we show that four of the VARs that fail the J-B test at the 1% level yield Johansen test results indicative of cointegration at the 5% level, and that the Johansen tests on the VARs estimated on the combined path of permanent shocks and on the combined path of all shocks indicate the presence of a cointegrating vector at the 1% level of significance. However, the J-B test results cast doubt on one of the key assumptions necessary for the validity of the maximum-likelihood-based Johansen test.
On account of the non-robustness of the Johansen procedure under non-normally distributed errors, we opt to test for cointegration via the Engle and Granger (1987) procedure. The Engle-Granger test for cointegration does not require the strong assumption of normally distributed errors for validity, reducing our risk of a type one error. Table 2 reports ADF tests of the residuals obtained from OLS regressions of the cycles on each of the shocks and of the shocks on each of the cycles. We find that none of the residuals of the shocks regressed on the cycles test as stationary at the 5% or even the 10% level; it is worth noting, however, that the combined path of permanent shocks to output is associated with a p-value of 0.114, and that the combined path of all five shocks tests as stationary at the 10% level of significance. Reversing our specification, ADF tests indicate that a regression of the cycles on either the combined path of permanent shocks or the combined path of all shocks produces residuals that test as stationary at the 5% level. No other set of cycle residuals tests as stationary at any traditional level of significance.
In sum, our tests for cointegration yield an interesting refinement to the findings reported in Table 1. As discussed above, the results reported in Table 1 indicate that all of the structural shocks (barring the real interest rate shock) are more strongly correlated with medium-term deviation cycles than with short-term deviation cycles. Here we find that the combined path of permanent shocks and the combined path of all five shocks - the two series of structural shocks that were found to have the highest correlation with the medium-term deviation cycles - also appear to be cointegrated with medium-term deviation cycles. Our Engle-Granger tests show that in addition to being highly correlated with medium-term deviation cycles, the combined path of permanent shocks and of all five shocks contain sufficient informational overlap with these cycles to render them stationary. Thus, interpreting our tests for cointegration as tests for a common underlying stochastic trend (Engle & Granger 1987), these test results are indicative of a strong degree of informational overlap between these series.
Conclusion
Our comparison of deviation cycles with business cycles identified by an open-economy SVAR model produced several tentative, but interesting, conclusions. We did not find evidence that the high-frequency deviation cycle neatly corresponds to the purely transitory demand-based business cycle as measured by the open-economy SVAR. Rather, permanent shocks to output (often interpreted as supply shocks) seem to constitute an important source of variation in the high-frequency deviation cycle. Medium-term cycles were more strongly related with all shocks and combinations thereof, except shocks to the real interest rate. However, it seems that medium-term deviation cycles primarily capture business cycle information driven by permanent shocks to output, as suggested by our tests for cointegration.
Our findings suggest that deviation cycle analysis should be interpreted with caution. The medium-term deviation cycle seems to provide a good approximation of the South African business cycle, if one is interested in studying cycles derived from both transitory and permanent shocks, that is, demand- and supply-side variation in output. However, we did not find that short-term deviation cycles capture distinctly transitory, demand-driven information, as has been assumed in some applications. One should thus be cautious of drawing strong conclusions about the nature of business cycles from filter-based deviation cycle estimates, particularly if the objective of the study relies on assuming that high-frequency deviation cycles correspond to transitory demand shocks.
Acknowledgements
Willem Boshoff would like to acknowledge financial support from Economic Research Southern Africa (ERSA) for an earlier version of the paper, which appeared as a working paper: ERSA Working Paper 200. Willem Boshoff would like to thank Laurie Binge for research assistance on an earlier revision and would like to thank Adrian Pagan for enlightening discussions on an early version of this article, which led to the current version
Competing interests
The authors declare that they have no financial or personal relationships that may have inappropriately influenced them in writing this article.
Authors contributions
W.H.B. was responsible for the concept and earlier econometrics. L.M. dealt with the econometrics.
References
Ahmed, S. & Park, J.H., 1994, 'Sources of macroeconomic fluctuations in small open economies', Journal of Macroeconomics 16(1), 1-36. https://doi.org/10.1016/0164-0704(94)90042-6 [ Links ]
Balcilar, M. & Tuna, G., 2009, 'Sources of macroeconomic fluctuations in a volatile small open economy', Turkish Studies 10(4), 613-629. https://doi.org/10.1080/14683840903384877 [ Links ]
Blanchard, O., 1997, 'The medium run', Brooking Papers on Economic Activity 28(2), 89-158. https://doi.org/10.2307/2534687 [ Links ]
Blanchard, O.J. & Quah, D., 1989, 'The dynamic effects of aggregate demand and supply disturbances', American Economic Review 79(4), 655-673. [ Links ]
Boshoff, W.H., 2010, The economic content of cycles extracted with high- and medium-frequency band-pass filters: An application to South African business cycles, ERSA Working Paper No. 200, Economic Research Southern Africa, Cape Town. [ Links ]
Boshoff, W.H. & Fourie, J., 2010, 'The significance of the Cape trade route to economic activity in the Cape Colony: A medium-term business cycle analysis', European Review of Economic History 14, 469-503. https://doi.org/10.1017/S1361491610000134 [ Links ]
Burns, A. & Mitchell, W.C., 1946, Measuring business cycles, National Bureau of Economic Research, New York. [ Links ]
Canova, F., 1998, 'Detrending and business cycle facts', Journal of Monetary Economics 41, 475-512. https://doi.org/10.1016/S0304-3932(98)00006-3 [ Links ]
Christiano, L. & Fitzgerald, T., 2003, 'The band pass filter', International Economic Review 44(2), 435-465. https://doi.org/10.1111/1468-2354.t01-1-00076 [ Links ]
Clarida, R. & Gali, J., 1994, 'Sources of real exchange rate fluctuations: How important are nominal shocks', Carnegie-Rochester Conference Series on Public Policy 41, 1-56. https://doi.org/10.1016/0167-2231(94)00012-3 [ Links ]
Comin, D. & Gertler, M., 2006, 'Medium term business cycles', The American Economic Review 96(3), 523-551. https://doi.org/10.1257/aer.96.3.523 [ Links ]
Comin, D., Loayza, N., Pasha, F. & Serven, L., 2012, Medium term business cycles in developing countries, NBER Working Paper Series Working Paper No. 15428, National Bureau of Economic Research, Cambridge, MA. [ Links ]
Du Plessis, S.A., 2006, Business cycles in emerging market economies: A new view of the stylised facts, Stellenbosch Economic Working Paper No. 02/2006, Bureau for Economic Research, Stellenbosch University, Stellenbosch. [ Links ]
Du Plessis, S.A., Smit, B. & Sturzenegger, F., 2007, 'The cyclicality of monetary and fiscal policy in South Africa since 1994', South African Journal of Economics 75(3), 391-411. https://doi.org/10.1111/j.1813-6982.2007.00128.x [ Links ]
Du Plessis, S.A., Smit, B. & Sturzenegger, F., 2008, 'Identifying aggregate supply and demand shocks in South Africa', Journal of African Economies 17(5), 765-793. https://doi.org/10.1093/jae/ejn005 [ Links ]
Enders, W., 2010, Applied economic time series, 3rd edn., Wiley International, Hoboken, NJ. [ Links ]
Engle, R.F. & Granger, W.J., 1987, 'Co-integration and error correction: Representation, estimation, and testing', Econometrica 55(2), 251-276. https://doi.org/10.2307/1913236 [ Links ]
Giannone, D. & Reichlin, L., 2005, 'Euro area and U.S. recessions, 1970-2013', in L. Reichelin (ed.), Euro area business cycle: Stylized facts and measurement issues, Center for Economic Policy Research, Washington, DC. [ Links ]
Guay, A. & St-Amant, P., 2005, Do the Hodrick-Prescott and Baxter-King filters provide a good approximation of business cycles, Technical Report No. 78, Bank of Canada, Ottawa. [ Links ]
Harding, D. & Pagan A.R., 2002, 'Dissecting the cycle: A methodological investigation', Journal of Monetary Economics 49(2), 365-381. https://doi.org/10.1016/S0304-3932(01)00108-8 [ Links ]
Harding, D. & Pagan, A.R., 2005, 'A suggested framework for classifying the modes of cycle research', Journal of Applied Econometrics 20(2), 151-159. https://doi.org/10.1002/jae.838 [ Links ]
IMF, 2016, International financial statistics, Database, International Monetary Fund, Washington, DC. [ Links ]
Johansen, S., 1988, 'Statistical analysis of cointegration vectors', Journal of Economic Dynamics and Control 12(2-3), 231-254. https://doi.org/10.1016/0165-1889(88)90041-3 [ Links ]
Kabundi, A., 2009, 'Synchronization between South Africa and the U.S.: A structural dynamic factor analysis', South African Journal of Economics 77(1), 1-27. https://doi.org/10.1111/j.1813-6982.2009.01200.x [ Links ]
Kabundi, A. & Loots, E., 2007, 'Co-movement between South Africa and the Southern African development community: An empirical analysis', Economic Modelling 24, 737-748. https://doi.org/10.1016/j.econmod.2007.02.001 [ Links ]
Kabundi, A. & Loots, E., 2010, 'Patterns of co-movement between South African and Germany: Evidence from the Period 1985 to 2006', South African Journal of Economics 78(4), 383-399. https://doi.org/10.1111/j.1813-6982.2010.01253.x [ Links ]
Karras, G., 1993, 'Sources of U.S. macroeconomic fluctuations: 1973-1989', Journal of Macroeconomics 15(1), 47-68. https://doi.org/10.1016/0164-0704(93)90052-N [ Links ]
Karras, G., 1994, 'Sources of business cycles in Europe: 1960-1988. Evidence from France, Germany, and the United Kingdom', European Economic Review 38(9), 1763-1778. https://doi.org/10.1016/0014-2921(94)90049-3 [ Links ]
King, R. & Rebelo, S.T., 1999, 'Resuscitating real business cycles', in J.B. Taylor & M. Woodford (eds.), Handbook of macroeconomics, Elsevier, Amsterdam. [ Links ]
King, R. & Watson, G., 1995, 'Money, prices, interest rates and the business cycle', Review of Economics and Statistics 58(1), 35-53. [ Links ]
Krugman, P., 1998, 'It's baaack: Japan's slump and the return of the medium run', Brookings Papers on Economic Activity 2, 137-187. https://doi.org/10.2307/2534694 [ Links ]
Lippi, M. & Reichlin, L., 1993, 'The dynamic effects of aggregate demand and supply disturbances: Comment', The American Economic Review 83(3), 644-652. [ Links ]
Lucas, R., 1977, 'Understanding business cycles', Carnegie-Rochester Conference Series on Public Policy 5(1), 7-29. https://doi.org/10.1016/0167-2231(77)90002-1 [ Links ]
Mintz, I., 1969, Dating post-war business cycles, National Bureau of Economic Research, New York. [ Links ]
OECD, 2016, OECD.stat, Database, Organisation for Economic Co-operation and Development, Paris. [ Links ]
Plosser, C.I., 1989, 'Understanding real business cycles', The Journal of Economic Perspectives 3(3), 51-77. https://doi.org/10.1257/jep.3.3.51 [ Links ]
SARB, 2016, Online download facility, Database, South African Reserve Bank, Cape Town. [ Links ]
Sargent, T.J., 1999, 'The big problem of small change', Journal of Money, Credit and Banking 31(2), 137-161. https://doi.org/10.2307/2601227 [ Links ]
Solow, R.M., 2000, 'Towards a macroeconomics of the medium run', Journal of Economic Perspectives 14(1), 151-158. https://doi.org/10.1257/jep.14.1.151 [ Links ]
West, K., 1992, 'Sources of cycles in Japan, 1975-1987', Journal of Japanese and International Economies 6(1), 71-98. https://doi.org/10.1016/0889-1583(92)90019-Z [ Links ]
Zarnowitz, V. & Ozyildirim, A., 2006, 'Time series decomposition and measurement of business cycles, Trends and Growth Cycles', Journal of Monetary Economics 53(7), 1717-1739. https://doi.org/10.1016/j.jmoneco.2005.03.015 [ Links ]
 Correspondence:
Willem Boshoff
wimpie2@sun.ac.za
Received: 02 Nov. 2016
Accepted: 25 May 2018
Published: 30 Aug. 2018
1 . Deviation cycles are also sometimes referred to as growth cycles; see Canova (1998) for a critical summary.
2 . See for instance Agénor, McDermott and Prasad (2000) or Rand and Tarp (2002).
3 . See Du Plessis et al. (2008) for an extended discussion.

