


Services on Demand
Article
 English (pdf)
 Article in xml format
 Article references
Indicators

Related links
-
 Cited by Google
 -
 Similars in Google
Share

 Permalink
South African Journal of Economic and Management Sciences
On-line version ISSN 2222-3436
Print version ISSN 1015-8812
S. Afr. j. econ. manag. sci. vol.21 n.1 Pretoria 2018
http://dx.doi.org/10.4102/sajems.v21i1.1927
ORIGINAL RESEARCH
Evaluating South Africa's utilisation of sustained export potential in sub-Saharan Africa
Gabriel Mhonyera; Ermie Steenkamp; Marianne Matthee
School of Economics, North-West University, South Africa
ABSTRACT
BACKGROUND: Regional trade could be a powerful engine of economic growth and sustainable job creation. However, South Africa's exports to sub-Saharan Africa (SSA) are typically smaller and more short-lived than its exports to its traditional markets. This is despite South African policymakers considering trade with SSA to be a priority.
AIM: The aim of the article is to evaluate South Africa's utilisation of sustained export potential in SSA with a view to providing practical insights that will inform future policymaking and planning
SETTING: Despite the priority attention given to SSA in the country's trade policy, South Africa is yet to make meaningful inroads into SSA's largest and fastest-growing economies.
METHOD: The research method applied comprised three steps. The first step involved the identification, over a five-year period from 2010 to 2014, of consistently large and/or growing import demand in SSA for all products at the Harmonised System (HS) six-digit level, as well as the identification of products South Africa consistently exported competitively (sustainable exports). The second step entailed matching SSA markets with consistently large and/or growing import demand to South Africa's sustainable exports. The third step involved evaluating South Africa's utilisation of sustained export potential in SSA.
RESULTS: The results reveal that South Africa is utilising just over half (54%) of its sustained export potential in SSA.
CONCLUSION: South Africa is, therefore, underutilising or not utilising close to 50% of its sustained export potential in .SSA. Most of the export potential that South Africa is utilising is in Eastern Africa while most of the export potential that the country is underutilising and not utilising at all is in Central and Western Africa
Introduction
As is the case with several other developing countries, South Africa is facing considerable economic challenges, including stunted economic growth, stubbornly high unemployment, widespread poverty, and a waning interest in the country's prospects from trade and investment partners (Viviers et al. 2014). The latest economic blueprint for South Africa, the National Development Plan (NDP), singles out the export sector as having the potential to become an engine of rapid and more job-intensive and inclusive economic growth (National Planning Commission [NPC] 2013; World Bank [WB] 2014). The NDP states that an export growth rate of 6% per annum (in volume terms) is needed to generate a 5.4% increase in real Gross Domestic Product (GDP), which would be the catalyst for the creation of 11 million new jobs by 2030 (NPC 2013:64).
In 2015 and 2016, South Africa registered economic growth rates of 1.3% and 0.3%, respectively (Statistics South Africa 2015), which point to a very worrying declining trend. Although South Africa's economic growth rate has been projected to improve to 1.9% by 2020 (National Treasury [NT] 2017:2), escalating political uncertainties in the country could produce a very different outcome. In the midst of this uncertainty, the need to boost export activity as a stimulant to economic activity and job creation remains a priority.
Even with a substantive and protracted depreciation of the domestic currency in recent years, South Africa's export performance has remained weak (International Monetary Fund [IMF] 2015). For example, in the period January 2011 - July 2014, South Africa's exports contracted by an average of 5.7%, while the country's share of global exports fell by almost 15% (IMF 2015:49). Porter, Ketels and Delgado (2007) acknowledge that exports based on a cheap currency or low wages are not able to sustain an attractive standard of living. Although weak external demand along with low commodity prices have characterised the global economy in recent years, this does not completely explain South Africa's poor export performance.
Improving regional trade has been a policy objective of the South African government since the start of the post-apartheid era. In this regard, the South African government remains committed to the idea of forging mutually-beneficial trade relationships across the African continent (DTI 2010). Given its sizeable import market, which expanded from US$77.5 billion in 2001 to US$300 billion in 2016, sub-Saharan Africa (SSA) has much to offer to South African exporters (International Trade Centre [ITC] 2017; Steenkamp, Sonja & Viviers 2015). Yet despite the priority attention given to SSA in South Africa's trade policy, the country is yet to make meaningful inroads into SSA's largest and fastest-growing economies (Industrial Development Co-operation [IDC] 2014).
For South African exports to SSA to gain traction and provide the foundation for enhanced economic growth, export opportunities have to be sustainable. For many developing countries, including South Africa, new trade relationships often fail as a consequence of overlooking the significance of export sustainability (Besedeš & Prusa 2011; Reis & Farole 2012). It is thus essential for the South African government and exporting firms to target export markets that present clear and enduring export potential (Shankarmahesh, Olsen & Honeycutt 2005). Moreover, South Africa should specialise in exporting products that it can produce and export consistently in a competitive manner (i.e. sustainable exports).
In 2014, the WB published a report on South Africa's export competitiveness, pointing out that South Africa's exports to SSA have been more short-lived and of lower value than its exports to traditional markets (WB 2014); with the latter, in turn, having been declining for a number of years. The apparent mismatch between the opportunities presented to South African exporters by SSA and the actual export business generated prompts the central question in this article: is South Africa utilising its sustained export potential in SSA?
Limited attention has been given in the literature as to how South Africa has addressed potential export opportunities. To date, no study has been undertaken to evaluate South Africa's approach to tapping its sustained export potential in SSA. However, related studies exposed barriers to South Africa's export efforts in the SSA region (Steenkamp et al. 2015) and identified specific export opportunities for South Africa in the African continent (Steenkamp & Viviers 2012). These studies, though, are cross sections at one point in time and focused mainly on demand-side factors. This article goes further by identifying product-country combinations that reveal consistently large and/or growing import demand for the products that South Africa can export consistently in a competitive way (i.e. sustainable exports)1, analysed over a five-year period. The article also evaluates South Africa's actual exports, over the five-year period, of these product-country combinations, and, therefore, determines the country's utilisation of the sustained export potential in SSA.
The rest of this article is structured as follows: Section 2 contains a brief review of relevant international trade literature; the 'research method and design' section provides a comprehensive description of the research method and data used to determine South Africa's sustained export opportunities in SSA and to evaluate South Africa's utilisation of those sustained export opportunities; the 'results' section presents and analyses the results; and the 'discussion' section brings the article to a close with conclusions and recommendations.
Literature review
A brief review of international trade literature establishes the theoretical basis of this article and consists of three parts: the first part focuses on export growth, the second on export sustainability and the third on export structure and factor endowments.
Export growth
Export growth has a stimulating influence across the whole economy in the form of technological spill-overs to other productive sectors and additional positive externalities (Devi 2014). Growth in exports is a facilitator of economies of scale and increased utilisation of capacity, inducing technological modification, easing the foreign exchange constraint and improving the productivity of capital and labour (Awokuse 2003). However, export growth that is capable of stimulating sustainable economic growth takes place via the intensive and extensive margins of trade (Matthee, Idsardi & Krugell 2016; Van Niekerk & Viviers 2014).
Exports can grow in two ways. Countries can export more of the goods they had previously been exporting, which is export growth in the intensive margin, or countries can begin exporting goods they had previously been exporting and/or goods they had not previously been exporting, to new destinations, which is export growth in the extensive margin (Kehoe & Ruhl 2003; Reis & Farole 2012). Interestingly, for many countries (middle and high-income economies in particular) a higher proportion of export growth transpires in the intensive margin, that is, by exporting more of the same products to the same markets (Brenton & Newfarmer 2009). This is also true for South Africa, as Van Niekerk and Viviers (2014) and Matthee et al. (2016) confirm. Similarly, Amiti and Freund (2010:35) analyse China's outstanding export growth along different dimensions and find that China's real export growth, of over 500% since 1992, is primarily explained by high export growth in the intensive margin rather than the extensive margin.
For developing countries, growth in the extensive margin, encompassing both new product innovations and existing products destined for new markets, is critical for driving exports and employment. Lower susceptibility to external shocks, which flows from export diversification, is critical for long-term export and economic growth (Reis & Farole 2012). In fact, growth in the extensive margin or export diversification diminishes the risks of a Balance of Payments (BOP) crisis and large instabilities in domestic output, such as price variations in global markets or output swings in trading partners, which can adversely affect external sector performance (Agosin 2007).
Export growth through the intensive or extensive margins has to be sustainable if viable economic growth rates are to be achieved. In some instances, countries focus on increasing export growth without taking into consideration the survival of exports. In fact, export survival is a precondition for sustainability of export growth.
Export sustainability
Sustainability of exports is a precondition for sustainable export growth (Aylward 2004). New trade relationships are important for both developed and developing countries. Yet for many developing countries, new trade relationships rarely last more than two years (Besedeš & Prusa 2011; Reis & Farole 2012).
Cadot et al. (2011) assert that African exporters experiment a great deal in export markets that are customarily challenging. Such experimentation by African exporters is usually on a small scale, with low survival rates and failure typically evident in the first year. Cadot et al. (2011) also reveal that exporting firms that are diversified in terms of products, but even more diversified in terms of markets, are expected to survive beyond the first year, unlike those firms that have not achieved such diversification. Furthermore, after a firm has survived the first year in a particular market, its exports grow significantly over time (Cadot et al. 2011).
Nevertheless, current research on export survival proposes that exporting has an element of 'learning by doing' to it, and that the chances of export survival are greatly enhanced if a business exports identical products to other markets or exports additional products to the same markets (Viviers et al. 2014). This is favourable in the context of international marketing as it reduces the impact of costly non-trade barriers, such as costs of accessing channels of distribution and product adaptation costs (Anderson & Coughlan 1987; Calantone et al. 2004). In fact, exporters of identical products to similar export destinations exert a positive externality on new entrants. More specifically, the greater the export of identical products to similar export destinations, the higher the probability of new entrants surviving in the diversified export destinations, even though the impact is relatively small (Cadot et al. 2011).
Besedeš and Prusa (2011) clarify why so few products account for the majority of exports of developing countries and why new entrants fail in most cases. According to Besedeš and Prusa (2011), the literature often fails to make a distinction between export survival and trade deepening. They accuse existing studies of concentrating only on variations in export value and the number of export relationships over time, and prematurely viewing the latter as trade deepening without taking the important issue of export survival into consideration.
To enhance the sustainability of export relationships, South African exporters should consider markets with consistently large and/or growing import demand. However, even in the presence of such import demand, if a country cannot consistently export competitively (i.e. maintain sustainable exports), its exports will not grow in a sustainable manner in the long run. In other words, what a country export has long-term implications for the sustainability and growth of its exports. To this end, the Heckscher-Ohlin trade theory emphasises the significance of a country's factor endowments on its exports (Gallagher, Moreno-Brid & Porzecanski 2008).
Export structure and factor endowments
Current export and production structure matters for future export and economic growth since they favour innovation and permit economies to respond more flexibly to external shocks (Hausmann, Hwang & Rodrik 2007). Extensive theoretical literature centred on endogenous growth theory has proposed models to confirm that export and production structure is an essential determinant of economic performance (Jarreau & Poncet 2012). In addition to specialising in those sectors in which there is a comparative advantage, there are supplementary gains to be made by specialising in products that have superior positive externalities (Jarreau & Poncet 2012). Strategies supporting this innovative process, such as promoting technology imports and technological learning, may initiate higher economic growth rates (Jarreau & Poncet 2012). This hypothesis received empirical support from Hausmann et al. (2007), who employ cross-country panel regressions to validate that countries attaining the competence to export more sophisticated products grow more rapidly, controlling for preliminary income levels and factor endowments. Therefore, what a country exports matters (Hausmann et al. 2007).
Using regional variations within a single country (China), Jarreau and Poncet (2012) tested the Hausmann et al. (2007) expectation that regions which develop more sophisticated products subsequently grow more rapidly. They found that even at the provincial and district level (and controlling for the level of development), significant disparity in export sophistication exists which, in turn, matters for economic growth. However, Jarreau and Poncet (2012) further found that growth gains from enhanced technology take place only when the technology is developed by locally-owned firms and is entrenched in ordinary trade.
Another channel through which export-encouraged specialisation stimulates economic growth originates in the Ricardian view that certain economic activities might stimulate economic growth more than others, owing to either demand-side elements (e.g. price elasticities) or supply-side elements (e.g. technological necessities) (Lee 2011). Accordingly, what a country specialises in has repercussions for its economic growth performance.
Lee (2011) empirically investigated the extent to which technological qualities in exports affect the patterns of export-led economic growth across countries. He found that nations that have progressively specialised in exporting products with high technological content, such as electronics, pharmaceuticals and aircraft, have characteristically experienced more rapid economic growth. In contrast, countries that have trailed behind tend to progressively specialise in exporting 'traditional' or low-technology products, such as food and textile products.
The structure of exports2 affects a country's export and economic growth prospects. A technology-intensive export structure is desirable for a country with a considerable industrial base (Lall 1999). Trade liberalisation, when completely implemented, helps a country to realise existing competitive advantages, but it is highly unlikely to independently stimulate export growth (Lall 1999). Therefore, it is essential for countries to advance internal skills and technology and to lure Foreign Direct Investments (FDIs) to augment their export structures (Lall 1999).
Additionally, to support the expanding role of exports and their transformation, countries' domestic industrial policies call for emphasis to be placed on the promotion of investment in human capital, competent domestic institutions, and harmonious financial and trade supporting economic policies to increase the level of GDP per capita (Hausmann & Klinger 2006; Rodrik 2007).
Research method and design
Study design
The research method used to evaluate South Africa's utilisation of sustained export potential in SSA is shown in Figure 1. The research method consists of three steps. The first step focuses on the identification of consistently large and/or growing import demand in SSA and the identification of products that South Africa consistently exports competitively (i.e. sustainable exports). This is done for all products, at the Harmonised System (HS) six-digit level, over a five-year period from 2010 to 2014. The second step focuses on matching SSA markets (product-country combinations) with consistently large and/or growing import demand to products that South Africa consistently exports competitively (i.e. South Africa's sustainable exports). The third step focuses on an evaluation of South Africa's utilisation of sustained export potential in SSA. South Africa's actual exports (i.e. actual exports of existing products to existing and new markets) of the matched product-country combinations identified in SSA, over the five-year period from 2010 to 2014, are evaluated to determine whether they are being utilised (growing exports3), underutilised (declining exports4) or not utilised (no trade5 and/or extinct6 exports).
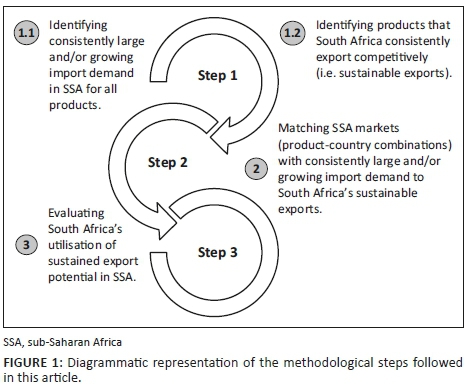
A discussion of each of the methodological steps is provided in 'data analysis' section.
Data analysis
Step 1.1
In this step, consistently large and/or growing import demand in SSA is identified for all products at the HS six-digit level. The methodology applied in Cuyvers et al. (1995:179) and Cuyvers (1997:6; 2004:259-260) to identify markets with large and/or growing import demand for the different products is followed. Three variables - short-term import growth, long-term import growth and import market size - are calculated for each possible product-country combination in SSA annually for five years from 2010 to 2014. Short-term import growth is calculated as a simple annual growth rate in imports7, while long-term import growth is calculated as the five-year compounded annual growth rate in imports8. The relative import market size is calculated as the ratio of imports of country i for product j and the total world imports of product j (Cuyvers 2004:259-260; Cuyvers et al. 1995:178). Import data at the HS six-digit level from 2005 to 2014 was accessed9 from the United Nations Commodity Trade Statistics Database (UN COMTRADE)10.
To identify those product-country combinations in SSA attracting consistently large and/or growing import demand from 2010 to 2014, cut-off values are calculated for each of the three variables in each of the five years. Following Cuyvers (2004:260), cut-off values for the variables in this step are defined as follows:
A scaling factor (Sj) is defined first when determining the threshold of the short- and long-term import growth (Willemé & Van Steerteghem [1993], as quoted in Cuyvers [1997:5, 2004:260]). The scaling factor enables country i's degree of specialisation in the exports of product j to be taken into consideration when defining cut-off values (Cuyvers, 2004:260). It is argued that if the exporting country is already specialised in export product j as measured by the Revealed Comparative Advantage (RCA) index, the cut-off values for the demand in the importing country can be less stringent (Cuyvers et al. 1995:179).
The scaling factor (Sj) can be mathematically formulated as (Willemé & Van Steerteghem [1993], as quoted in Cuyvers [1997:5, 2004:260]):

Where:
RCAj: is the exporting country's RCA index for product j (Balassa 1965; Reis & Farole 2012). RCAj is mathematically formulated as:
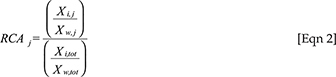
Where:
-
Xi,j: is the exports of country i (which is the country for which utilisation of sustained export potential is being evaluated) of product j
-
Xw,j: is the world exports of product j
-
Xi,tot: is the total exports of country i
-
Xw,tot: is the total exports of the world.
The cut-off values are then defined as follows (Willemé & Van Steerteghem [1993], as quoted in Cuyvers [1997:5, 2004:260]):

Where:
-
gi,j: is the short- or long-term import growth rate of product j in importing country i
-
Gj: is equal to, gw, j sj, if gw, j ≥ 0; or
-
Gj: is equal to,
 if gw, j <0
 -
With gw,j being the rate of growth of total world imports of product j.
This procedure is carried out five times for both short-term and long-term import growth rates for each year from 2010 to 2014 (Cuyvers 1997:6, 2004:260). Each product-country combination is assigned '1' if the criterion mentioned in Equation 3 is met or '0' if otherwise.
If the exporting country is not specialised in exporting product j (0 ≤ RCAj < 1), the short- or long-term import growth rate of product j in importing country i (gi,j) must be between one and two times the world's average import growth rate of product j. If the exporting country is specialised in exporting product j (RCAj ≥ 1), the short- or long-term import growth rate of product j in importing country i (gi,j) is permitted to be a bit lower than11 or equal to the world's average import growth rate of product j(Cuyvers, Steenkamp & Viviers 2012a:62-63).
In addition, the relative import market size of country i for product j is considered adequately large if (Cuyvers 1997:6, 2004:260):

Where:
-
Mi,j : is the relative import market size of product j in country i
-
Cj : is the cut-off value for relative import market size taking into account the exporting country's degree of specialisation in product j such that:
▪ Cj = 0.02Mw,j, if RCAj ≥ 1; or
▪ Cj = [(3- RCAj) / 100]Mw,j, if RCAj < 1
▪ With Mw,j being the total world imports of product j.
If the exporting country is not specialised in exporting product j (0 ≤ RCAj < 1), imports of product j in importing country i (Mi,j) must be between 2% and 3% of total world imports of product j. However, if the exporting country is specialised in exporting product j (RCAj ≥ 1), imports of product j in importing country i (Mi,j) must be greater than or equal to 2% of total world imports of product j (Cuyvers et al. 2012a:62-63).
Again, this procedure is carried out five times for relative import market size from 2010 to 2014. Each product-country combination is assigned '1' if the criterion mentioned in Equation 4 is fulfilled or '0' if otherwise.
The selection of markets in this step is made following the categorisation of product-country combinations, as illustrated in Table 1 (Cuyvers 2004:261).
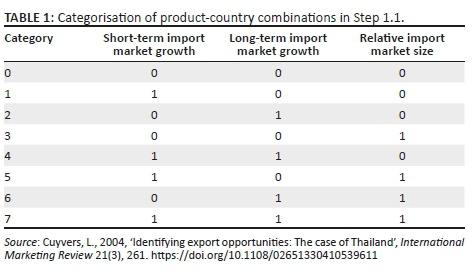
The product-country combinations are categorised annually for five years from 2010 to 2014. Product-country combinations falling in any of the categories 3 to 7 (see Table 1) in each of the five years from 2010 to 2014 are selected as markets offering consistently large and/or growing import demand in SSA. Product-country combinations falling in categories 0, 1 and 2 (see Table 1) in any of the five years are eliminated.
Therefore, for a product-country combination to be selected, it should consistently (that is, for five years from 2010-2014) have an import demand with at least one or a combination of the following characteristics (see Table 1): relatively large import market size (category 3); relatively high short- and long-term growth (category 4); relatively high short-term growth and a relatively large import market size (category 5); relatively high long-term growth and a relatively large import market size (category 6); relatively high short- and long-term growth and a relatively large import market size (category 7).
This article follows Cuyvers et al. (1995:179) and Cuyvers (1997:6, 2004:260) in determining markets with large and/or growing import demand. However, the article is unique in that, for the first time, it repeats this analysis annually for five years to identify those markets (in SSA) with consistently large and/or growing import demand.
Step 1.2
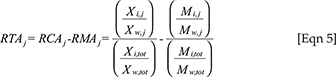
This step determines those products that South Africa consistently exports competitively (i.e. sustainable exports). Although the RCA index is frequently used as an indicator of a country's relative export competitiveness of a particular product, it only takes exports into account, overlooking the possibility that a country might be a net importer of the product (Jessen & Vignoles 2004). For that reason, the Revealed Trade Advantage (RTA) index which accounts for both exports and imports, is used in this step as a proxy for international product level export competitiveness (Steenkamp et al. 2015; Vollrath 1991). The RTA is calculated by subtracting a country's Revealed Import Advantage (RMA) for a particular product from its RCA. In this article, it is assumed that if a product is exported consistently with a comparative advantage (RTA > 0 and RCA > 0.7) over a five-year period, it can be classified as a sustainable export. South Africa's export data at the HS six-digit level from 2010 to 2014 was accessed from UN COMTRADE.
Therefore:
Where:
-
Mi,j: is the imports of country i of product j
-
Mw,j: is the world imports of product j
-
Mi,tot: is the total imports of country i
-
Mw,tot: is the total imports of the world.
An RTA index greater than zero discloses a positive comparative trade advantage or positive trade competitiveness (Steenkamp et al. 2015; Vollrath 1991). Therefore, it can be assumed that an RTA index greater than zero means that the majority of the products exported are produced domestically, as it corrects for re-exports (Steenkamp et al. 2015; Vollrath 1991).
In addition to the RCA and RTA used in this article to identify products that South Africa consistently exported competitively over a five-year period from 2010-2014 (which is assumed to indicate product level export production sustainability), factor endowments are normally used to measure product level export production sustainability (Reis & Farole 2012). The Revealed Factor Intensity Indices (RFII), namely, Revealed Human Capital Index (RHCI) and Revealed Physical Capital Index (RPCI) of products exported, reflect the human and physical capital content of exports (Reis & Farole 2012). According to Reis and Farole (2012), RFII arguably have a robust theoretical connection to comparative advantages derived from factor endowments. That is, products that are primarily exported by countries richly endowed with human capital are revealed to be human capital intensive, while those exported by countries richly endowed with physical capital are revealed to be physical capital intensive (see the 'Export structure and factor endowments' section). Economic theory envisages that countries will specialise in producing products that are intensive in their relatively abundant factor (WB 2013). Data for RFII compiled by Shirotori, Tumurchudur and Cadot (2010) were accessed from the United Nations Conference on Trade and Development (UNCTAD)12.
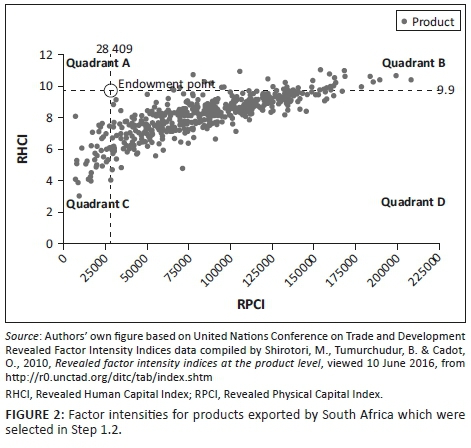
However, in this article, RFII are not used as selection criteria, but rather as classification criteria to indicate which of the products South Africa consistently exports competitively (i.e. sustainable exports), fall within or outside South Africa's factor endowment point. This emanates from the following shortcomings of RFII: firstly, not all products exported by South Africa are covered in UNCTAD's 2007 data for RFII compiled by Shirotori et al. (2010); secondly, there are no recent data for RFII; thirdly, some products such as fresh grapes, which are generally considered to be sustainably produced by South Africa, tend to have high physical and human capital requirements because they are also produced by developed countries (which are richly endowed with physical and human capital); and lastly, the latest available figure for South Africa's physical capital per worker is for 2007.
South Africa's average years of schooling (9.9 years) (UN 2013) and physical capital per worker of US$28 409 (Shirotori et al. 2010) were used to define South Africa's factor endowment point. These are compared to the RHCI and RPCI required per product at the HS six-digit level to reveal whether the product falls within or outside South Africa's factor endowment point. If a product's RHCI ≤ 9.9 years and its RPCI ≤ US$28 409, then the product is within South Africa's factor endowment point; if otherwise, then the product is outside South Africa's factor endowment point (see Figures 2 and 5).
Step 2
In this step, SSA's consistently large and/or growing import demand is matched to South Africa's sustainable exports. In other words, SSA product-country combinations with consistently large and/or growing import demand (see Step 1.1) over a five-year period from 2010 to 2014 are matched to products that consistently satisfied the selection criteria (RTA > 0 and RCA > 0.7, see Step 1.2) over the same period, and qualified for final selection as products that South Africa consistently exports competitively (i.e. sustainable exports). Only product-country combinations qualified in Step 1.1, and matching products qualified in Step 1.2, are selected in this step. Those product-country combinations with consistently large and/or growing import demand in SSA, but which South Africa cannot consistently export competitively, are eliminated. This also applies to those product-country combinations that do not possess consistently large and/or growing import demand in SSA, even though South Africa consistently exports the products competitively. The matched product-country combinations selected in this step qualify to enter Step 3, the evaluation step.
Step 3
South Africa's utilisation of sustained export potential in SSA is evaluated in this step. The evaluation procedure is performed on those product-country combinations with consistently large and/or growing import demand in SSA (see Step 1.1) and matched (see Step 2) to the products that South Africa consistently exports competitively (i.e. sustainable exports) (see Step 1.2). South Africa's actual exports at the HS six-digit level over the five-year period (that is, 2010 to 2014) to these sustained export opportunities are evaluated to determine whether: they are growing, they are declining, there is no trade, or they have become extinct.
These classifications are used to make recommendations to South African policymakers, export promotion organisations and industry associations. In this regard, recommendations are made as to which products and markets to investigate why South Africa's actual exports are declining, there is no trade between South Africa and the importing country, or South Africa's actual exports became extinct. This is despite the presence of consistently large and/or growing import demand in such markets. Similarly, policymakers, export promotion organisations and industry associations are also informed of those products and markets where South Africa is utilising its sustained export potential in SSA, so that such utilisation is maintained.
As discussed in the data analysis, the distance from South Africa's factor endowment point for products selected in Step 2 and qualified to enter Step 3 is calculated using the RFII to reflect whether the products fall within or outside South Africa's factor endowment point. These classifications are used to make recommendations to policymakers on which products need an improved endowment of human and/or physical capital, since insufficient human and/or physical capital endowments threaten export sustainability.
Results
A broad overview of results obtained in Steps 1.1 to 2 is provided in Table 2. Consistently large and/or growing import demand in SSA was identified in Step 1.1 for all products at the HS six-digit level. No direct or mirror import data exist for the SSA countries of Reunion and Sudan over this period. As a result of this data constraint, consistently large and/or growing import demand was identified in the remaining 46 out of 48 SSA countries, excluding South Africa. As shown in Table 2, a total of 5 222 products imported by SSA countries, excluding South Africa, yielded 163 452 unique product-country combinations which were analysed as a starting point in this step to identify consistently large and/or growing import demand in SSA. Using the methodology as explained in the 'data analysis' section, a total of 223 product-country combinations with consistently large and/or growing import demand from 2010 to 2014 were selected in Step 1.1, while 163 229 product-country combinations were eliminated.

In Step 1.2 (see Table 2), the RTA index, which includes the RCA and RMA indices, was used to identify products that South Africa consistently exports competitively (i.e. sustainable exports). As mentioned in the 'Data analysis' section, the RFII (that is, RHCI and RPCI) are normally used to measure product level export production sustainability. However, due to the shortcomings of RFII discussed in the 'Data analysis' section, the RFII were not used as selection criteria in this article but rather as classification criteria to indicate which of the products South Africa consistently exports competitively (i.e. sustainable exports) fall within or outside South Africa's factor endowment point. A total of 5 224 products exported by South Africa were analysed in step 1.2 to identify which ones South Africa consistently exported competitively (i.e. sustainable exports) over a five-year period from 2010 to 2014. A total of 604 products exported by South Africa fulfilled the selection criteria discussed in the 'Data analysis' section (i.e. RCA > 0.7 and RTA > 0 in all of the five years from 2010 to 2014), while 4620 products exported by South Africa were eliminated.
The RFII were used to reflect which of the 604 South Africa's sustainable export products selected in Step 1.2 fall within or outside South Africa's factor endowment point. A total of 500 of the 604 products identified in Step 1.2 fall within South Africa's human capital endowment (see quadrants C and D, Figure 2) while a total of 42 products fall within South Africa's physical and human capital endowments (see quadrant C, Figure 2). Therefore, of the 604 products selected in Step 1.2, a total of 42 products fall within South Africa's factor endowment point (products in quadrant C, Figure 2), while 484 fall outside South Africa's factor endowment point (products in quadrants A, B, and D, Figure 2). This should be interpreted in the light of the shortcomings of RFII discussed in the 'Data analysis' section. However, 78 products also selected in Step 1.2 are not covered in UNCTAD's data for RFII. Although the RFII have limitations (see 'Data analysis' section), this is an indication that South Africa's overall export production sustainability may be under threat due to the country's low level of physical capital per worker (US$28 409). For export production of a particular product to be sustainable, the product must fall within the country's endowments of human and physical capital (see quadrant C, Figure 2).
In Step 2 (see Table 2), a total of 223 product-country combinations with consistently large and/or growing import demand in SSA from 2010 to 2014 (selected in Step 1.1) were matched to the 604 products consistently exported competitively by South Africa (with RTA > 0 and RCA > 0.7), which were selected in Step 1.2. A total of 94 matched product-country combinations were identified in SSA. This implies that 129 of the 223 product-country combinations selected in Step 1.1 and 510 of the 604 products selected in Step 1.2 were eliminated in Step 2.
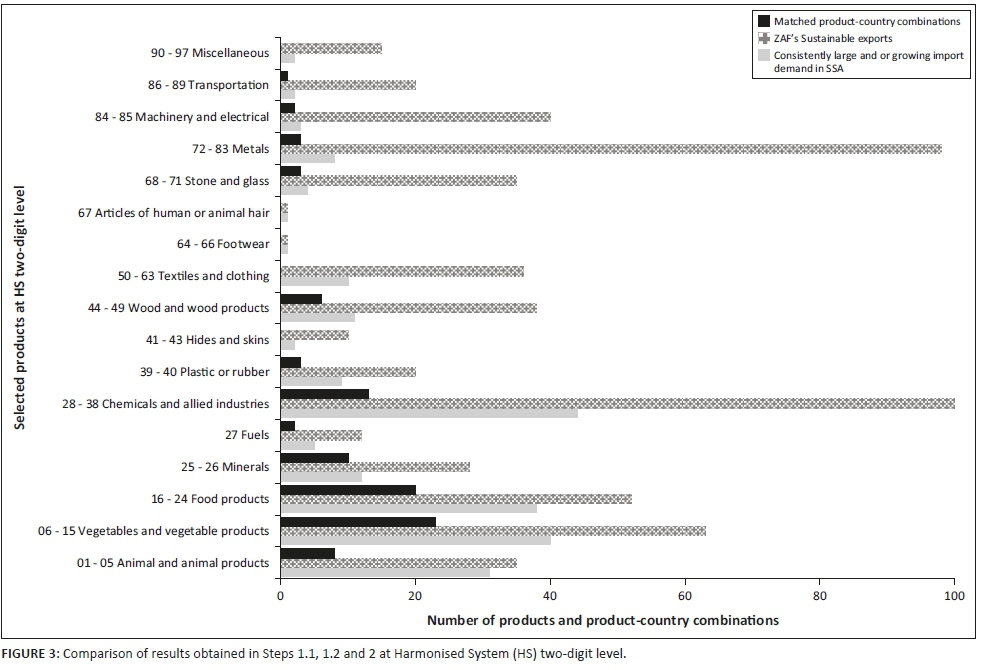
A comparison of results obtained in Steps 1.1, 1.2 and 2 at the HS two-digit level is shown in Figure 3. With the exception of chemicals and allied industries, as well as minerals, the products in the product groups with the highest number of matched product-country combinations are mainly consumer agricultural products and agro-based manufactures.
Consistently large and/or growing import demand in SSA is low for products in the transportation and machinery and electrical product groups (see Figure 3). These two product groups have a total of 60 products that South Africa consistently export competitively (i.e. sustainable exports), but only five product-country combinations were identified as having consistently large and/or growing import demand in SSA and three of the five were matched in Step 2. Consistently large and/or growing import demand in SSA is also low for products in the metals product group. This group has a total of 98 products that South Africa consistently export competitively (i.e. sustainable exports), but only eight product-country combinations were identified as having consistently large and/or growing import demand in SSA and three of the eight were matched in Step 2. Furthermore, the textile and clothing sector with 36 sustainable export products found no match in SSA's consistently large and/or growing import demand (see Figure 3).
A total of 94 matched product-country combinations in SSA, identified in Step 2, qualified to enter the final step (that is, Step 3) in which South Africa's utilisation of sustained export potential in SSA was evaluated. The results of Step 3 are discussed in the next section.
Discussion: The utilisation of sustained export potential in SSA
In Step 3, South Africa's actual exports at the HS six-digit level of the 94 matched product-country combinations identified in Step 2 were evaluated to determine whether: they are growing; they are declining; there is no trade; or they have become extinct. Markets in which South Africa's actual exports grew, provide evidence of utilisation of sustained export potential in SSA. On the other hand, markets in which South Africa's actual exports declined, provide evidence of underutilisation of sustained export potential in SSA, while those markets where there is no trade between South Africa and the SSA importing countries, or South Africa's actual exports to SSA importing countries have become extinct, point to non-utilisation of sustained export potential in SSA.
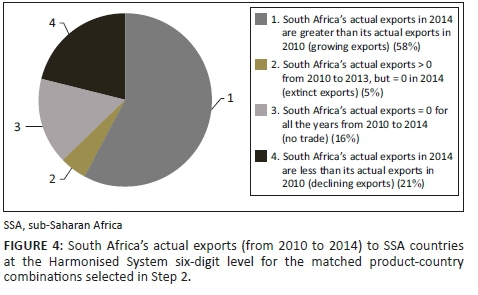
It is clear from Figure 4 that South Africa's actual exports at the HS six-digit level in the five-year period from 2010 to 2014 grew in 58% of the 94 matched product-country combinations selected in Step 2. However, South Africa's actual exports at the HS six-digit level in the five-year period from 2010 to 2014 declined in 21% of the 94 matched product-country combinations selected in Step 2. Furthermore, between 2010 and 2014, there was no trade between South Africa and the SSA importing countries in 16% of the 94 matched product-country combinations selected in Step 2, while South Africa's actual exports at the HS six-digit level became extinct in 5% of the 94 matched product-country combinations, over the same period.
The regional status of South Africa's actual exports from 2010 to 2014 for the 94 matched product-country combinations identified in SSA is shown in Table 3. Most of the matched product-country combinations for which South Africa's actual exports grew from 2010 to 2014 are in Eastern Africa (54%). On the other hand, the majority of the matched product-country combinations for which South Africa's actual exports declined are in Central Africa (45%). Western Africa has a higher percentage (73%) of the matched product-country combinations where there is no trade between South Africa and the SSA importing countries (see Table 3). Eastern and Western Africa each possess 40% of those matched product-country combinations where South Africa's actual exports became extinct.
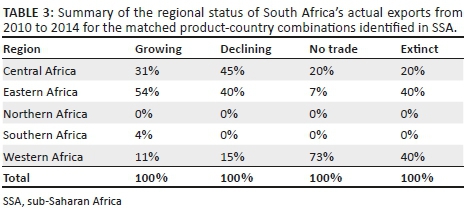
The results in Table 3 reveal that South Africa is increasing trade with its non-Southern African Customs Union (SACU) Southern African Development Community (SADC) counterparts. A total of 27 of the 29 matched product-country combinations for which South Africa's actual exports grew in SSA countries in Eastern Africa, over the five years from 2010 to 2014, are in non-SACU SADC members in this region.
Again, the RFII were used to reflect which of the 94 matched product-country combinations being evaluated fall within or outside South Africa's factor endowment point (see Figure 5).
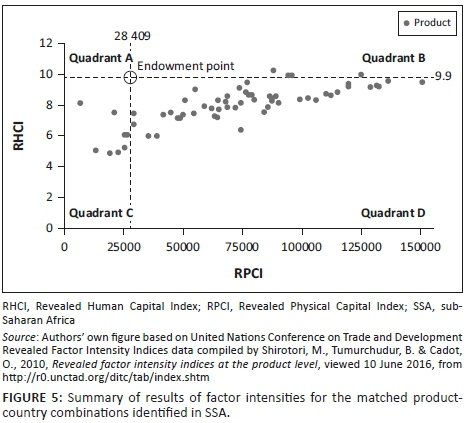
Of the 69 products14 under consideration, only eight fall within South Africa's factor endowment point, while 54 products fall outside South Africa's factor endowment point and seven products are not covered in UNCTAD's data for RFII compiled by Shirotori et al. (2010). With the exception of sweetened milk and cream powder, as well as article Kraftliner in quadrant B (see Figure 5), products falling outside South Africa's factor endowment point are in quadrant D. This shows that South Africa has the human capital but not the physical capital required to produce those products. As mentioned earlier, this is an indication that South Africa's overall export production sustainability may be under threat due to low levels of physical capital per worker.
The top 10 matched product-country combinations with utilised sustained export potential in SSA are shown in Table 4. There are 20 countries that possess sustained export potential that South Africa is utilising. These countries include Zambia, Angola, Zimbabwe, Mozambique, and Republic of the Congo, which all separately possess more than five matched product-country combinations.
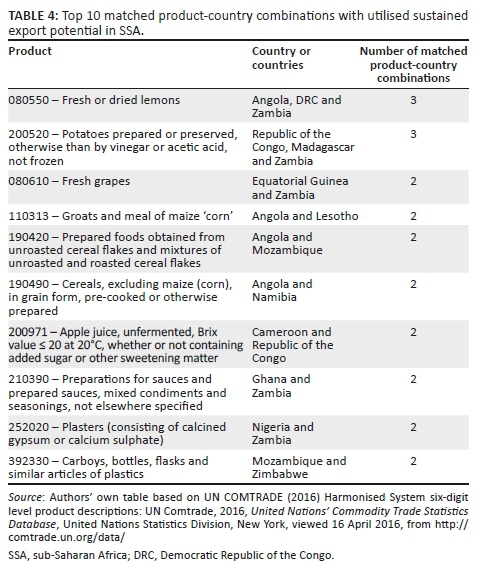
There are a total of 54 matched product-country combinations with utilised sustained export potential in SSA. Examples of these matched product-country combinations include (see Table 4): fresh or dried lemons to Angola, the Democratic Republic of the Congo and Zambia; potatoes prepared or preserved to Republic of the Congo, Madagascar and Zambia; groats and meal of maize 'corn' to Angola and Lesotho; unfermented apple juice to Cameroon and Republic of the Congo; and cereals (excluding maize) to Angola and Namibia.
Table 5 shows the matched product-country combinations with underutilised export potential in SSA. There are 11 countries that possess sustained export potential that South Africa is underutilising. These countries include Angola, Gabon, Ghana, Mozambique, Mauritania, Mauritius, Nigeria, Tanzania, Democratic Republic of the Congo, Zambia, and Zimbabwe.
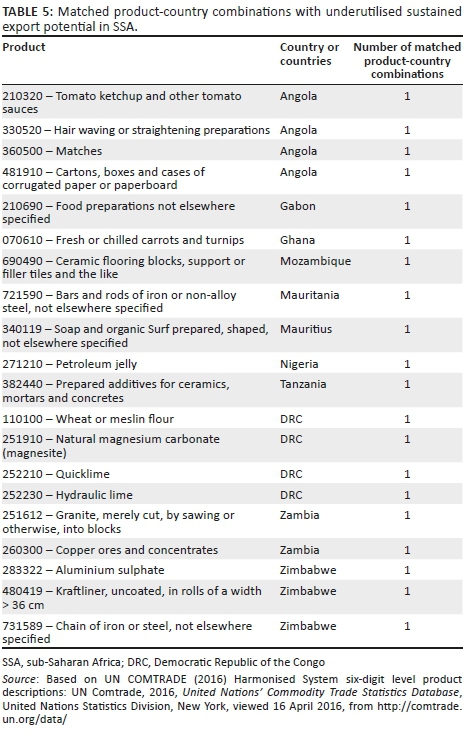
Sustained export potential is being underutilised in 20 matched product-country combinations identified in SSA. A full list of these matched product-country combinations is provided in Table 5.
The matched product-country combinations with non-utilised sustained export potential in SSA are shown in Table 6. There are 13 countries that possess sustained export potential that South Africa is not utilising. These countries include Côte d'Ivoire, Senegal, Guinea-Bissau, Sao Tome, Malawi, Niger, Benin, Burkina Faso, Cameroon, Guinea, Mauritania, Somalia, and Zambia.
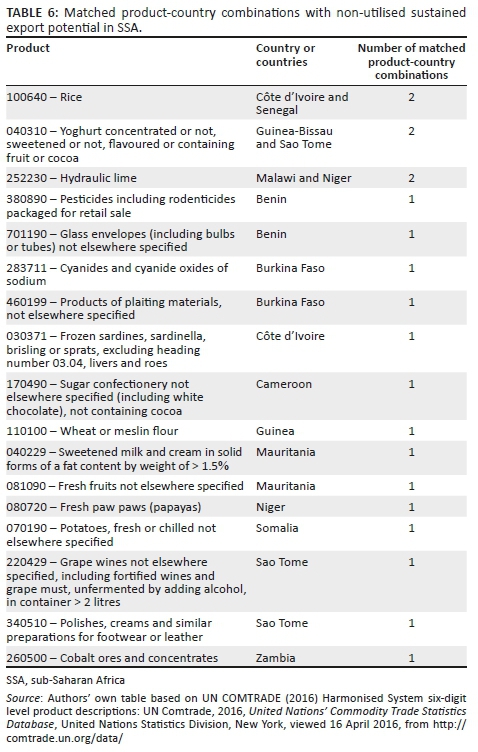
There are a total of 20 matched product-country combinations with non-utilised sustained export potential in SSA. A full list of these matched product-country combinations is provided in Table 6.
The results presented in this section can be a starting point for policymakers and export promotion organisations as well as industry associations to obtain information and formulate strategies to enhance utilisation of sustained export opportunities for South Africa identified in SSA.
Conclusions and recommendations
In evaluating South Africa's utilisation of sustained export potential in SSA (a hitherto neglected area), this article makes an important contribution to international trade literature. The results reveal that South Africa is utilising only 58% of its sustained export potential identified in SSA (i.e. growing exports in Figure 4). However, it is underutilising 21% of its sustained export potential identified in SSA (i.e. declining exports in Figure 4). In addition, the country is not utilising 21% of its sustained export potential identified in SSA (i.e. no trade or extinct exports in Figure 4). Most of the export potential that South Africa is utilising is in Eastern Africa, whereas most of the export potential that it is underutilising as well as not utilising is in Central and Western Africa.
Based on the main findings of this article, it is recommended that policymakers, export promotion organisations and industry associations investigate the reasons behind South Africa's underutilisation and non-utilisation of sustained export potential identified in SSA. Having established the fundamental causes, these entities should formulate strategies aimed at enhancing the utilisation of sustained export potential in SSA which South Africa is either underutilising or not utilising. Policymakers, for example, can contribute by improving the country's export environment (by investing in improved regional infrastructure to reduce trade costs), engaging in tariff policy negotiations with the relevant importing countries, and taking part in regional trade facilitation initiatives.
Following the recommendations of Cuyvers et al. (2012b), South African export promotion organisations and industry associations can take the following actions to improve the utilisation of South Africa's sustained export potential in SSA: improving export incentives and trade financing instruments; providing market information to alert exporters to the potential of different markets; taking potential exporters on trade missions supported by media campaigns in the target countries; giving incentives to potential exporters for participating in specialised trade fairs and exhibitions which attract importers from the target countries; giving financial support for the development of publicity material and improving product design and quality; and matching South African exporters of complementary products with potential in the same target markets to form 'piggy-back' export systems.
Focus should not be completely redirected from sustained export opportunities that South Africa is utilising in SSA. Instead, the growth of South Africa's actual exports for such matched product-country combinations needs to be maintained. In this regard, policymakers, export promotion organisations, and industry associations should continue making strides towards improving South Africa's export competitiveness and the accessibility of such SSA markets where South Africa is utilising its sustained export potential.
Limitations of the study and future research
The following limitations related to this study are worth noting. Firstly, the HS 2002 Revision direct import data at the HS six-digit level is not available for most of the SSA countries (excluding South Africa). In such circumstances, mirror import data had to be relied on despite direct import data being more desirable.
Secondly, only eight of the 9 254 product-country combinations identified in SSA countries in Southern Africa (excluding South Africa) projected consistently large and/or growing import demand from 2010 to 2014. SSA countries in Southern Africa are all members of SACU. Owing to the aggregation of trade data for SACU members in the UN COMTRADE database until 2009, it is possible that the import data for individual SACU members were not properly captured.
Thirdly, with regard to the RFII, the results show that most of the products that South Africa consistently exports competitively (i.e. sustainable exports) fall outside the country's factor endowment point as a result of high requirements of physical capital per worker (see quadrants A, B, and D, in Figure 2). Such products include fresh grapes, fresh fruits, yoghurt, edible nuts, fresh apples and grape wines. The reason for these products falling outside South Africa's factor endowment point is simply that they are also produced by countries richly endowed with physical capital. Hence, based on the calculation method of the RFII, they tend to have a high requirement of this factor endowment. This triggers questions about the accuracy of the 2007 UNCTAD data for RFII compiled by Shirotori et al. (2010) - notwithstanding the fact that the data have not been updated since 2010. However, this is the only available measurement of factor endowments required for exports.
Considering the above data limitations, future research could, firstly, investigate the accuracy of SACU data by gathering the customs data of the specific member countries. Secondly, the UNCTAD data for the RFII compiled by Shirotori et al. (2010) must be updated. Furthermore, to broaden the understanding of the results found in this article, future firm-level and country-specific research should be undertaken to establish the reasons behind South Africa's underutilisation and non-utilisation of sustained export potential identified in SSA.
Acknowledgements
Gabriel Mhonyera acknowledges the financial assistance of the World Trade Organization (WTO) towards this research. Opinions expressed and conclusions arrived at are those of the authors and should not necessarily be attributed to the WTO. In addition, Marianne Matthee acknowledges support from the National Research Foundation (NRF) of South Africa (Grant Number 90709). Any opinion, finding and conclusion or recommendation expressed in this material is that of the authors and the NRF does not accept any liability in this regard.
Competing interests
The authors declare that they have no financial or personal relationships that may have inappropriately influenced them in writing this article.
Authors' contributions
This article is based on the Master's-degree dissertation of G.M., who constructed the article. E.S. and M.M. were the supervisors, and assisted with conceptual construction of the study.
References
Agosin, M. 2007. Trade and growth: Why Asia grows faster than Latin America, Palgrave Macmillan, London. [ Links ]
Amiti, M. & Freund, C. 2010. The anatomy of China's export growth. (In Feenstra, R.C. & Wei, S., eds. China's growing role in world trade. University of Chicago Press, pp. 35-56. Chicago, IL. [ Links ]
Anderson, E. & Coughlan, A.T. 1987. International market entry and expansion via independent or integrated channels of distribution. Journal of Marketing, 51(1):71-82. [ Links ]
Awokuse, T.O. 2003. Is the export-led growth hypothesis valid for Canada? Canadian Journal of Economics, 36(1):126-136. [ Links ]
Aylward, D.K. 2004. Working together: Innovation and export links within highly developed and embryonic wine clusters. Faculty of Commerce-papers, 13(8):429-439. [ Links ]
Balassa, B. 1965. Trade liberalisation and revealed comparative advantage. Yale University Growth Centre, New Haven, CT. [ Links ]
Besedeš, T. & Prusa, T.J. 2011. The role of extensive and intensive margins and export growth. Journal of development economics, 96(2):371-379. [ Links ]
Brenton, P. & Newfarmer, R. 2009. Watching more than the Discovery channel to diversify exports. (In Newfarmer, R.S., Shaw, W. & Walkenhorst, P., eds. 2009. Breaking into new markets: Emerging lessons for export diversification. Washington, DC: pp. 111-124, World Bank, Washington, DC. [ Links ]
Cadot, O., Iacovone, L., Pierola, D. & Rauch, F., 2011, Success and failure of African exporters, World Bank, Washington, DC. [ Links ]
Calantone, R.J., Cavusgil, S.T., Schmidt, J.B. & Shin, G., 2004, 'Internationalisation and the dynamics of product adaptation: An empirical investigation', The Journal of Product Innovation and Management 21(3), 185-198. https://doi.org/10.1111/j.0737-6782.2004.00069.x [ Links ]
Cuyvers, L., 1997, Export opportunities of Thailand: A decision support model approach, viewed 26 March 2016, from http://webhost.ua.ac.be/cas/PDF/CAS09.pdf [ Links ]
Cuyvers, L., 2004, 'Identifying export opportunities: The case of Thailand', International Marketing Review 21(3), 255-278. https://doi.org/10.1108/02651330410539611 [ Links ]
Cuyvers, L., De Pelsmacker, P., Rayp, G. & Roozen, I.T.M., 1995, 'A decision support model for the planning and assessment of export promotion activities by government export promotion institutions: The Belgian case', International Journal of Research in Marketing 12(2), 173-186. https://doi.org/10.1016/0167-8116(94)00021-F [ Links ]
Cuyvers, L., Steenkamp, E. & Viviers, W., 2012a, 'Methodology of the decision support model', in L. Cuyvers & W. Viviers (eds.), Export promotion: A decision support model approach, pp. 52-80, Sun Media, Stellenbosch. [ Links ]
Cuyvers, L., Viviers, W., Sithole-Pisa, N. & Kühn, M.L., 2012b, 'Developing strategies for export promotion using a decision support model: South African case studies', in L. Cuyvers & W. Viviers (eds.), Export promotion: A decision support model approach, pp. 191-210, Sun Media, Stellenbosch. [ Links ]
Devi, R., 2014, 'An analytical study on the export led growth strategy and India's development', The International Journal of Business and Management 2(7), 1-9. [ Links ]
Gallagher, K.P., Moreno-Brid, J.C. & Porzecanski, R., 2008, 'The dynamism of Mexican exports: Lost in Chinese translation?', World Development 36(8), 1365-1380. https://doi.org/10.1016/j.worlddev.2007.08.004 [ Links ]
Hausmann, R., Hwang, J. & Rodrik, D., 2007, 'What you export matters', Journal of Economic Growth 12(1), 1-25. https://doi.org/10.1007/s10887-006-9009-4 [ Links ]
Hausmann, R. & Klinger, B., 2006, Structural transformation and patterns of comparative advantage in product space, Harvard University, Cambridge, MA. [ Links ]
IMF, 2015, Regional economic outlook: Sub-Saharan Africa, viewed 12 May 2016, from http://www.imf.org/external/pubs/ft/reo/2015/afr/eng/sreo1015.htm [ Links ]
ITC (International Trade Centre), 2017, Trade statistics for international business development, viewed 16 November 2017, from http://www.trademap.org/Country_SelProduct_TS.aspx?nvpm=1||7|||TOTAL|||2|1|1|1 |2|1|3|1|1 [ Links ]
Jarreau, J. & Poncet, S., 2012, 'Export sophistication and economic growth: Evidence from China', Journal of Development Economics 97(2), 281-292. https://doi.org/10.1016/j.jdeveco.2011.04.001 [ Links ]
Jessen, A. & Vignoles, C., 2004, Trinidad and Tobago: Trade performance and policy issues in an era of growing liberalisation, viewed 16 March 2016, from http://idbdocs.iadb.org/wsdocs/getdocument.aspx?docnum=33036620 [ Links ]
Kehoe, T.J. & Ruhl, K.J., 2003, How important is the new goods margin in international trade? viewed 12 March 2016, from http://s3.amazonaws.com/academia.edu.documents/76353/2mtkh3678s2872afmt6o.pdf? AWSAcce ssKeyId=AKIAJ56TQJRTWSMTNPEA&Expires=1478170009&Signature=5zOlJoiJc91CCdK CMyCOJd1AoLg%3D&response-content-disposition=inline%3B%20filename%3DHow_Important_is_the_New_Goods_Margin_i.pdf [ Links ]
Lall, S., 1999, 'India's manufactured exports: Comparative structure and prospects', World Development 27(10), 1769-1786. https://doi.org/10.1016/S0305-750X(99)00084-4 [ Links ]
Lee, J., 2011, 'Export specialisation and economic growth around the world', Economic Systems 35, 45-63. https://doi.org/10.1016/j.ecosys.2010.11.002 [ Links ]
Matthee, M., Idsardi, E. & Krugell, W., 2016, 'Can South Africa sustain and diversify its exports?', South African Journal of Economic and Management Sciences 19(2), 249-263. https://doi.org/10.4102/sajems.v19i2.1324 [ Links ]
Porter, M.E., Ketels, C. & Delgado, M., 2007, 'The microeconomic foundations of prosperity: Findings from the business competitiveness index', in A. Lopez-Claros, M. E. Porter, X. Sala-i-Martin & K. Schwab (eds.), The global competitiveness report 2007-2008, pp. 191-210, Macmillan, Palgrave. [ Links ]
Reis, J.G. & Farole, T., 2012, The trade competitiveness diagnostics toolkit, World Bank, Washington, DC. [ Links ]
Rodrik, D., 2007, 'Industrial development: Some stylised facts and policy directions', in UN (UNITED NATIONS) (ed.), Industrial development for the 21st century: Sustainable development perspectives, pp. 7-28, United Nations, New York. [ Links ]
Shankarmahesh, M.N., Olsen, H.W. & Honeycutt, E.D., 2005, 'A dominant product-dominant country framework of industrial export segmentation', Industrial Marketing Management 34(3), 203-210. https://doi.org/10.1016/j.indmarman.2004.09.002 [ Links ]
Shirotori, M., Tumurchudur, B. & Cadot, O., 2010, Revealed factor intensity indices at the product level, viewed 10 June 2016, from http://r0.unctad.org/ditc/tab/index.shtm [ Links ]
South Africa, DTI (Department of Trade and Industry), 2010, A South African trade policy and strategy framework, viewed 15 March 2016, from http://www.tralac.org/files/2012/12/Trade-Policy-and-Strategy-Framework-2010.pdf [ Links ]
South Africa, IDC (Industrial Development Corporation), 2014, Export opportunities for South Africa in selected African countries, viewed 16 June 2016, from http://www.idc.co.za/home/financial-results/research-reports.html [ Links ]
South Africa, NPC (National Planning Commission), 2013, National Development Plan vision 2030, viewed 05 February 2016, from http://www.gov.za/sites/www.gov.za/files/Executive%20Summary-NDP%202030%20-%20Our%20future%20-%20make%20it%20work.pdf [ Links ]
South Africa, NT (National Treasury), 2017, Medium-Term Budget Policy Statement, viewed 28 November 2017, from http://www.treasury.gov.za/documents/MTBPS/2017/mtbps/FullMTBPS.pdf [ Links ]
Statistics South Africa, 2015, South Africa's economy narrowly avoids recession, viewed 07 February 2016, from http://www.statssa.gov.za/?p=5861 [ Links ]
Steenkamp, E.A., Sonja, G. & Viviers, W., 2015, Streamlining South Africa's Export Development Efforts in Sub-Saharan Africa: A decision support model approach, viewed 26 March 2016, from http://2015.essa.org.za/fullpaper/essa_3040.pdf [ Links ]
Steenkamp, E.A. & Viviers, W., 2012, 'The identification of export opportunities for South Africa in the rest of the African content', in L. Cuyvers & W. Viviers (eds.), Export promotion: A decision support model approach, pp. 137-162, Sun Media, Stellenbosch. [ Links ]
UN Comtrade, 2016, United Nations' Commodity Trade Statistics Database, United Nations Statistics Division, New York, viewed 16 April 2016, from http://comtrade.un.org/data/ [ Links ]
UN (United Nations), 2013, Average number of years of education received by people ages 25 and older, converted from education attainment levels using official durations of each level, viewed 10 June 2016, from http://hdr.undp.org/en/content/mean-years-schooling-adults-years#footnote [ Links ]
Van Niekerk, A. & Viviers, W., 2014, 'Promoting sustainable economic growth in South Africa through the export of low-carbon environmental goods', South African Journal of Economic and Management Sciences 17(4), 427-439. https://doi.org/10.4102/sajems.v17i4.607 [ Links ]
Viviers, W., Cuyvers, L., Steenkamp, E., Grater, S., Matthee, M. & Krugell, W., 2014, 'Identifying new product and service export opportunities for South Africa using a decision support model', International Business and Economics Research Journal 13(6), 1403-1418. https://doi.org/10.19030/iber.v13i6.8930 [ Links ]
Vollrath, T., 1991, 'A theoretical evaluation of alternative trade intensity measures of revealed comparative advantage', Weltwirtschaftliches Archiv 127(2):265-280. https://doi.org/10.1007/BF02707986 [ Links ]
WB (World Bank), 2013, Online trade outcomes indicators: User's manual, viewed 10 February 2016, from http://www.wits.worldbank.org/WITS/docs/TradeOutcomes-UserManual.pdf [ Links ]
WB (World Bank), 2014, South Africa economic update: Focus on export competitiveness, viewed 10 February 2016, from http://www.wds.worldbank.org/external/default/WDSContentServer/WDSP/IB/2014/02/0 3/000333037_2014020312 0030/Rendered/PDF/843690NWP0P13100SAEU50for0web0final.pdf+&cd=2&hl=en&ct=clnk [ Links ]
Willemé, P. & Van Steerteghem, D., 1993, 'Een normatief model voor de planning van export-bevorderende activiteiten van de Vlaamse Dienst voor de Buitenlandse Handel', Unpublished. [ Links ]
 Correspondence:
Marianne Matthee
marianne.matthee@nwu.ac.za
Received: 02 May 2017
Accepted: 23 Apr. 2018
Published: 31 July 2018
1 . In this article, it is assumed that if a product is exported consistently with a comparative advantage (RTA > 0 and RCA > 0.7) over a five-year period, it can be classified as a sustainable export.
2 . Each country has a distinct export structure, which can be defined with reference to the technological composition of its exports (Lall 1999).
3 . South Africa's actual exports in 2014 are greater than its actual exports in 2010.
4 . South Africa's actual exports in 2014 are less than its actual exports in 2010.
5 . South Africa's actual exports = 0 for all the years from 2010 to 2014.
6 . South Africa's actual exports > 0 from 2010 to 2013, but = 0 in 2014.
7 . Short-term import growth rate = ([Imported value in year 2 - Imported value in year 1] / Imported value in year 1).
8 . Long-term compounded import growth rate = ([Imported value in year 5 / Imported value in year 1] ^ [1/n] - 1), where the number of years n = 5.
9 . Although the analysis runs over the period 2011 to 2014, import data for 2005 to 2010 is necessary to calculate long-term (5-year) import growth rates.
10 . http://comtrade.un.org/data/
11 . Between 0.8 and 1 multiplied by the world's average import growth rate of product j.
12 . http://unctad.org/Sections/ditc_tab/docs/RFII_2010_Excel.zip
13 . Sudan and Reunion were excluded due to data constraints.
14 . Some of the matched product-country combinations consist of a single product consistently exported by South Africa competitively matching to or more SSA markets with consistently large and/or growing import demand. Hence, 94 matched product-country combinations identified in SSA comprises of a total of 69 products.

