Services on Demand
Article
Indicators
Related links
-
 Cited by Google
 -
 Similars in Google
Share
South African Journal of Economic and Management Sciences
On-line version ISSN 2222-3436
Print version ISSN 1015-8812
S. Afr. j. econ. manag. sci. vol.21 n.1 Pretoria 2018
http://dx.doi.org/10.4102/sajems.v21i1.1821
ORIGINAL RESEARCH
Assessing fiscal sustainability in Swaziland
Welcome N. Nxumalo; Nomvuyo F. Hlophe
Department of Economic Policy Research and Statistics, Central Bank of Swaziland, Swaziland
ABSTRACT
BACKGROUND: Understanding and assessing fiscal sustainability is essential in ensuring financial and macro-economic stability. Fiscal sustainability has emerged as an important subject for Swaziland given the increasingly volatile government revenues especially those coming through the South African Customs Union (SACU), which threw the country into a severe fiscal crisis between 2010 and 2012, as well as the pressures on increased government spending in the post-fiscal crisis era.
AIM: This article primarily focuses on studying whether Swaziland's fiscal policy remains on a sustainable path or whether corrective measures would be required.
SETTING: Study focuses on Swaziland, a small open economy that is vulnerable to external shocks. The country also relies heavily on South African Customs Union (SACU) revenues.
METHODS: The study employs a broad approach to assessing fiscal sustainability in Swaziland covering both deterministic and stochastic analysis. On the deterministic analysis, the article studies the evolution of debt given macro-economic variables and further estimates fiscal sustainability indicators such as the primary gap and tax-gap. From a stochastic analysis, the article uses the Trehan and Walsh Methodology as well as Hakkio and Rush Methodology.
RESULTS: Fiscal sustainability indicators reflected that the country is on an unsustainable path with a primary gap and tax-gap of about 7% of gross domestic product (GDP) that has to be corrected. The econometric results also portray an evidence of 'weak-form' sustainability in the long-run. This is because public expenditures are rising at a faster pace than revenues thereby rendering government deficits unsustainable in the medium term. The econometric results also suggest a tax-spend hypothesis in the long-run, while short-run developments point to a spend-tax hypothesis. In both instances the correction measure is cutting expenditure, mainly recurrent expenditure.
CONCLUSION: The study recommends corrective measures (mainly cuts in government expenditure) for fiscal policy to be brought back into a sustainable path without which a fiscal crisis is imminent. The recommendations are mainly based on the fiscal sustainability indicators as they are more forward looking for the short to medium term. The article suggests fiscal rules based on these indicators.
Introduction
The prominence of fiscal policy as a tool has waxed and waned. Before 1930 an approach of limited government or laissez-faire prevailed (Horton & El-Ganainy 2009). Although there are various arguments regarding the role played by fiscal policy in ending the 1930s Great Depression, such as those advanced by Romer (1992) and Perry and Vernengo (2011), the role and objective of fiscal policy gained more prominence in the aftermath of the 2007-2009 financial meltdown as governments stepped in to support financial systems, stimulate growth and mitigate impact on vulnerable groups (Aizenman & Jinjarak 2011; Pelinescu & Caraiani 2010). The second-round effects of the global financial crisis hit Swaziland negatively through reduced revenues from the South African Customs Union (SACU), which led to fiscal imbalances and culminated in a fiscal crisis in 2010/2011 and 2011/2012.
Following 2 years of severe fiscal crisis a recovery in SACU revenues led to improvement in both fiscal and external balances, exerting pressure on the Swaziland Government to the restore growth and social spending which had been sacrificed during the crisis period. Socio-economic challenges faced by the country include inter alia a persistently high poverty level of 63%,1 an unemployment rate of 28.0%,2 a high prevalence of HIV infection and AIDS and a continuous struggle to attract fresh direct foreign investment.
The smallness and openness of the economy has resulted in the Swaziland Government becoming the largest player therein, with a number of State-owned and small-medium enterprises being heavily dependent on business from the government (Basdevant, Forrest & Borislava 2013). Acknowledging the pressure on the government to intervene in the economy to spearhead development initiatives and fight poverty, the Finance Minister in his 2013/2014 budget speech announced that the Government of Swaziland was focusing on a 'big push for growth', with the theme: 'Jump-starting economic growth: bringing prosperity to the people' (Sithole 2013:1). In the subsequent year fiscal policy remained expansionary, the budget speech theme being 'Invigorate economic growth, create employment opportunities and accelerate public sector reforms' (Dlamini 2014:5). However, this had unintended consequences, which have seen the government incur high levels of expenditure with the potential to spiral out of control if corrective measures are not taken soon.
In light of heavy reliance on the government to drive economic growth there is a demand for it to continuously embark on expansionary policies, with expenditure exceeding revenue, which cumulates in increasing public debt. Revenue sources have become increasingly volatile, especially from SACU. Persistent increases in expenditure against shrinking, volatile revenues signal concern regarding sustainability of the fiscus. As noted by Bernanke (2011), large and increasing level of government debt relative to national income or even the prospect of unsustainable deficits has a great economic cost, including rising interest rates that crowd out private investment, reduction in productivity and even increased possibility of a sudden fiscal crisis.
Fiscal adjustments tend to be more painful in an environment of a looming or actual crisis - hence it is very important to assess fiscal sustainability beforehand in order to implement corrective measures if current fiscal policy is deemed unsustainable. This is also important since credibility and sustainability are key in the continuous financing of public debt.
The rest of this article is organised as follows. The next section provides a brief overview of Swaziland's fiscal characteristics, followed by a view of the conceptual framework for analysing fiscal sustainability. This is followed by an empirical strategy with deterministic and stochastic methods for assessing fiscal sustainability, empirical results and conclusions and policy recommendations.
Swaziland's fiscal characteristics
This section provides a brief review of Swaziland's fiscal characteristics in terms of historical trends and composition of fiscal variables. This provides some stylised facts on public sector developments in Swaziland and sets the background for assessing fiscal sustainability in the country.
Government revenue and expenditure trends
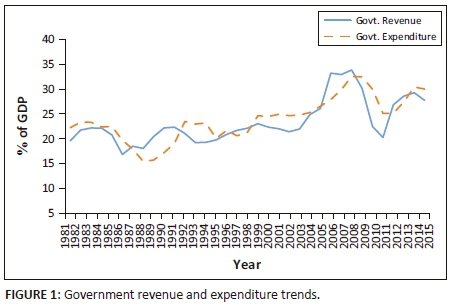
Historical data for the past 35 years show that the highest government revenues were recorded in 2008 at 34.2% of gross domestic product (GDP), while government expenditures peaked at 32.8% of GDP in 2008 and 2009. In the past 10 years (2006-2015), government revenues retained high volatility, mainly associated with volatile SACU revenues. In general, government expenditures tend to lie above government revenues: even when revenue falls, expenditure does not fall to the same degree. The historical trend of government revenue and expenditure is shown in Figure 1.
Over the years SACU transfers have been a major contributor to government revenues, albeit on a declining trend, as illustrated in Figure 2. From around 2005 to 2015, the share of SACU revenue declined by over 10%, from about 61% to 48% during the fiscal crisis period, and is projected to decline further to about 35% of total revenue in 2016/2017. Major domestic sources of revenue are VAT, income tax and corporate tax. Classification of Swaziland as a Lower Middle Income Country by the World Bank means that grant funding has been rather low, at less than 2% of total revenue. While efforts are being made to broaden the domestic revenue base, the volatility of SACU continues to put a major financial constraint on the Swazi Government.
Government expenditure constitutes a capital budget, recurrent budget and statutory expenditure. Recurrent expenditure is broadly broken down into wages and salaries, goods and services and transfers. The capital programme largely consists of road projects, dams/irrigation, construction of buildings, agriculture, housing and amenities and manufacturing. Goods and services under recurrent expenditure largely consist of travel, communication, rentals, drugs, supplies and durables, while transfers include subscriptions to international organisations and subsidies to State-owned enterprises. Figure 2 summarises the composition of government revenues and expenditures over the past 10 years.
Wages and salaries have historically dominated government expenditure, accounting for about 40% thereof (about 10% of GDP), followed by goods and services, which on average accounted for 30% (8% of GDP) and then capital expenditure at 20% of total expenditure (6% of GDP). What can be observed is that during difficult times government responds by reducing the capital budget, as shown in Figure 2 for the period 2011-2013 (which was dominated by a fiscal crisis).
While estimates for 2016/2017 indicate that capital expenditure is rising, wages and salaries are also on the rise. Overall recurrent expenditure accounted for approximately 25% of GDP, while capital expenditure accounted for approximately 7% of GDP over the past 10 years (2005-2015). It is clear that the bulk of government expenditure is recurrent in nature, which loosely means that government has been running recurrent deficits.
Public debt developments
Historically the Swazi Government's debt has been characterised by a low domestic debt to external debt ratio, at around 19% to 81% respectively. This trend persisted from the early 1990s to the mid-2000s. In 2005 government started issuing Treasury bills in a bid to develop the domestic market. As expenditure continued to increase and SACU revenue began falling, the Treasury bills programme became a financing item for government. Figure 3 shows the composition of public debt and its historical evolution. At the peak of the financial crisis in 2009 and 2010, domestic debt declined due to loss of confidence by the market.
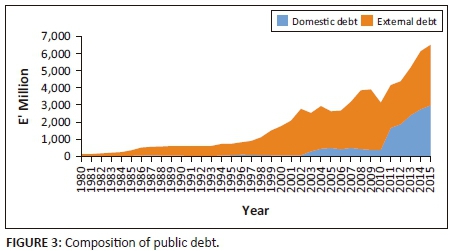
It was established during this period that the domestic market uses SACU revenue as a risk indicator for government securities. When SACU receipts fall, the market perceives lending to government to be a risk, hence the fall in domestic debt during the crisis period. Consequently, an increase in external debt is observed in 2008-2010, not because of new financing but rather because the share of domestic debt to total public debt fell during this period. Perceived risk led foreign creditors to reduce the credit they advanced to government. Confidence was later regained by the market when SACU receipts picked up in the post-crisis era, with domestic debt sitting at 45.8% and external debt at 54.2% of total public debt (as at December 2015).
Conceptual framework on fiscal sustainability
The conceptual framework covers fiscal sustainability definitions and assessment methods which could be applied in the case of Swaziland.
Definition of fiscal sustainability
The concept of fiscal sustainability refers to the ability of a government to sustain its current spending, tax and other policies in the long run without threatening government solvency or defaulting on liabilities or promised expenditures. While the concept seems easy to understand in theory, there is no consensus among economists on the operational definition. According to Krejdl (2006:2), the most general definition states that 'fiscal policy is sustainable if the present value of future primary surpluses is equal to the current level of debt'. However, this definition only covers the solvency condition. Another related concept is that of liquidity: an entity is said to be illiquid if, regardless of whether it satisfies the solvency condition, its liquid assets and available financing are insufficient to meet or roll-over its maturing liabilities.
In broader terms, Schick (2005) argues that fiscal sustainability has four dimensions: solvency (ability of government to pay its financial obligations); growth (fiscal policy that sustains economic growth); stability (capacity of government to meet future obligations with existing tax burdens); and fairness (capacity of government to pay current obligations without shifting the cost to future generations).
Assessing fiscal sustainability
The study on Swaziland's fiscal policy sustainability uses a number of methodologies, mainly geared towards assessing the fiscal sustainability via different indicators, and also runs policy scenarios that yield recommendations needed for correcting the fiscal policy path if results show current policies not to be sustainable in the medium to long term.
As noted by Chalk and Hemming (2000), the starting point for analysing fiscal sustainability is to use a representative agent model where the government satisfies its intertemporal budget constraints in every period. The intertemporal budget constraint is shown by Equation 1:

where  is the discount factor applying between periods t and t + j, Dt is the stock of public debt at time t and PD is the fiscal primary deficit. From Equation 1, sustainability requires that the present value of future primary surpluses must exceed the present value of future primary deficits by an amount sufficient to cover the difference between initial debt stock and the present value of the terminal debt stock.
Noting that the private agents cannot forever remain indebted to the government, implying that the government cannot use Ponzi schemes forever3 to keep rolling its debt infinitely, then the second component of Equation 1 should be zero (i.e. obey the 'no Ponzi scheme condition'), and hence a sustainable fiscal policy has to respect a present value budget constraint (PVBC) of the form

Thus from a PVBC standpoint the sustainability test, as suggested by Chalk and Hemming (2000), will be to test, using historical data, the null hypothesis on whether the transversality condition shown by Equation 3 holds:

This test checks whether the data-generating process for fiscal data is likely to result in the violation of PVBC. The increase in public debt in real terms should not increase indefinitely at a growth rate beyond the real interest rate.
Empirical strategy
In assessing Swaziland's fiscal sustainability the main focus will rest on studying the evolution of the Swaziland Government's debt over time, covering both deterministic debt sustainability analysis (DDSA) and stochastic debt sustainability analysis (SDSA).
Deterministic debt sustainability analysis
For an open economy the government's budget constraint with no seigniorage4 is given by:

Where  ; α represents the share of foreign denominated debt to total public debt, while εt represents the rate of depreciation for the Lilangeni/rand against the US dollar. Dt represents the sum of both domestic and foreign debt adjusted by the nominal exchange rate, and pdt represents the primary balance (government revenues - government expenditure excluding interest payments).
Dividing everything in Equation 4 by nominal GDP yields Equation 5, which allows for analysis of evolution of the debt to GDP ratio:

where dt = debt to GDP ratio and pbt is the primary balance as a percentage of GDP, r is the implicit real interest rate while g represents real GDP growth.
Another measure for fiscal sustainability used by Cruz-Rodriguez (2014) expands on Equation 5, as shown  .
.
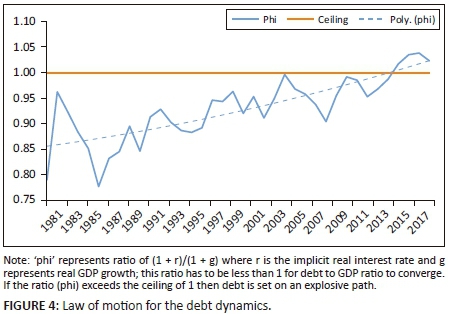
From Equation 5 the interest is in testing whether j *< 1; that is, whether the implicit real interest rate is less than the real GDP growth (i.e. r* < g). If this is achieved then the debt converges; if not, then the debt will explode and fiscal policy will be deemed unsustainable. From Equation 5 the study calculates the primary deficit (surplus) that will be needed to stabilise the debt in the medium term for a given long-run average real economic growth and real implicit interest rates.
Fiscal sustainability indicators
Given the real interest rate, real GDP growth and fiscal variables, the study focuses on two fiscal sustainability indicators: the 'primary gap' and 'tax-gap'. According to Blanchard (1990), a good indicator for fiscal sustainability should be easy to understand and interpret as well as providing the magnitude of adjustment required. Given that fiscal sustainability is a forward-looking concept, it is important to study not only historical data but also whether the projected fiscal variables will obey the government's intertemporal budget constraint. From Equation 5 the primary gap for historical data is calculated as follows:

where bt is the debt stock as a percentage of GDP at time t, (r − g) is the differential between real interest rate and real GDP growth also known as the 'snowball effect', and pdt* is the primary deficit at time t. From a forward-looking perspective a constant sustainable primary deficit (pd*) that will stabilise debt at its initial level is given by the following:

However, if the intention is to achieve a debt level different from initial debt at time T, then the sustainable primary deficit is given by the following:

where bT is the targeted debt to GDP ratio at period T and b0 is the initial debt stock, and r and g represent implicit real interest rate and real GDP growth. The primary gap for both equations 7 and 8 is given by subtracting the projected primary deficit (pdt) from the sustainable deficit (p*), in other words pd*-pdt. If the current/projected primary deficit is higher than the calculated sustainable primary deficit (i.e. pd*-pd < 0) then debt will increase without limit; thus current fiscal policy will be deemed unsustainable. The sustainable primary deficit can be used as a yardstick to guide government towards a sustainable deficit path. The primary gap is then computed by subtracting pdt from pd*, and measures the magnitude of adjustment needed to return fiscal balance to a sustainable level.
Given that the primary deficit is calculated from government primary expenditure and tax revenue, by decomposing the primary deficit to its components more fiscal indicators can be retrieved, one of which is the 'tax-gap'. Like the primary gap, one has to calculate the sustainable tax ratio then compare it with projected tax ratios as a percentage of GDP. The sustainable tax ratio that stabilises debt at its initial level is given by the following:

where τ* is the sustainable tax ratio, and εj is the planned primary government expenditure. If the targeted future debt level at time t (bT) is different from the initial debt level (b0), then the sustainable tax ratio is given by:

The tax-gap is then calculated by subtracting the current/projected tax ratio (τ) from the calculated sustainable one (τ*). If the tax-gap is positive (τ* > τ), that means the current level of tax revenue is not sufficient to cover future government expenditure and debt repayment. Thus adjustments will be needed in fiscal policy if the target of stabilising the debt to GDP ratio at a desired level is to be achieved.
According to Krejdl (2006), the name of the indicator 'tax-gap' does not imply that the necessary changes should come through tax increases. It only suggests that the current tax ratio is not high enough to finance future government spending and service debt - thus a combination of reduced spending and/or increased taxes is necessary for fiscal sustainability. The magnitude of the tax-gap indicator is the size of adjustment required to bring fiscal policy onto a sustainable path.
Given the tax-gap, any delays in the adjustment process entail increased future costs, because the level of debt to GDP ratio which will have to be stabilised in future would be higher. According to Monogios (2011), the cost of any given delay or postponement in filling the tax-gap (i.e. cost of postponing fiscal consolidation) is calculated as follows:

Stochastic debt sustainability analysis
To improve results from the simplistic deterministic debt analysis carried out earlier, this article adopts two econometric methods suggested by Afonso (2000), namely the Trehan and Walsh (1991) method and the Hakkio and Rush (1991) method. The Trehan and Walsh method seeks to test the absence of Ponzi schemes using the following:

where L is the lag operator and Bt is the public debt stock. The point of interest is to test whether (1 - L)Bt is a stationary process. Using the following hypothesis H0:β0= 0, H1:β0 < 0, if the null hypothesis is rejected then debt is sustainable, but if we fail to reject the null hypothesis then that might signal sustainability problems.
The Hakkio and Rush (1991) methodology for fiscal policy sustainability uses co-integration tests. The idea is to test the type of relationship that exists between government revenue and government expenses including interest payments. It involves testing the following co-integration regression5:

If government revenues (Rt) and government expenses, including interest payments (GGt), are I(1), then the point of interest is to test whether the residual series ut is stationary using unit root tests.
The empirical results can be interpreted as follows:
-
If there is no co-integration between R and GG, the fiscal deficit is not sustainable.
-
If there is co-integration with b = 1, the deficit is sustainable.
-
If there is co-integration, with b < 1, then government expenditure is growing faster than government revenue and the deficit may not be sustainable.
Co-integration tests
In estimating the long-run equilibrium shown by Equation 13, the study uses the dynamic ordinary least squares (DOLS) suggested by Stock and Watson (1993), which is deemed to be robust, particularly in small samples. The procedure corrects for a possible simultaneity problem among regressors by including lead and lags of the change in regressors. The Johansen and Juselius (JJ) procedure is also used to complement the co-integration analysis, which will give the number of co-integrating vectors using both the trace statistic and maximum Eigen values test.
Causality tests
Given results from co-integration tests, the causality relationship between government revenues and government expenditures is tested using the Granger causality test. From the JJ procedure, a vector error correction model (VECM) is used to confirm the direction of causality and estimate the speed of adjustment to the deviation from the long-run equilibrium between government revenue and government expenditure. The error correction model is based on the following two equations:


where (µt-1) and (µt-1) represent the error-correction term lagged residual from the co-integration relations. The error-correction terms will capture the speed of short-run adjustments towards long-run equilibrium. Models 14 and 15 also allow for long-run causality between government expenditure and revenue. Negative and statistically significant values of the coefficients of the error-correction terms indicate the existence of long-run causality.
The relationship between government revenue and expenditure would then be interpreted within four hypotheses: (1) the tax-and-spend hypothesis by Friedman (1978), where causality is unidirectional from revenue to expenditure; (2) the spend-and-tax hypothesis by Peacock and Wiseman (1979), where causality is unidirectional from expenditure to revenue; (3) the fiscal synchronisation hypothesis, which means government revenues and expenditures are determined simultaneously (bi-directional causality); and (iv) the institutional separation hypothesis, when there is no causality between revenue and expenditure.
Data sources
The study uses government sector accounts with data on the primary balance, government expenditures, revenues and interest payments - all of which are sourced from the Medium-Term Framework (MoF) as at December 2015 as well as the Budget Estimate Book of 2016/2017. Data on national accounts (GDP) was sourced from the combined sewer overflow (CSO) computed after the 2011 rebasing exercise and published in 2015. Complementary data were sourced from Central Bank quarterly and annual report bulletins. For the variables of interest, such as government revenue, expenditure and debt, annual data for the period 1980-2015 were used. E-views version 9 was used for analysis of data for the different methods highlighted in the conceptual framework.
Empirical analysis
This section presents results of the analysis in line with what was covered in the conceptual framework, divided into two broad areas: deterministic analysis results and stochastic analysis results.
Deterministic debt sustainability analysis results
Evolution of public debt
The DDSA results mainly focus on evolution of the debt to GDP ratio and the short- and medium-term sustainability indicators. Figure 4 depicts the law of motion for Swaziland's total public debt, from which it can be observed that the debt to GDP ratio has historically been on a sustainable path. However, post-2015 forecasts (of implicit interest rates and real GDP growth) show that the sustainable path may have been violated.
Fiscal sustainability indicators
This article analyses two fiscal sustainability indicators, namely primary gap and tax-gap, for both historical series as well as short- to medium-term projections, as discussed in the conceptual framework.
Primary gap indicator: The historical primary gap is calculated using Equation 7. The historical series allows for comparison of 'actual primary balance' and the 'debt-stabilising primary balance'; when the actual primary balance is lower than the debt-stabilising primary balance then debt is set on an unsustainable path. Figure 5 shows comparison of these two primary balances.
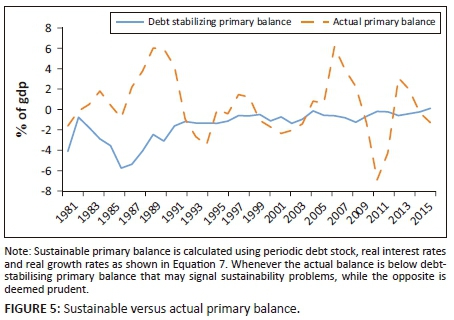
As noted in Figure 5, prior to the 2010-2011 fiscal crises the Government of Swaziland ran a primary balance that was above the debt-stabilising level, which kept debt at low levels and ensured fiscal sustainability. However, after 2011 the primary balance more often fell below debt-stabilising levels, signalling sustainability problems.
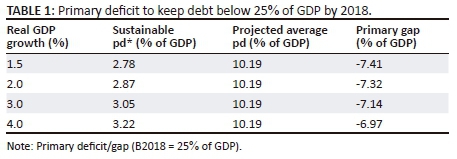
In the medium term, Table 1 shows the different primary deficit levels required to keep debt contained, but these are above the initial level of 14.4% of GDP at the end of 2015. These levels are calculated for the 3-year period 2016-2018 using different real GDP growth rate scenarios: the higher the GDP growth, the wider the space to run primary deficits. For all scenarios the primary gap is negative, suggesting that current and projected primary deficits for 2016-2018, as recorded in the MoF Budget Estimate Book of 2016/2017, are too high to stabilise the debt and thus will lead to a violation of budget constraints. The primary gap of about 7% of GDP provides the magnitude of adjustment required to bring fiscal policy back onto its sustainable path.
Tax-gap indicator: Using Blanchard's (1990) simplistic formulae6 the tax-gap indicator can be compiled to study historical data. When the tax-gap is greater than zero, this depicts periods where actual taxes fell below sustainable levels, and vice versa (as shown in Figure 6). Figure 6 shows that prior to the 1990s the actual tax ratios were significantly higher than the sustainable ones, which kept debt accumulation at bay. However, after the 1990s actual taxes often fell below the sustainable ratios, with a peak of 8% of GDP during the height of the fiscal crisis in 2010-2011.
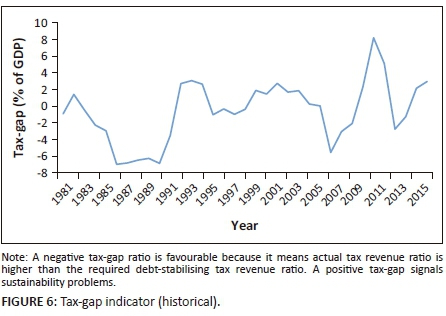
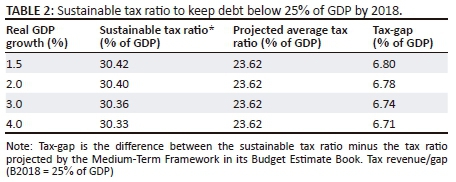
Table 2 shows the sustainable tax ratio that will keep debt below 25% of GDP by 2018. The sustainable tax ratio is 30% of GDP, compared to the projected average tax revenue7 of 23.62% of GDP contained in the MoF Budget Estimate Book of 2016/2017. If the GDP growth averages 1.5% (between 2016 and 2018), as announced in the 2016/2017 budget speech, then a tax-gap of 6.8% of GDP would have to be filled in the short to medium term in order to ensure fiscal sustainability. This can be done through a combination of tax increases and cuts in government spending. Given the slow growth of the economy, the gap would have to be filled from the expenditure side (by cutting expenditure), noting that some tax measures have already been implemented as proposed in the budget speech of 2016/2017.
From the tax-gap calculations, the cost of postponing fiscal consolidation can be calculated for the different achievable real GDP growth rates. According to Table 3, postponing fiscal consolidation by another 3 years post-2018 will cause a 0.87% increase in terms of the sustainable tax ratio that would have to be achieved in order to keep debt at sustainable levels.
The findings of the study are in line with those of Mufusire (2015), who also argued that the restoration of Swaziland's fiscal policy to a sustainable path broadly requires adjustment of fiscal variables (mainly government expenditure) in the short term while structural reforms can be done in the medium term.
Stochastic debt sustainability analysis results
This subsection covers results from econometric analysis, primarily the Trehan and Walsh method and the Hakkio and Rush method, as described in the conceptual framework.
Trehan and Walsh methodology
Through the Trehan and Walsh method interest is on testing for the existence or lack of Ponzi schemes in the data-generating process for debt, as shown in Equation 6. Table 4 shows the results of the econometric estimation of Equation 12 using augmented Dickey Fuller (ADF) tests. According to the results in Table 4, the historical data for Swaziland reflect a 'no Ponzi scheme' on real total debt. However, after splitting the debt into domestic and external, the hypothesis of 'no Ponzi scheme' in the domestic debt is not rejected. This means that the solvency condition is threatened from a real domestic debt point of view. These results are consistent with what prevails in practice in domestic debt issuance where short-term article is issued to meet upcoming maturities. Public external loans, on the other hand, mostly finance development because they are linked to projects. Increase in short-term domestic debt can be expected to threaten total debt sustainability in the medium to long term.

Hakkio and Rush methodology
Under the Hakkio and Rush (1991) methodology to test fiscal sustainability, the interest is on testing for co-integration between government revenue and government expenditure.
Unit root test results: The study determined the degree of integration of research variables using unit root tests. The ADF and Philips Perron (PP) tests with intercept were adopted to check whether the variable (revenue and expenditure) contained unit roots or not. The results are reported in Table 5.
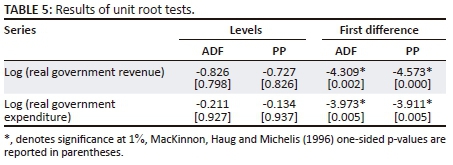
The unit root tests show that both real government revenue and government expenditure are integrated at order 1 I(1) in level and integrated at order zero in first difference I(0).
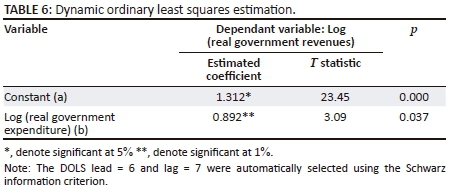
Co-integration tests: Given that the government revenue and expenditure (in real terms) are non-stationary in level, we then test whether the two variables are co-integrated using Equation 13 and testing whether the value of b is statistically significant from 1. This equation is estimated using the dynamic ordinary least squares (DOLS) procedure, which produces more efficient estimators (Table 6). The Engle-Granger and JJ co-integration tests are conducted using the resulting DOLS estimate, and the results are presented in Tables 7 and 8.

The Engle-Granger Tau statistic and the normalised correlation coefficient (represented by the Z statistic), which test for unit root in the residuals of the DOLS output, show that the null hypothesis of no co-integration between government revenue and expenditure is rejected. This is further confirmed by the JJ co-integration tests. Table 8 represents the results of the trace test and maximum Eigen value test statistics for existence of long-run equilibrium between government revenues and expenditure. The null hypothesis of no co-integration (r = 0) based on both the trace test and the maximum Eigen value test is rejected at the 1% level of significance. However, the null of r ≤ 1 could not be rejected.
These tests confirm that there is only one co-integrating vector. From the DOLS estimated output it can thus be concluded that government revenues and expenditures are co-integrated and the co-integrating vector is [1 -0.89]. However, the question of whether or not b = 0.89 is statistically significant from 1 is of interest to this study in understanding the strength of fiscal sustainability. The Wald test is used to ascertain this, and the results are presented in Table 9.

The results from Table 9 show that the coefficient b on government expenditure is statistically significant from 1 (i.e. the null hypothesis of b = 1 is rejected) at 5% level of significance. Thus it can be concluded that Swaziland satisfies a 'weak' condition of sustainability as expenditures are rising at a faster pace than revenues. A 1% increase in government expenditure leads to 0.89 of a percentage point increase in revenues, which means fiscal deficits may become unsustainable in the near future.
Causality tests: Given the existence of a long-term relationship between government revenue and expenditure, the next point of interest is to determine which variable causes which. This is done using the Engle-Granger causality test, the results of which are presented in Table 10.
The Granger causality tests show unidirectional causality from government revenue to government expenditure. The null hypothesis of no causality from revenue to expenditure is rejected, while the null hypothesis that expenditure does not cause revenue is not rejected. This means that increases in revenue induce higher expenditures and not vice versa. This implies a tax-spend hypothesis in government's resource allocation in the long run.
Vector error correction model
The VECM is used to generate short-run dynamics. This article adopts the specification of a VECM government where revenue and expenditure are endogenous variables and national income (real GDP) is used as a control variable. As suggested by Sobhee (2004), the inclusion of national income captures the effects of tax on public spending via output and vice versa. There is one lag based on the Akaike information criterion (AIC) and the final prediction error (FPE) criterion. The VECM results are presented in Table 11.
The results show that in the short run the lag of expenditure variable has a negative impact on current values of revenue. This means that a 1% increase in expenditure at time t leads to a 0.54% decrease in revenue at time t + 1, and this is statistically significant at the 5% significance level. Changes in revenue have an insignificant effect on expenditure in the short run, which means that the spend-tax hypothesis is supported in the short run. The results also show that there is a strong positive association between increases in real GDP and government revenues. A 1% increase in real GDP growth leads to a 1.23% increase in government revenue.
The error correction term for the expenditure equation is statistically significant at 1% level, while the error term for the revenue equation is statistically insignificant at all conventional acceptable levels. This supports the assertion that in the long run causality runs from revenue to expenditure and not vice versa, supporting the tax-spend hypothesis which, according to Friedman (1978), postulates that raising taxes leads to more than proportionate increases in government spending and keeps deficits at high levels. Rezaeri (2015:845) observes that according to this hypothesis the government follows a political rule which says 'the government will spend what it receives plus as much more as it can get away with'. According to Young (2009), under these circumstances fiscal sustainability can be ensured through the 'starve the beast' hypothesis, which basically states 'that the most effective way to shrink the size of government is to reduce the revenue that feeds it' (Romer & Romer 2009:140).
According to these results it can be inferred that increases in SACU revenues (which are the main contributor to total revenues) resulted in more than proportionate increases in government expenditure, especially prior to the fiscal crisis between 2010 and 2012. Conversely, during the fiscal crisis a significant drop in SACU revenues led to an average 25% decrease in revenues, which led to government expenditures being curtailed from 35% of GDP in 2009 to about 23% of GDP in 2012.
The error correction coefficient for the expenditure equation shows that any deviation of government expenditure from its path of equilibrium is restored at a rate of 49.7% each year, and this is statistically significant at the 1% confidence level. For revenue any deviations from equilibrium is restored at a much slower pace of 17.3% each year; however, this figure is not significant at conventional levels of testing.
The verification of short-term and long-term causality is performed using the generalised impulse response function (IRF). Given the dynamic structure of a vector autoregressive (VAR) model, the IRF reveals the effects of simultaneous positive innovation shock in one variable on the current and future values of endogenous indicators.
Figure 7 shows the impulse responses of a one standard deviation innovation for government revenue and on real government expenditures (and vice versa). The impulse response analysis shows that a positive shock (measured as one standard deviation innovation) in real government revenue leads to a sharp increase in government expenditure within the first 2 years of positive shock, followed by a modest decrease and stabilisation at higher levels than before the initial shock. Expenditure, on the other hand, has an insignificant effect on revenues. In fact, a positive shock (impulse) in government expenditures leads to a decrease in government revenues within the first 2 years of the shock and then returns to initial levels. This confirms the tax-spend hypothesis.
Conclusion
The main purpose of this article was to use different methodologies to assess fiscal sustainability in Swaziland. The methodologies were broadly divided into two categories: deterministic and stochastic methods, the latter allowing for backward-looking assessment while the former provided futuristic assessment. Historical assessment showed that historical public debt obeyed the government PVBCs, thereby satisfying the solvency conditions. However, Swaziland satisfies a 'weak-form' of fiscal sustainability, suggesting that government expenditures are rising at a faster pace than revenues, rendering the deficit unsustainable in the medium term.
VECM results showed that in the short run government was operating according to a spend-tax hypothesis, while in the long run government followed a tax-spend hypothesis. It was also noted that developments in the domestic debt market could result in violation of the transversality condition, which in turn will imply violation of the government's budget constraints and undermine solvency. With government operating under the tax-spend hypothesis, any increases in revenue translate into more than proportionate increases in government expenditure.
Fiscal sustainability indicators showed that the current and planned revenues in the short to medium term are too low to finance planned expenditures and keep debt levels sustainable. A primary gap of 7.4% of GDP and a tax-gap of 6.8% would have to be filled to keep fiscal policy sustainable. With no corrective measures, the cost of postponing fiscal consolidation is estimated at 0.75% each year in terms of widening of the tax-gap.
On the basis of these results, in the short run government spending has to be curtailed to ensure fiscal sustainability. The study recommends that the primary deficit has to be cut to below 3% to keep debt at sustainable levels. Fiscal rules based on tax-gap analysis are also ideal for a given interest growth differential.
Further research has to be undertaken into improving quality, efficiency and effectiveness of government spending in order to ensure the government achieves more from her limited resources.
Acknowledgements
The authors would like to thank the Swaziland Economic Policy Analysis and Research Centre (SEPARC) who initiated the exercise of this research article through her call for paper and the 100% funding that they provided for this article. SEPARC also facilitated the peer reviewing of the article and provided useful comments, particularly the Executive Director Dr. Thula S. Dlamini. More comments were obtained from colleagues from the Central Bank of Swaziland Research department.
Disclaimer: Welcome N. Nxumalo and Nomvuyo F. Hlophe work as Economists in the Central Bank of Swaziland under the Economic Policy Research and Statistics Department. The views expressed in this article are those of the authors and do not necessarily reflect the views or policies of the Central Bank of Swaziland. The authors assume full responsibility of any errors and omissions.
Competing interests
The authors declare that they have no financial or personal relationships that may have inappropriately influenced them in writing this article.
Authors' contributions
The authors worked jointly throughout the execution of this project. W.N.N. made contributions to the conceptual framework and analysis. N.F.H. worked on fiscal data preparation and interpretation of results.
References
Afonso, A., 2000, Fiscal policy sustainability: Some unpleasant European evidence, Instituto Superior de Economia e Gestao Lisbon, Portugal. [ Links ]
Aizenman, J. & Jinjarak, Y., 2011, The role of fiscal policy in response to the financial crisis, Background paper for United Nations, World Economic Situation and Prospects 2011, viewed 10 October 2016, from http://www.un.org/en/development/desa/policy/wesp/wesp_archive/2011wesp _bg_paper_aizenmanpdf [ Links ]
Basdevant, O., Forrest, E. & Borislava, M., 2013, Restoring sustainability in a changing global environment: Options for Swaziland, African Department Publication 13/1, International Monetary Fund, Washington DC. [ Links ]
Bernanke, B., 2011, 'Fiscal sustainability', in Annual Conference of the Committee for Responsible Federal Budget, Washington DC, viewed 11 January 2016, from https://www.federalreserve.gov/newsevents/speech/bernanke20110614a.htm [ Links ]
Blanchard, O., 1990, Suggestions for new set of fiscal indicators, OECD Working Paper No. 79, OECD Publishing, Paris. [ Links ]
Chalk, N. & Hemming, R., 2000, Assessing fiscal sustainability in theory and practice, International Monetary Fund Working Paper No. 00/81, International Monetary Fund, Washington DC. [ Links ]
Cruz-Rodriguez, A., 2014, Assessing fiscal sustainability in some selected countries, MPRA Paper No. 54975, University Library of Munich, Germany. [ Links ]
Dlamini, M.G., 2014, The Budget Speech Presented to the Parliament of the Kingdom of Swaziland, Lobamba, Swaziland. [ Links ]
Friedman, M., 1978, 'The limitations of tax limitation', Policy Review, Summer, 7-14. [ Links ]
Hakkio, C. & Rush, M., 1991, 'Is the budget deficit "too large"?', Economic Inquiry 29(3), 429-445. https://doi.org/10.1111/j.1465-7295.1991.tb00837.x [ Links ]
Horton, M. & El-Ganainy, A., 2009, Back to Basics: What is fiscal policy? Finance and Development Pamphlet, International Monetary Fund, Washington DC. [ Links ]
Ilzetzki, E., 2011, Fiscal policy and debt dynamics in developing countries, Policy Research Working Paper, WPS5666, World Bank, viewed 14 November 2016, from https://openknowledge.worldbank.org/handle/10986/3429 [ Links ]
Krejdl, A., 2006, Fiscal sustainability - Definition, indicators and assessment of Czech Public Finance sustainability, Working Paper Series, Czech National Bank, Prague, Czech Republic. [ Links ]
MacKinnon, J.G., Haug A.A. & Michelis, L., 1999, 'Numerical distribution functions of likelihood ratio tests for cointegration', Journal of Applied Econometrics, 14, 563-577. [ Links ]
Monogios, Y., 2011, The tax-gap as an indicator of fiscal sustainability: Analysis and policy proposals for the case of Greece, Centre of Planning and Economic Research, Athens, Greece. [ Links ]
Mufusire, A., 2015, Assessing Swaziland fiscal sustainability and policy options, Research Article, African Development Bank, Abidjan, Cote d'Ivoire. [ Links ]
Muzenda, A., 2014, 'An empirical assessment for fiscal sustainability in South Africa', Journal of Economics and Sustainable Development, 5(23), 1-7, viewed 21 January 2017, from http://iiste.org/Journals/index.php/JEDS/article/viewFile/16751/17112 [ Links ]
O'Connell, S. & Zeldes, S., 1988, 'Rational ponzi games', International Economic Review, 29(3), 431-450. https://doi.org/10.2307/2526789 [ Links ]
Peacock, A. & Wiseman, J., 1979, 'Approaches to the analysis of government expenditure growth', Public Finance Quarterly, 7, 3-23. https://doi.org/10.1177/109114217900700101 [ Links ]
Pelinescu, E. & Caraiani, P., 2010, 'Fiscal policy in the context of the economic crisis', Romanian Journal of Fiscal Policy, 1(1), 1-21. [ Links ]
Perry, N. & Vernengo, M., 2011, What ended the great depression? Re-evaluating the role of fiscal policy, Levy Economics Institute Working Paper 678, Levy Economics Institute of Bard College, New York. [ Links ]
Rezaeri, A., 2015, 'Tax-Spend, Spend-Tax or fiscal synchronization hypothesis: Evidence from Iran', International Journal of Innovation and Applied Studies, 10(3), 844-857. [ Links ]
Romer, C.D, 1992, 'What Ended the Great Depression?' The Journal of Economic History 52(4), 757-784 [ Links ]
Romer, C.D. & Romer D.H., 2009, 'Do Tax Cuts Starve the Beast? The Effect of Tax Changes on Government Spending', Brookings Papers on Economic Activity, Spring, 139-214. [ Links ]
Schick, A., 2005, 'Sustainable budget policy: Concepts and approaches', OECD Journal on Budgeting, 5, 107-126. https://doi.org/10.1787/budget-v5-art5-en [ Links ]
Sithole M.V., 2013, The Budget Speech Presented to the Parliament of the Kingdom of Swaziland, Lobamba, Swaziland. [ Links ]
Sobhee, S., 2004, 'The causality between tax and spend of the public sector in Mauritius: A VECM approach', International Journal of Applied Econometric and Quantitative Studies, I, 115-130. [ Links ]
Stock, J. & Watson, M., 1993, 'A simple estimator of co-integrating vectors in higher order integrated systems', Econometrica, 61(4), 783-820. https://doi.org/10.2307/2951763 [ Links ]
Swaziland Government, 2010, '2009/10 Swaziland Household Income and Expenditure Survey - Poverty in a decade of slow economic growth: Swaziland in the 2000s, Central Statistics Office, Mbabane. [ Links ]
Swaziland Government, 2014, The Swaziland Integrated Labour Force Survey 2013/14, Ministry of Labour and Social Security, Mbabane. [ Links ]
Trehan, B. & Walsh, C., 1991, 'Testing inter-temporal budget constraints: Theory and applications to US federal budget and current account deficits', Journal of Money, Credit & Banking, 23(2), 206-223. https://doi.org/10.2307/1992777 [ Links ]
Wigger B.U., 2007, 'A Note on Public Debt, Tax-Exempt Bonds and Ponzi Games', IMF Working Paper WP07/162, International Monetary Fund, Washington DC. [ Links ]
Young A.T., 2009, 'Tax-spend or fiscal illusion?', CATO Journal, 29(3), 469-485. [ Links ]
 Correspondence:
Welcome Nxumalo
ncobas22@gmail.com
Received: 08 Mar. 2017
Accepted: 04 Oct. 2017
Published: 19 Apr. 2018
1 . According to the Swaziland Household Income and Expenditure survey of 2010.
2 . According to the Swaziland Labour Force Survey of 2013-14.
3 . Literature on Ponzi schemes is well documented by O'Connell and Zeldes (1988) and Wigger (2007).
4 . Seigniorage is the revenue governments derive from printing money: the face value of the money minus the cost of physically making and distributing it.
5 . Most recent papers use Vector Error Correction Models (VECM) e.g. Muzenda (2014) or vector auto regressive models (e.g. Ilzetzki 2011).
6 . Using sustainable tax ratio τ* = Primary expt-(gt-rt)bt, where g and r represent the real GDP growth rate and implicit real interest rate; b represent s government stock of debt.
7 . Tax revenue in this context includes both tax and non-tax revenue but excludes grants.


