


Serviços Personalizados
Artigo
 Inglês (pdf)
 Artigo em XML
 Referências do artigo
Indicadores

Links relacionados
-
 Citado por Google
 -
 Similares em Google
Compartilhar

 Permalink
South African Journal of Economic and Management Sciences
versão On-line ISSN 2222-3436
versão impressa ISSN 1015-8812
S. Afr. j. econ. manag. sci. vol.21 no.1 Pretoria 2018
http://dx.doi.org/10.4102/sajems.v21i1.1717
ORIGINAL RESEARCH
Quantitative efficiency assessment based on the dynamic slack-based network data envelopment analysis for commercial banks in Ghana
Zhixiang ZhouI; Nelson AmowineII; Dechun HuangIII
ISchool of Economics, Hefei University of Technology, China
IISchool of Business, Hohai University, Ghana
IIIDepartment of Economics and International Trade School of Business, Hohai University, China
ABSTRACT
BACKGROUND: Gains in bank efficiency improvement have widely been regarded as one of the most effective and efficient means of ensuring sustainability of a financial system.
AIM: This article proposes a relative dynamic two-stage network data envelopment analysis model for measurement of bank efficiency based on the slack-based measure..
SETTING: Twenty-seven banks in Ghana during the period of 2009-2014.
METHODS: By considering simultaneous processes within the framework of two-stage data envelopment analysis, the slack-based measure approach identifies the sources of inefficiency in the banks..
RESULTS: In the empirical analysis, non-performing loans are an undesirable output in one production process, which should also be treated as a carry-over factor; that is to say, some non-performing loans from the preceding year can be collected in the current year. The carry-over factors should be used to indicate the presence of performance gaps that exist in the banks. The proposed model was used to measure the efficiency of the 27 banks in Ghana during the period of 2009-2014. We also present useful suggestions for improvement in bank efficiency based on the empirical results.
CONCLUSION: The 27 main commercial banks in Ghana are far from efficient. For all banks, the efficiency score in the second stage is much higher than that of the first stage. That means more attention should be paid to the first stage of production in order to increase the banks' efficiency.
Introduction
The banking sector has a significant impact on the development of economies worldwide. Specifically, financial intermediation activities of the banking sector constitute a key element for implementation of development projects. Accordingly, the balanced development of commercial banks is needed to ensure macroeconomic stability along with economic growth. In this context, Amado, Santos and Marques (2012) emphasised that efficiency measures play a vital role in attaining sustainable development within a competitive system.
Data envelopment analysis (DEA), as proposed by Charnes, Cooper and Rhodes (1978), has widely been applied for analysis of banking efficiency in Ghana (Alhassan & Ohene-Asare 2016; Alhassan, Tetteh & Brobbey 2016; Saka, Aboagye & Gemegah 2012). The technique can easily accommodate multiple input-multiple output frameworks (Paradi, Rouatt & Zhu 2011; Paradi & Zhu 2013) and is superior to partial analysis (e.g. ratio analysis), which lacks both comprehensibility and theoretical background.
There is a plethora of literature available on banking efficiency. The first group of studies applies or extends traditional DEA models to evaluate the efficiency of banks, such as multidimensional efficiency of banks (Asmild & Matthews 2012), technical and economies of scale (Paradi & Zhu 2013), cost and profitability efficiency of banks in China (Ariff & Luc 2008), as well as the impact of the environment on bank efficiency (Yao, Han & Feng 2008a). In these studies, banks are treated as a 'black box', without explicitly modelling the impacts of either intermediate or carry-over factors.
Another group of studies attempted to describe the banking processes in a more detailed manner and defined different stages of operation. Seiford and Zhu (1999) proposed the two-stage DEA model and applied it in their evaluation of commercial bank efficiency, with profitability marketability stages taken into consideration. Cook and Hababou (2001) estimated the impact of sales performance on bank branches' efficiency, using the multicomponent DEA approach. The effect of the performance of information technology on retail banking activities was analysed by means of a two-stage DEA model by Meepadung, Tang and Khang (2009). A novel slack-based measure (SBM) two-stage model for measuring serial production performance of banks was proposed by Fukuyama and Weber (2010). Wang et al. (2014) introduced an additive two-stage DEA model to explore the efficiency of commercial banks in China. The latter approach assumed two serial stages in the banking activities.
During the measurement of bank performance, some scholars proposed dynamic DEA models for calculating the effect of variables over a number of years (multiple time period approach). Kao and Liu (2014) measured the performance of commercial banks in Taiwan, in which the overall efficiency was obtained by using the weighted mean of the efficiency in each period. Akther, Fukuyama and Weber (2013) adopted the SBM and directional technology function to study bank inefficiency, emphasising the effect of intermediate outputs (security investments and loans) under the multiple time period approach.
The aforementioned studies analyse the efficiency of banks by only considering internal complex structures (i.e., multiple components and two serial stages) or dynamic efficiency by treating the banks as 'black box'. None of them calculate bank efficiency by considering the positive influence of non-performing loans (NPLs), by using the carried-over factors in the dynamic two-stage DEA structure. Hence, the present literature on banks' efficiency naturally ignores consecutive time periods of the carry-over factors in the two-stage process, and this novel approach is used in evaluating banks in Ghana for the first time. Alhassan, Kyereboah-Coleman and Andoh (2014) believe the NPLs account for a very high proportion of Ghanaian banking industry assets and should be a significant determinant of banks' asset quality. Therefore, a more appropriate approach is required to deal with the efficiency evaluation of banks in Ghana with two internal stages during multiple time periods. This current study, therefore, considers the internal processes of banks in the measurement of their relative efficiencies. The multiple-period dynamic concept is used in the computation of efficiency, where the carry-over factor of NPLs and loans of the previous years are used in addition to the current year variable to get the efficiency score for each bank.
Recently, the Ghanaian economy has witnessed a massive phenomenal transformation and expansion of the banking industry. This important development can be attributed to the systemic implementation of the Financial Sector Adjustment Programme in 1986 and the gradual execution of the Financial Sector Strategic Plan in 2003 (Bawumia 2010).
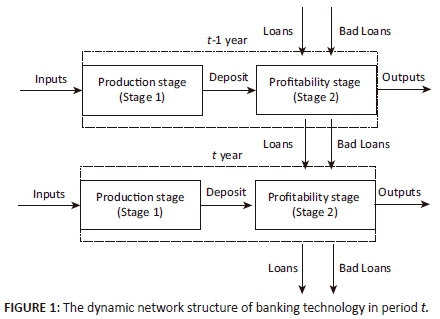
To improve the operational efficiency of the banks in Ghana, it is necessary to develop an appropriate model encompassing their operational processes. Generally, a commercial bank collects deposits from the public and then provides loans or makes financial investments to fund the development of various businesses to obtain interest revenue. In order to reflect the bank operational process in a more detailed and systematic manner, it can be subdivided into the production and profitability stages. The two-stage DEA framework can be applied to model the bank operational process in terms of sub-processes, or stages (Yang & Liu 2012). The first stage involves the use of bank resources, namely interest and operating costs, to attract deposits from the customers. The second stage, referred to as the profitability stage, defines the generation of operating and interest income. The deposit thus appears as output in Stage 1 and then as input in Stage 2.
Furthermore, NPLs can be treated as a dynamic factor. Within a certain time period, NPLs can be an undesirable output in the profitability stage. In the subsequent time period, it can also be treated as an undesirable output in Stage 2.
In the practice of the Ghanaian banking system, NPLs are generated in the profitability stage when the loan issued by the bank cannot be paid back during the given time period. Banking activities are affected by this problem in two ways: first, by the loss of the income - banks with higher volumes of NPLs are eventually treated as being less efficient by using NPLs as an undesirable output at the profitability stage (Färe & Grosskopf 2004); and second, as pointed out by Akther et al. (2013) and Fukuyama and Weber (2010), NPLs can be treated as a carry-over factor - NPLs resulting in a certain period can be carried over to the succeeding period, and the model is thus entered as a desirable input.
In the latter period, either the NPL can be offset by the income generated in the profit-earning stage, or the volume of NPLs can further be increased. As assumed by Akther et al. (2013), Tone and Tsutsui (2014) and Zha et al. (2016), NPLs should be modelled as an undesirable or bad output for banks.
In order to address both theoretical and empirical circumstances discussed above, this article treats the NPLs and loans as undesirable and desirable carry-over variables, respectively, in the profitability stage in Ghanaian banks. By doing so, we acknowledge that NPLs can influence the performance in the profitability stage during both the present and previous periods, and this may be reflected by alterations in the level of efficiency.
This article aims to estimate efficiency of the Ghanaian banks with respect to dynamics in the NPL and loans as carry-over variables, as well as their inter-temporal impacts. Reasonable evaluation of the operational efficiencies of the banks in Ghana is proposed by means of a dynamic two-stage SBM DEA model. The proposed model encompasses two internal processes and allows both NPLs and loans to be carried over the time periods.
This study contributes to the present literature in that it integrates the two-stage DEA and dynamic DEA for analysis of the banking operations. Specifically, two stages of banking operations are defined for each time period, and the time periods are linked by virtue of the carry-over factors, namely, loans and NPLs. We contribute by conducting an empirical study on efficiency of the Ghanaian banking industry by use of bank-level data. Finally, bank-specific efficiency improvements are discussed based on the proposed model.
The rest of the article is organised as follows: the literature review presents useful literature on applications of the two-stage network DEA to the banking sector; and the novel SBM DEA model for analysis of the banking efficiency is introduced in the 'Methods' section. The application of the proposed model to analyse the performance of commercial banks in Ghana is then discussed, followed by conclusions and recommendations.
Literature review
Techniques employed in the analysis of bank performance include stochastic frontier analysis, financial ratio analysis and DEA, among others. DEA is regarded as an appealing method for evaluation of bank efficiency in that it can model multiple-output-multiple-input technology without assumptions regarding the functional form of representation of the underlying technology. Cook and Seiford (2009), Sherman and Gold (1985), Ruggiero (2007) and Avkiran and Zhu (2016) showed that stochastic frontier analysis method did not generate superior results if contrasted with DEA. Applications of DEA for analysis of bank efficiency cover the following strands: total factor productivity change (Sanyal & Shankar 2011), economies of scale and scope (Berger & Humphrey 1991; McAllister & McManus 1993), performance of bank branches (Camanho & Dyson 1999; Yeh 1996) and analysis of the impact of reforms (Assaf, Matousek & Tsionas 2013; Fujii, Managi & Matousek 2014; Hsiao et al. 2010; Tsang et al. 2014; Wang et al. 2014).
Again, both the traditional and two-stage network DEA models have been applied in the analysis of banking efficiency. Initially, the concept of DEA was put forward by Charnes et al. (1978) and Banker, Charnes and Cooper (1984) on the basis of the pioneering work by Farrell (1957). Also, many studies have employed the DEA technique in measuring the performance of various organisations and industries (Hsu & Hsueh 2009; Liu et al. 2013). However, the traditional DEA model used in measuring the operational efficiency only allows for a single-stage process. In order to properly model activities of banks, one can define more than a single-stage in the production process (Fukuyama & Matousek 2011; Fukuyama & Weber 2010).
Wang, Gopal and Zionts (1997) applied the two-stage DEA concept to evaluate the impact of information technologies on bank efficiency. Zhu (2000) advanced the three-stage DEA model in his evaluation of 500 companies. The results demonstrated that the companies with the maximum revenue did not essentially have the top-ranked performance with regard to profitability and marketability.
The analysis of 55 banks operating in the USA was performed by Seiford and Zhu (1999) in the confines of a two-stage DEA approach. The underlying technology was further subdivided into profitability and marketability sub-processes. Luo (2003) argued that bank efficiency should be analysed in terms of both profitability efficiency and marketability efficiency. The existing literature on the two-stage DEA modelling methodology takes account of the efficiency of the entire banking processes (Kao & Hwang 2011). Lo and Lu (2009) measured the performance of financial holding companies by adopting the slack-based super efficiency DEA methodology. A novel, two-stage network technology technique was put forward by Fukuyama and Matousek (2011) for estimating cost efficiency in Turkey banks. They juxtaposed the traditional and two-stage DEA models. Premachandra et al. (2012) analysed efficiency of mutual funds in the USA by employing the two-stage DEA methodology. Their approach was not only applicable to the constant return to scale and variable return to scale settings, but also allowed the introduction of new intermediate input or output measure in the profitability stage. Fukuyama and Weber (2010) established slack-based, two-stage DEA models to estimate the efficiency of banks with serial operations processes. Wang et al. (2014) presented a novel, two-stage additive DEA model for the measurement of bank efficiency in China, encompassing deposit transformation and profit-earning stages. Indeed, two-stage network DEA has become omnipresent in the banking sector. It is important to note that some two-stage DEA studies do not include undesirable variables in their models (Fukuyama & Matousek 2011; Premachandra et al. 2012), while others do; for example, two-stage network DEA with directional distance function was applied by Asmild and Matthews (2012). Indeed, one might arrive at biased efficiencies if undesirable variables related to the risk dimension remain ignored (Chen 2012).
There are other studies that have focused on evaluating the efficiency of Ghanaian banks. First, Alhassan et al. (2014) examined the bank-level factors to explain the performance of the Ghanaian bank loan portfolio, based on the research of Aboagye et al. (2008). Next, the Malmquist productivity index (Alhassan & Biekpe 2015) and stochastic frontier analysis (Aboagye 2012), together with DEA (Saka et al. 2012), were utilised to measure the efficiency of Ghanaian banks. Additionally, Alhassan et al. (2016) combined DEA approach with the Herfindahl Index and concentration ratio to evaluate the relationship between efficiency and profitability of 26 Ghanaian banks from 2003 to 2011. Alhassan and Ohene-Asare (2016) employed the two-stage DEA models to measure the technical and cost efficiencies of 26 Ghanaian banks from 2004 to 2011, and provided the paths for inefficient banks to 'catch-up' with efficient banks. Alhassan and Tetteh (2017) constructed a two-stage DEA bootstrapping approach to examine the effect of the inclusion of non-interest income on the efficiency and economics of scale of Ghanaian banks. In order to account for the internal processes of banking, we adopt the two-stage network DEA methodology in this article.
Methods
We assume that there are n banks in Ghana to be analysed systematically. For the j-th bank, j=1,…,n, in a particular time period t (t=1,2,…,T), Stage 1 consumes m inputs  to produce k intermediate products
  its Stage 2 generates s desirable outputs
  and h undesirable outputs
  by utilising the intermediate products and h undesirable inputs
  produced in the previous time period t-1. Note that
  are the links between the two stages, and
  are the carry-over factors, which are taken from period t-1 and the inputs for period t. We construct a new network structure for commercial banks, as shown in Figure 1.
Following the prior works of Chen et al. (2009) and Kao (2009), as well as the dynamic DEA network approaches of some researchers (Kao 2009; Tone & Tsutsui 2010, 2014), Tone and Tsutsui (2010) report that dynamic DEA network correlation variables can be classified into three types, namely fixed, free desirable and undesirable variables within the multiple-stage system. The above-mentioned studies give us a useful framework for the formulation and construction of our model for estimating the efficiency of the commercial banks in Ghana.
Production possibility set
We regarded bank operations in Ghana as a network structure, for simplicity of the analysis, where bank deposits generated in the production stage are utilised in the profitability stage in a time period (t) to boost the bank returns.
The carried-over factors (NPLs and loans) generated in the previous year (t-1) can be counterbalanced during the current production year (t) to reduce each bank assets' risk significantly. These important assumptions for the deposit and carried-over factors (NPLs and loans) are both established for each bank, in which the connection between different stages and periods is constant. Following the prior works of Tone and Tsutsui (2014) and Zha et al. (2016), we define our production possibility sets as  :
:
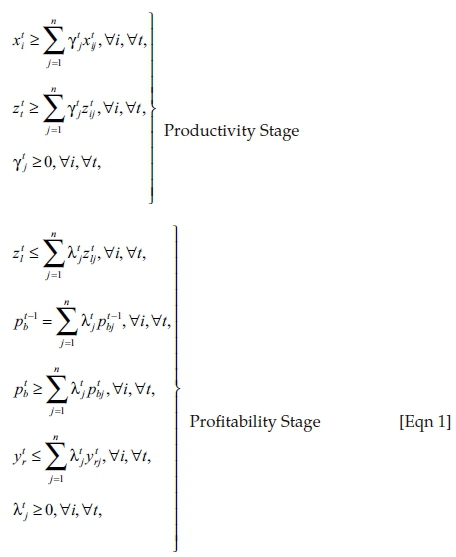
In model 1,  are the vectors to the two stages in time period t.
The proposed model
To properly estimate banks' efficiency, the radial and non-radial efficiency measures are the two measures mostly adopted in recent studies. As stated by Tone and Tsutsui (2014), the non-radial SBM technique can deal with the phenomenon of both 'the input excess' and 'output shortfall'. It can also help in assigning each decision-making unit to a 'furthest' point on the frontier, in that the optimal function can be minimised by evaluating the maximum slacks. In this regard, SBM is an efficient tool for determining the sources of the inefficient banks within the structure of network DEA. We therefore applied the same concept in constructing our two-stage SBM model to estimate the performance of commercial banks in Ghana empirically.
As stated before, the productivity stage is characterised by banks trying to maximise their desirable outputs for a given input and simultaneously optimising both the inputs and outputs. In the profitability stage, however, banks try to boost their profits and decrease their NPLs to the minimum level. It is essential to consider the evaluation of banks by taking these two stages into consideration. However, the previous year's (t-1) NPLs of a given bank can be collectible in the current year (t), resulting in additional revenue for the banks. Based on this multiplicity of time period technology, the overall efficiency can be obtained by:
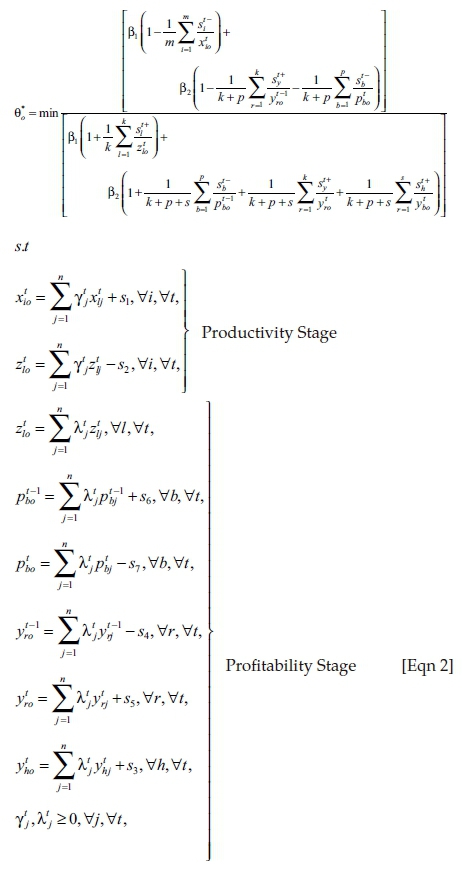
Therefore,  are slack parameters or variables of the model representing the shortfalls: input excess, intermediate measure shortfall, undesirable carried-over factor excess, and output. β1 and β2 are the corresponding weights of the productivity and profitability stages, respectively, of the network DEA model.
In order to measure bank efficiency broadly over multiple time periods, Stage 1 (productivity stage) and Stage 2 (profitability stage) efficiency can be attained simultaneously. The overall efficiency programme can be computed as:
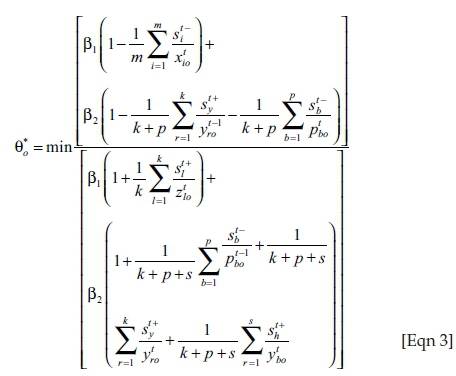
The productivity and profitability stages' efficiency can be defined as  and
and  , respectively:
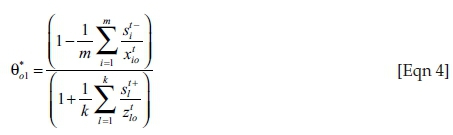
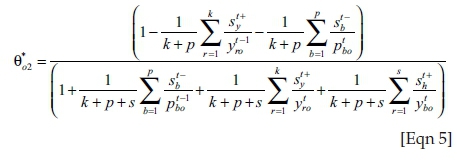
In models (4) and (5) above, all the variables on the right side measure the optimal values of overall efficiency. The overall efficiency  can be obtained by model (3). The productivity stage denoted by
  and profitability stage represented by
  can be obtained by models (4) and (5), respectively. In model (4),
  has an interval ranging from (0, 1). When
  (meaning all slacks are 0), the estimated bank is overall efficient; the opposite implies the bank is inefficient. Likewise, when
  , and
, and  the evaluated bank can be considered as efficient in the overall, for both Stages 1 and 2.
An application to efficiency estimates of commercial banks in Ghana
Data used
In recent times, the Ghanaian banking system has undergone significant transformations. More specifically, a lot of foreign banks emerged in Ghana. This study covers a total of 27 main commercial banks in Ghana during the period of 2009-2014, all of which are rather similar in terms of the services they provide. The dataset is based on the data from the Bank of Ghana, the unique annual financial reports of the individual banks and the annual Ghana Banking Survey.
The choice of variables is a focal issue for any DEA model. This is because, in practice, a bank uses a lot of multiple inputs to generate income in the form of profits. For analysis of banking efficiency, Ariff and Luc (2008) and Chang et al. (2012) used labour and physical capital as inputs, whereas other earning assets (i.e., investments) and total loans were used as outputs. The other earning assets can be disaggregated into short- and long-term investments (Luo & Yao 2010). Non-interest income and interest income can also be included as outputs (Fung & Leung 2008; Yao, Han & Feng 2008b).
Following earlier literature and data availability in Ghana, we define the following variable for the dynamic network DEA model. In the production stage, personnel and interest expenses should be used as the inputs, while deposits are the only output. In the profitability stage, we treat bank deposits from the production stage as input, and loans, interest and non-interest incomes are the desirable outputs, while NPLs are utilised as undesirable outputs.
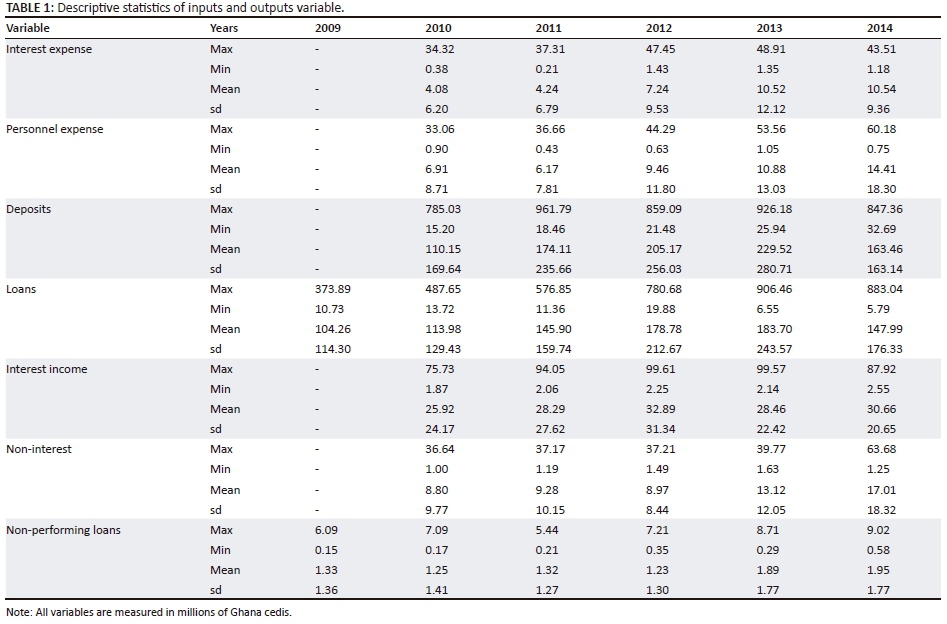
Additionally, loans and NPLs are used as carry-over factors in two time series production periods. In this article, we argue that some of the NPLs produced in the profitable stage of the previous year can be collectible in the current year to increase the bank's assets. The selections of these inputs or outputs are based on the profit orientation approach, with the cost elements (interest and personnel expenses) as inputs and the revenue elements, such as interest and non-interest income, as output. This selection has been used extensively in bank efficiency studies in the literature (see Ataullah & Le 2006; Drake, Hall & Simper 2006; Pasiouras 2008; Zha et al. 2016). Deposit is always adopted as a linkage factor between the two stages in banking efficiency studies (Fukuyama & Weber 2013) (Table 1).
The average numbers of personnel expenses have kept increasing for all banks throughout the entire study period. As one can note, an average NPL is a great challenge for commercial banks in Ghana. However, deposits and other variables varied with time.
Results
First, we computed the slack-based (global) overall efficiency q* for each bank according to equation (3) and decomposed it into Stage 1 efficiency  for productivity and Stage 2 efficiency
  for profitability, as defined by equations (4) and (5), respectively.
The results for the overall efficiency and its corresponding decompositions are presented in Tables 2-4: the mean efficiency scores of each of the overall efficiencies E0 and the sub-stage efficiency scores. The key message here is that the average efficiency remained rather stable for the whole research period. As these scores are relative to the contemporaneous frontiers, one can conclude that banks remained similarly heterogeneous in terms of their performance (efficiency). The average efficiency for the profitability stage  showed an increasing trend and exceeded that for the deposit generation stage
  . This finding suggests that there is a significant gap between productivity and profitability stages in the Ghanaian banking system. Using the bank-specific results, we identified banks that are either highly or fully efficient in Stage 2. This can help to identify and spread best practices within the Ghanaian banking sector. The decline in bank efficiency in Stage 1 can mainly be attributed to dynamics in interest rates in Ghana, which is one of the most important determinants of efficiency.
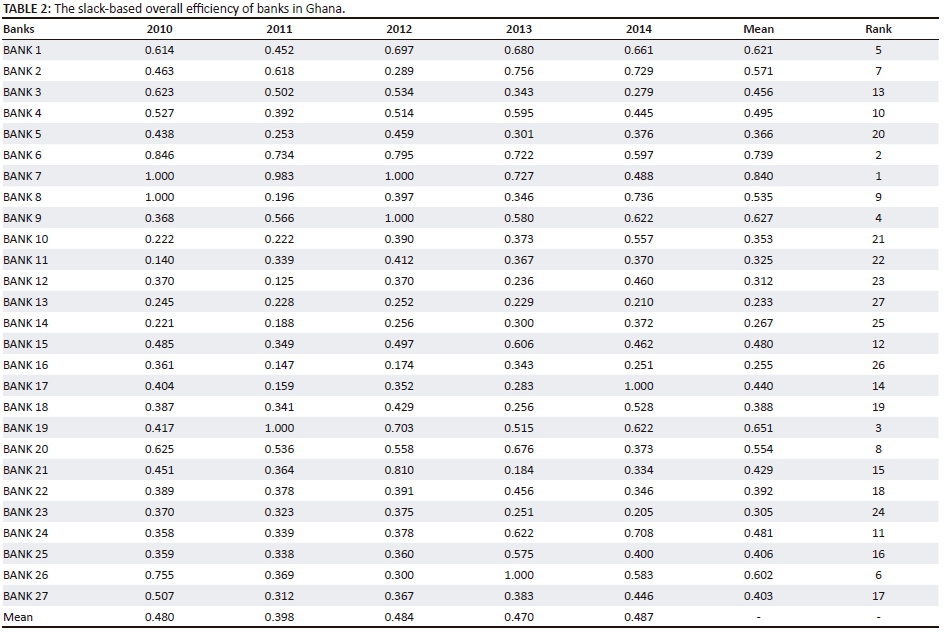
Overall efficiency estimates
In Table 2, we can observe that for the financial year 2009-2010, only two banks (BANK 7 and BANK 8) were estimated to be efficient, and the rest of the banks were rated inefficient. However, during the same year under investigation, the following banks performed slightly better: BANK 1 (0.614); BANK 3 (0.623); BANK 6 (0.846); BANK 20 (0.625); and BANK 26 (0.755). Only a single bank (BANK 19) was computed to be efficient during the financial year 2010-2011, performance of BANK 7 (0.983) was relatively encouraging, and many banks were essentially computed as inefficient. The mean efficiency of all the banks year by year showed a fluctuation phenomenon during the entire study period: in 2010, the average yearly efficiency for the banks was 0.480, followed by 0.398 for 2011, 0.484 for 2012, 0.470 for 2013, and 0.487 for 2014. The average efficiency of the Ghanaian banking industry during 2010-2014 does not show an observable change of trend like that in Alhassan et al.'s study (2016). We calculate the overall efficiency together with the efficiency of each sub-stage for 27 commercial banks in Ghana by using our newly-presented two-stage dynamic DEA model.
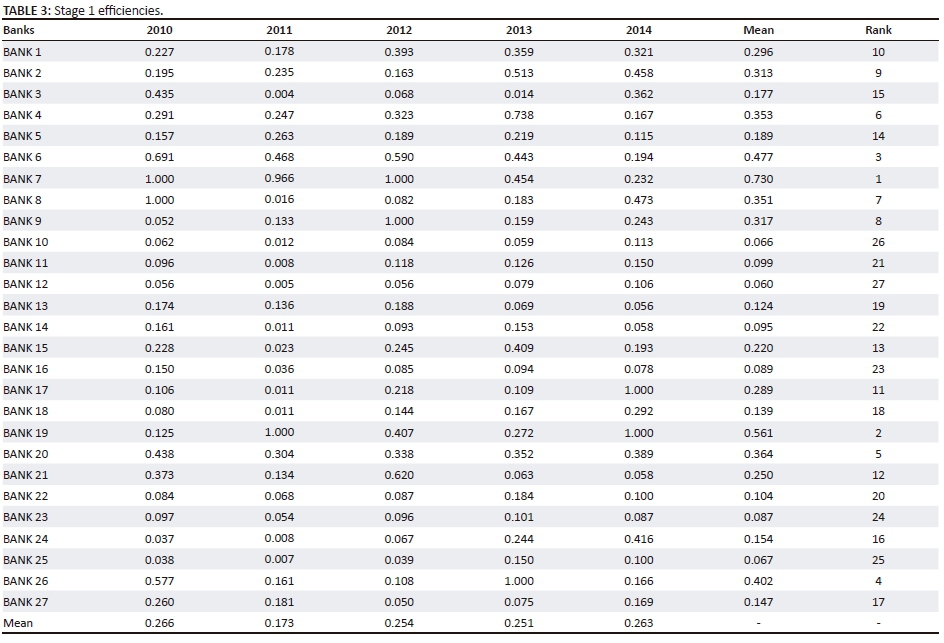
Stage 1 efficiency estimates
From the results shown in Table 3, BANK 7 and BANK 8 were estimated to be efficient in 2010; in 2011, only BANK 19 was efficient; in 2012, BANK 7 was measured efficient; BANK 26 was efficient in 2013; and BANK 17 and BANK 19 were rated efficient in 2014. In the terms of mean efficiency scores across the entire study, one can see the fluctuation in the performance values over the years: in 2010, all of the banks had an efficiency value of 0.266, and this value fluctuated to 0.173 but then slightly increased to 0.254 in 2012; there was also an increase from 0.251 in 2013 to 0.263 in 2014. For the rank test, BANK 7 was ranked as the most efficient bank, followed by BANK 19 in second place. In this productivity stage, most banks (if not all) performed very poorly, and this has contributed significantly to the overall performance of banks in Ghana. We therefore suggest that bank efficiency improvement policy should be geared towards this sub-stage.
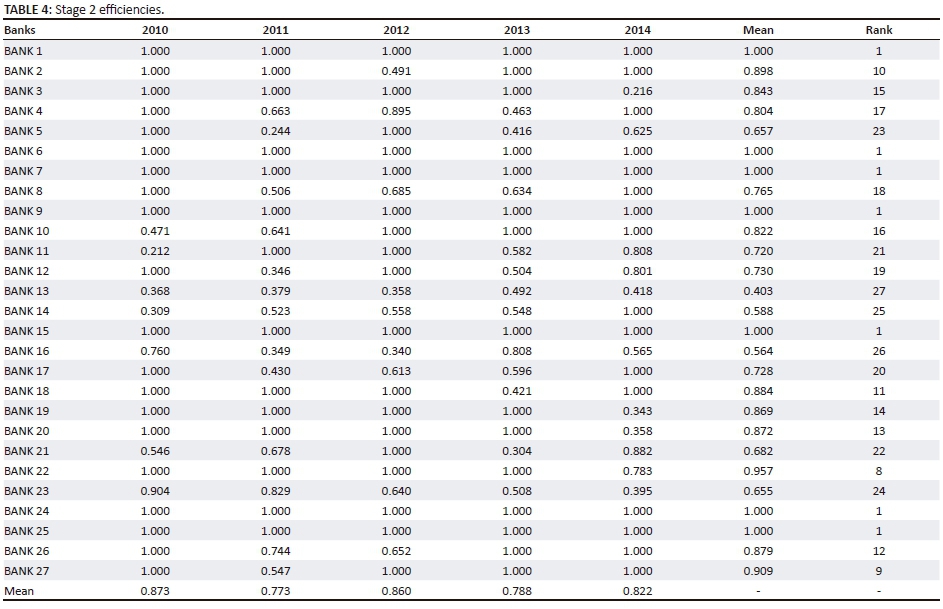
Stage 2 efficiency estimates
Table 4 shows that mean efficiency of this stage realised more satisfactory results for banks operating in Ghana. In 2010, the efficiency score was 0.873, but decreased to 0.773 in 2011. However, this increased to 0.860 in 2012, dropped to 0.788 in 2013, and then increased marginally to 0.822 in 2014. We can observe most banks' overall improvement in the efficiency scores. In 2010, only six banks were inefficient in this stage, but the rest were efficient. In 2011, 13 banks (more than double the previous year) were inefficient. Nine banks were inefficient in 2012, and 11 in both 2013 and 2014. In general, this stage's efficiency values are much higher than the Stage 1 efficiency values.
Relationship between the overall and Stage 1 and Stage 2 efficiency estimates
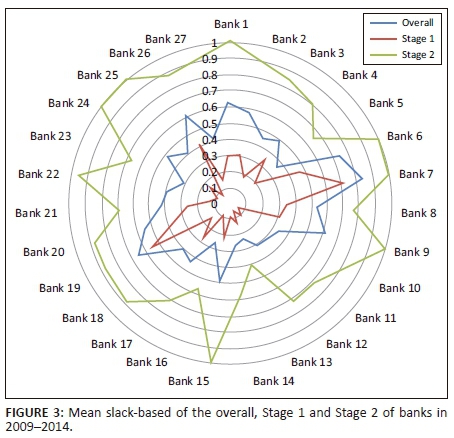
We computed the yearly averages of all the banks under study, as well as the individual banks' means for the whole study period. Figure 2 gives an illustration of the efficiency difference of the models used in this study.
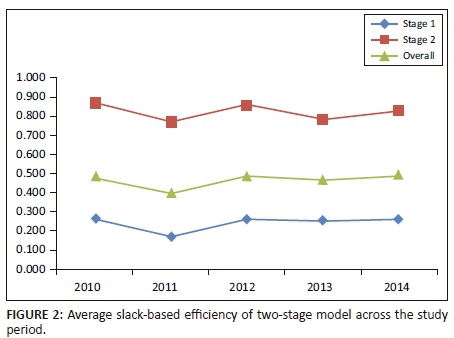
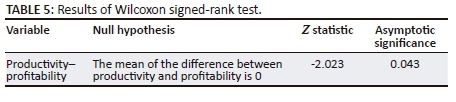
From Figure 2, we can see that most banks had a lower efficiency value in the productivity stage (Stage 1) than in the profitability stage (Stage 2). This has greatly affected the overall efficiency values of each bank. In order for us to investigate the relationship between the overall value and that of Stages 1 and 2, we paid attention to the ranks of the mean efficiency values for each bank. It can be said that most banks have similar ranks in the three types of efficiency discussed above. The two-paired-sample non-parametric Wilcoxon signed-rank test was performed to ascertain whether the differences in efficiency gaps between Stage 1 and Stage 2 are significant (Table 5) The results (z = −2.02, p = 0.043) confirmed that the commercial banks in Ghana have more potential in the generation of profits. The correlation coefficients for the overall and the two-stage efficiency are 0.7112 and 0.9072, respectively. This implies that the overall performance of these banks largely depends on the systematic performance of the two stages. In detail, the mean efficiencies of the overall and the two stages for each bank are shown in Figure 3, and this can greatly help in measuring the real causes of banks' inefficiency in Ghana. In Figure 3, the mean efficiency for Stage 1 is much lower than the overall, and the Stage 2 values are comparatively higher. We can therefore conclude that the inefficiency of banks currently operating in Ghana is mainly caused by the performance of the production stage (Stage 1) efficiencies. Our proposed model has very important implications for bank managers, in that it can help managers to be able to determine the sources of inefficiencies within the banking industry in Ghana. In addition, managers can improve the overall performance of the industry by targeting improvement strategies towards the two sub-processes; in this case, Stage 1 is of particular interest.
Conclusion
In this article, we have developed a novel two-stage DEA model for the effective measurement of bank efficiency on the basis of dynamic SBM network DEA, by modelling the bank efficiency in Ghana, taking into account both desirable and undesirable outputs. Different from the existing DEA approaches, this proposed approach allows for the evaluation of bank efficiency in a time period of multiple years in which the NPLs produced in previous years can be collectible in the current year (t), resulting in additional revenue for the banks. By using this newly-presented model, we find that the 27 main commercial banks in Ghana are far from efficient. Further, we compute the efficiency of two production stages, in order to provide more information for the inefficient banks to improve their performance. We find that, for all the banks, the efficiency score in the second stage is much higher than that of the first stage. That means more attention should be paid to the first stage of production in order to increase the banks' efficiency.
In order to mitigate the efficiency gap between the productivity and profitability sub-stages, both bank managers and policymakers must take strategic and innovative measures to improve both stages in order to ensure bank efficiency in Ghana. Both adjustments on inputs and outputs are important for Ghanaian banks: train bank staff to decrease the human input per output; improve deposit generation to increase desirable outputs; and decrease NPLs via strengthened internal control of loan provision and improved loan quality to decrease undesirable outputs.
In a further study, we will explore the details more deeply, to find out the difference between the contribution of NPLs and loans to the next time period. Based on the analysis, we should use the weights given to them for measuring the efficiency of each bank in order to illustrate the difference between NPLs and loans. With a longer time period, one could measure the effect of NPLs and loans for more than two years.
Acknowledgements
This research is financially supported by the National Natural Science Foundation of China (No. 71701059, 71771126, 71301080).
Competing interests
The authors declare that they have no financial or personal relationship(s) that may have inappropriately influenced them in writing this article.
Authors' contributions
D.H. was the project leader, Z.Z. was responsible for project design and data calculation. Z.Z. and N.A. performed most of the experiments. N.A. wrote the manuscript.
References
Aboagye, A.Q.Q., 2012, 'Bank concentration and economic costs of deposit mobilization and credit extension in Ghana,' Journal of Developing Areas 46(2), 351-370. [ Links ]
Aboagye, Q.Q.A., Akoena, S.K., Antwi-Asare, T.O. & Gockel, A.F., 2008, 'Explaining the market power of Ghanaian banks', South African Journal of Economics 76(4), 569-585. https://doi.org/10.1111/j.1813-6982.2008.00221.x [ Links ]
Akther, S., Fukuyama, H. & Weber, W.L., 2013, 'Estimating two-stage network slacks-based inefficiency: An application to Bangladesh banking', Omega 41(1), 88-96. https://doi.org/10.1016/j.omega.2011.02.009 [ Links ]
Alhassan, A.L., Kyereboah-Coleman, A. & Andoh, C., 2014, 'Asset quality in a crisis period: An empirical examination of Ghanaian banks', Review of Development Finance 4(1), 50-62. https://doi.org/10.1016/j.rdf.2014.03.001 [ Links ]
Alhassan, A.L. & Biekpe, N., 2016, 'Explaining bank productivity in Ghana', Managerial & Decision Economics 37(8), 563-573. https://doi.org/10.1002/mde.2748 [ Links ]
Alhassan, A.L. & Ohene-Asare, K., 2015, 'Competition and bank efficiency in emerging markets: Empirical evidence from Ghana', African Journal of Economic and Management Studies 7(2), 268-288. https://doi.org/10.1108/AJEMS-01-2014-0007 [ Links ]
Alhassan, A.L. & Tetteh, M.L., 2017, 'Non-interest income and bank efficiency in Ghana: A two-stage dea bootstrapping approach', Journal of African Business 18(1), 124-142. https://doi.org/10.1080/15228916.2016.1227668 [ Links ]
Alhassan, A.L., Tetteh, M.L. & Brobbey, F.O., 2016, 'Market power, efficiency and bank profitability: Evidence from Ghana', Economic Change & Restructuring 49(1), 71-93. https://doi.org/10.1007/s10644-015-9174-6 [ Links ]
Amado, C.A.F., Santos, S.P. & Marques, P.M., 2012, 'Integrating the data envelopment analysis and the balanced scorecard approaches for enhanced performance assessment', Omega 40(3), 390-403. https://doi.org/10.1016/j.omega.2011.06.006 [ Links ]
Ariff, M. & Luc, C., 2008, 'Cost and profit efficiency of Chinese banks: A non-parametric analysis', China Economic Review 19(2), 260-273. https://doi.org/10.1016/j.chieco.2007.04.001 [ Links ]
Asmild, M. & Matthews, K., 2012, 'Multi-directional efficiency analysis of efficiency patterns in Chinese banks 1997-2008', European Journal of Operational Research 219(2), 434-441. https://doi.org/10.1016/j.ejor.2012.01.001 [ Links ]
Assaf, A.A., Matousek, R. & Tsionas, E.G., 2013, 'Turkish bank efficiency: Bayesian estimation with undesirable outputs', Journal of Banking & Finance 37(2), 506-517. https://doi.org/10.1016/j.jbankfin.2012.09.009 [ Links ]
Ataullah, A. & Le, H., 2006, 'Economic reforms and bank efficiency in developing countries: The case of the Indian banking industry', Applied Financial Economics 16(9), 653-663. https://doi.org/10.1080/09603100500407440 [ Links ]
Avkiran, N.K. & Zhu, Y., 2016, 'Pitching DEA against SFA in the context of Chinese domestic versus foreign banks', in S.-N. Hwang, H.-S. Lee & J. Zhu (eds.), Handbook of operations analytics using data envelopment analysis, pp. 113-143, Springer US, Boston, MA. [ Links ]
Banker, R.D., Charnes, A. & Cooper, W.W., 1984, 'Some models for estimating technical and scale inefficiencies in data envelopment analysis', Management Science 30(9), 1078-1092. https://doi.org/10.1287/mnsc.30.9.1078 [ Links ]
Bawumia, M., 2010, Monetary policy and financial sector reform in Africa: Ghana's experience, Lightning Source, La Vergne, TN. [ Links ]
Berger, A.N. & Humphrey, D.B., 1991, 'The dominance of inefficiencies over scale and product mix economies in banking', Journal of Monetary Economics 28(1), 117-148. https://doi.org/10.1016/0304-3932(91)90027-L [ Links ]
Camanho, A.S. & Dyson, R.G., 1999, 'Efficiency, size, benchmarks and targets for bank branches: An application of data envelopment analysis', Journal of the Operational Research Society 50(9), 903-915. https://doi.org/10.1057/palgrave.jors.2600792 [ Links ]
Chang, T., Hu, J., Chou, R.Y. & Sun, L., 2012, 'The sources of bank productivity growth in China during 2002-2009: A disaggregation view', Journal of Banking & Finance 36(7), 1997-2006. https://doi.org/10.1016/j.jbankfin.2012.03.003 [ Links ]
Charnes, A., Cooper, W.W. & Rhodes, E., 1978, 'Measuring the efficiency of decision making units', European Journal of Operational Research 2(6), 429-444. https://doi.org/10.1016/0377-2217(78)90138-8 [ Links ]
Chen, K., 2012, 'Incorporating risk input into the analysis of bank productivity: Application to the Taiwanese banking industry', Journal of Banking & Finance 36(7), 1911-1927. https://doi.org/10.1016/j.jbankfin.2012.02.012 [ Links ]
Chen, Y., Cook, W.D., Li, N. & Zhu, J., 2009, 'Additive efficiency decomposition in two-stage DEA', European Journal of Operational Research 196(3), 1170-1176. https://doi.org/10.1016/j.ejor.2008.05.011 [ Links ]
Cook, W.D. & Hababou, M., 2001, 'Sales performance measurement in bank branches', Omega 29(4), 299-307. https://doi.org/10.1016/S0305-0483(01)00025-1 [ Links ]
Cook, W.D.& Seiford, L.M., 2009, 'Data envelopment analysis (DEA)-Thirty years on', European Journal of Operational Research 192(1), 1-17. https://doi.org/10.1016/j.ejor.2008.01.032 [ Links ]
Drake, L., Hall, M.J.B. & Simper, R., 2006, 'The impact of macroeconomic and regulatory factors on bank efficiency: A non-parametric analysis of Hong Kong's banking system', Journal of Banking & Finance 30(5), 1443-1466. https://doi.org/10.1016/j.jbankfin.2005.03.022 [ Links ]
Färe, R. & Grosskopf, S., 2004, 'Modeling undesirable factors in efficiency evaluation: Comment', European Journal of Operational Research 157(1), 242-245. https://doi.org/10.1016/S0377-2217(03)00191-7 [ Links ]
Farrell, M.J., 1957, 'The measurement of productive efficiency', Journal of the Royal Statistical Society. Series A (General) 120(3), 253-290. https://doi.org/10.2307/2343100 [ Links ]
Fujii, H., Managi, S. & Matousek, R., 2014, 'Indian bank efficiency and productivity changes with undesirable outputs: A disaggregated approach', Journal of Banking & Finance 38, 41-50. https://doi.org/10.1016/j.jbankfin.2013.09.022 [ Links ]
Fukuyama, H. & Matousek, R., 2011, 'Efficiency of Turkish banking: Two-stage network system. Variable returns to scale model', Journal of International Financial Markets, Institutions and Money 21(1), 75-91. https://doi.org/10.1016/j.intfin.2010.08.004 [ Links ]
Fukuyama, H. & Weber, W.L., 2010, 'A slacks-based inefficiency measure for a two-stage system with bad outputs', Omega 38(5), 398-409. https://doi.org/10.1016/j.omega.2009.10.006 [ Links ]
Fukuyama, H. & Weber, W.L., 2013, 'A dynamic network DEA model with an application to Japanese Shinkin banks', in F. Pasiouras (eds.), Efficiency and productivity growth: Modelling in the financial services industry, pp. 193-213, Wiley, Fukuoka & Cape Girardeau. [ Links ]
Fung, M.K. & Leung, M.K., 2008, 'X-efficiency and convergence of productivity among the national commercial banks in China', paper presented at the Proceedings of the 19th China Economic Association (UK) Annual Conference, April 01-02, 2008, University of Cambridge. [ Links ]
Hsiao, H., Chang, H., Cianci, A.M. & Huang, L., 2010, 'First financial restructuring and operating efficiency: Evidence from Taiwanese commercial banks', Journal of Banking & Finance 34(7), 1461-1471. https://doi.org/10.1016/j.jbankfin.2010.01.013 [ Links ]
Hsu, F. & Hsueh, C., 2009, 'Measuring relative efficiency of government-sponsored R&D projects: A three-stage approach', Evaluation and Program Planning 32(2), 178-186. https://doi.org/10.1016/j.evalprogplan.2008.10.005 [ Links ]
Kao, C., 2009, 'Efficiency decomposition in network data envelopment analysis: A relational model', European Journal of Operational Research 192(3), 949-962. https://doi.org/10.1016/j.ejor.2007.10.008 [ Links ]
Kao, C. & Hwang, S., 2011, 'Decomposition of technical and scale efficiencies in two-stage production systems', European Journal of Operational Research 211(3), 515-519. https://doi.org/10.1016/j.ejor.2011.01.010 [ Links ]
Kao, C. & Liu, S., 2014, 'Multi-period efficiency measurement in data envelopment analysis: The case of Taiwanese commercial banks', Omega 47, 90-98. https://doi.org/10.1016/j.omega.2013.09.001 [ Links ]
Liu, J.S., Lu, L.Y.Y., Lu, W.& Lin, B.J.Y., 2013, 'Data envelopment analysis 1978-2010: A citation-based literature survey', Omega 41(1), 3-15. https://doi.org/10.1016/j.omega.2010.12.006 [ Links ]
Lo, S. & Lu, W., 2009, 'An integrated performance evaluation of financial holding companies in Taiwan', European Journal of Operational Research 198(1), 341-350. https://doi.org/10.1016/j.ejor.2008.09.006 [ Links ]
Luo, D. & Yao, S., 2010, 'World financial crisis and the rise of Chinese commercial banks: An efficiency analysis using DEA', Applied Financial Economics 20(19), 1515-1530. https://doi.org/10.1080/09603107.2010.508717 [ Links ]
Luo, X., 2003, 'Evaluating the profitability and marketability efficiency of large banks: An application of data envelopment analysis', Journal of Business Research 56(8), 627-635. https://doi.org/10.1016/S0148-2963(01)00293-4 [ Links ]
McAllister, P.H. & McManus, D., 1993, 'Special issue on the efficiency of financial institutions resolving the scale efficiency puzzle in banking', Journal of Banking & Finance 17(2), 389-405. https://doi.org/10.1016/0378-4266(93)90039-G [ Links ]
Meepadung, N., Tang, J.C.S. & Khang, D.B., 2009, 'IT-based banking services: Evaluating operating and profit efficiency at bank branches', The Journal of High Technology Management Research 20(2), 145-152. https://doi.org/10.1016/j.hitech.2009.09.003 [ Links ]
Paradi, J.C., Rouatt, S. & Zhu, H., 2011, 'Two-stage evaluation of bank branch efficiency using data envelopment analysis', Omega 39(1), 99-109. https://doi.org/10.1016/j.omega.2010.04.002 [ Links ]
Paradi, J.C. & Zhu, H., 2013, 'A survey on bank branch efficiency and performance research with data envelopment analysis', Omega 41(1), 61-79. https://doi.org/10.1016/j.omega.2011.08.010 [ Links ]
Pasiouras, F., 2008, 'International evidence on the impact of regulations and supervision on banks' technical efficiency: An application of two-stage data envelopment analysis', Review of Quantitative Finance and Accounting 30(2), 187-223. https://doi.org/10.1007/s11156-007-0046-7 [ Links ]
Premachandra, I.M., Zhu, J., Watson, J. & Galagedera, D.U.A., 2012, 'Best-performing US mutual fund families from 1993 to 2008: Evidence from a novel two-stage DEA model for efficiency decomposition', Journal of Banking & Finance 36(12), 3302-3317. https://doi.org/10.1016/j.jbankfin.2012.07.018 [ Links ]
Ruggiero, J., 2007, 'A comparison of DEA and the stochastic frontier model using panel data', International Transactions in Operational Research 14(3), 259-266. https://doi.org/10.1111/j.1475-3995.2007.00585.x [ Links ]
Saka, A.N.A., Aboagye, A.Q.Q. & Gemegah, A., 2012, 'Technical efficiency of the Ghanaian banking industry and the effects of the entry of foreign banks', Journal of African Business 13(3), 232-243. https://doi.org/10.1080/15228916.2012.727755 [ Links ]
Sanyal, P. & Shankar, R., 2011, 'Ownership, competition, and bank productivity: An analysis of Indian banking in the post-reform period', International Review of Economics & Finance 20(2), 225-247. https://doi.org/10.1016/j.iref.2010.05.002 [ Links ]
Seiford, L.M. & Zhu, J., 1999, 'Profitability and marketability of the top 55 U.S. Commercial Banks', Management Science 45(9), 1270-1288. https://doi.org/10.1287/mnsc.45.9.1270 [ Links ]
Sherman, H.D. & Gold, F., 1985, 'Bank branch operating efficiency: Evaluation with data envelopment analysis', Journal of Banking & Finance 9(2), 297-315. https://doi.org/10.1016/0378-4266(85)90025-1 [ Links ]
Tone, K. & Tsutsui, M., 2010, 'Dynamic DEA: A slacks-based measure approach', Omega 38(3), 145-156. https://doi.org/10.1016/j.omega.2009.07.003 [ Links ]
Tone, K. & Tsutsui, M., 2014, 'Dynamic DEA with network structure: A slacks-based measure approach', Omega 42(1), 124-131. https://doi.org/10.1016/j.omega.2013.04.002 [ Links ]
Tsang, S., Chen, Y., Lu, Y. & Chiu, C., 2014, 'Assessing productivity in the presence of negative data and undesirable outputs', The Service Industries Journal 34(2), 162-174. https://doi.org/10.1080/02642069.2013.763932 [ Links ]
Wang, C.H., Gopal, R.D. & Zionts, S., 1997, 'Use of data envelopment analysis in assessing information technology impact on firm performance', Annals of Operations Research 73, 191-213. https://doi.org/10.1023/A:1018977111455 [ Links ]
Wang, K., Huang, W., Wu, J. & Liu, Y., 2014, 'Efficiency measures of the Chinese commercial banking system using an additive two-stage DEA', Omega 44, 5-20. https://doi.org/10.1016/j.omega.2013.09.005 [ Links ]
Yang, C. & Liu, H., 2012, 'Managerial efficiency in Taiwan bank branches: A network DEA', Economic Modelling 29(2), 450-461. https://doi.org/10.1016/j.econmod.2011.12.004 [ Links ]
Yao, S., Han, Z. & Feng, G., 2008a, 'Ownership reform, foreign competition and efficiency of Chinese Commercial Banks: A non-parametric approach', World Economy 31(10), 1310-1326. https://doi.org/10.1111/j.1467-9701.2008.01130.x [ Links ]
Yao, S., Han, Z. & Feng, G., 2008b, 'Ownership reform, foreign competition and efficiency of Chinese Commercial Banks: A non-parametric approach', The World Economy 31(10), 1310-1326. https://doi.org/10.1111/j.1467-9701.2008.01130.x [ Links ]
Yeh, Q., 1996, 'The application of data envelopment analysis in conjunction with financial ratios for bank performance evaluation', Journal of the Operational Research Society 47(8), 980-988. https://doi.org/10.1057/jors.1996.125 [ Links ]
Zha, Y., Liang, N., Wu, M. & Bian, Y., 2016, 'Efficiency evaluation of banks in China: A dynamic two-stage slacks-based measure approach', Omega 60, 60-72. https://doi.org/10.1016/j.omega.2014.12.008 [ Links ]
Zhu, J., 2000, 'Multi-factor performance measure model with an application to Fortune 500 companies', European Journal of Operational Research 123(1), 105-124. https://doi.org/10.1016/S0377-2217(99)00096-X [ Links ]
 Correspondence:
Nelson Amowine
amowinenelson@yahoo.com
Received: 30 Nov. 2016
Accepted: 17 Aug. 2017
Published: 09 Apr. 2018

