


Services on Demand
Article
 English (pdf)
 Article in xml format
 Article references
Indicators

Related links
-
 Cited by Google
 -
 Similars in Google
Share

 Permalink
South African Journal of Economic and Management Sciences
On-line version ISSN 2222-3436
Print version ISSN 1015-8812
S. Afr. j. econ. manag. sci. vol.21 n.1 Pretoria 2018
http://dx.doi.org/10.4102/sajems.v21i1.1658
ORIGINAL RESEARCH
Private hospital expenditure and relation to utilisation: Observations from the data
Marine ErasmusI, II; Helen KeanI
IEconex, Stellenbosch, South Africa
IIDepartment of Economics, Stellenbosch University, South Africa
ABSTRACT
BACKGROUND: This study contributes to the detailed understanding of the drivers of medical scheme expenditure on private hospitals in South Africa over 2006-2014. This is important in the context of various regulatory reforms that are being considered at present.
AIM: The aim is to provide an updated analysis and description of the drivers of medical scheme expenditure on private hospitals in South Africa.
SETTING: Private hospital market, South Africa.
METHODS: Data from the three largest private hospital groups - which account for approximately 70% of the South African private hospital market share - are collected, aggregated and analysed. This study uses targeted descriptive and exploratory analyses, relying on a residual approach to hospital expenditure.
RESULTS: It is found that over time medical scheme beneficiaries, on average, are being admitted to private hospitals more frequently, as well as staying in hospital for longer during each admission. The data also indicate that over time older people are being admitted to hospital more often.
CONCLUSION: This study's findings contradict previous assertions that it is only prices driving increased medical scheme expenditure on private hospitals.
Introduction
This study starts by showing that medical schemes in South Africa spend the largest portion of health funds on private hospitalisation. This is in line with expectations given the specific regulatory environment and benefit design. However, expenditure on private hospital care has exhibited a steep increase over the last decade and a half. This article critically analyses the drivers of the increase in medical scheme expenditure on private hospitals.
In earlier years, these expenditure increases were, without due consideration, attributed to pricing increases in hospital services. More recently, the facts have been better informed by research into detailed utilisation trends that are representative of the medical scheme population. The literature review shows that these studies found utilisation increases, rather than hospital price and/or tariff increases, to drive the largest part of the increase in expenditure above consumer price inflation (CPI).
This study contributes by collecting and aggregating extensive and detailed confidential admission data from the three largest South African private hospital groups (Netcare, Mediclinic and Life Healthcare, with the data referred to as 'private hospital data') - which account for approximately 70% of the private hospital (bed) market share (Econex 2014a) - and analysing admission and expenditure trends over 2006-2014.1 The aim is to contribute to the existing research by providing an updated analysis of private hospital utilisation2 trends and their impact on expenditure. In order to do so, expenditure on private hospitals is firstly decomposed to account for the relevant medical scheme beneficiary growth as well as headline inflation. Having accounted for these factors, the residual increase in expenditure is the focus of this study. This is analysed alongside utilisation trends at the three private hospital groups - including admission rates and patient days; both at aggregated, and age levels. The main aim of the study is therefore to critically analyse the drivers of medical scheme expenditure on private hospitals by analysing how these expenditure increases adjust after accounting for factors that are evident in the data. The section 'Context and focus: medical scheme expenditure on private hospitals' provides brief context regarding medical scheme expenditure on private hospitals by discussing the relevant literature or data. The specific research aims and approaches are also included therein. The analysis is then divided into two sections: first presenting the results for aggregate utilisation trends ('Utilisation rates in aggregate' section) and then by age band ('Utilisation rates by age group' section). In the section 'Discussion: other drivers of medical scheme expenditure on private hospitals', other drivers of medical scheme expenditure on private hospitals are discussed, before concluding the study in the last section.
Context and focus: Medical scheme expenditure on private hospitals
This section considers the trends in medical scheme expenditure on private hospitals from 2000 to 2014. The source of the data analysed in this section is the Council for Medical Schemes (CMS) annual reports, which record various categories on which medical schemes spend their funds. It is important to note that these expenditure increases are often reported (even in the popular press) and that the conclusion that automatically follows is that this is driven by private hospital price inflation. This section therefore commences with these data and increases, before unpacking these trends into their constituent parts, in order to understand the real drivers of this expenditure.
Nominal expenditure trends
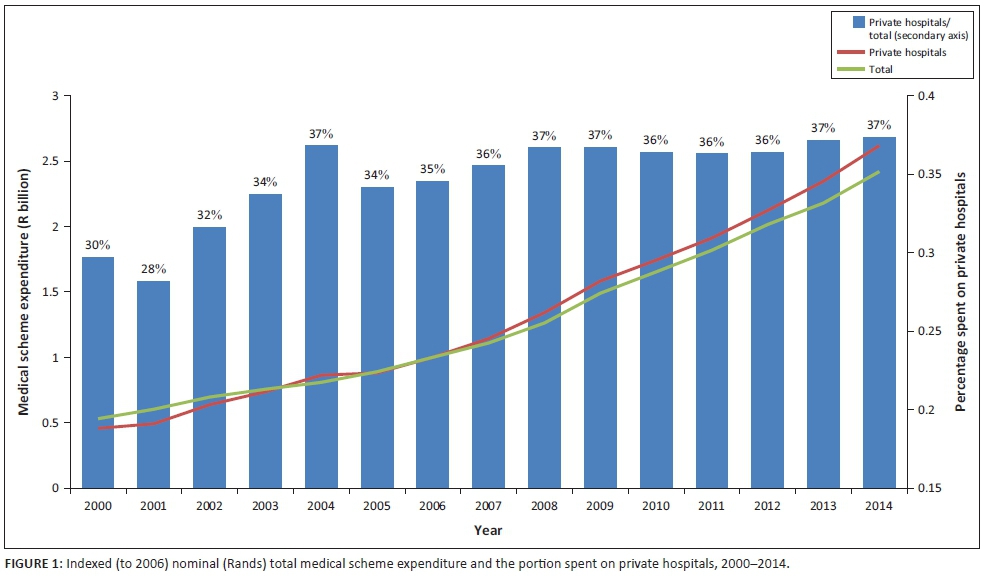
In nominal and aggregated terms, medical scheme expenditure on private hospitals is high and increasing. In order to better understand the absolute and relative increases over time, these nominal values are indexed to 2006 in Figure 1.3 The green trend line shows total medical scheme expenditure over time, the red line indicates the amount thereof spent on private hospitals and the underlying bars show the latter as a function of the prior. Expenditure on private hospitals has accounted for between 28% and 37% of total annual medical scheme expenditure over the time period analysed.
Figure 1 indicates that in 2014, medical scheme, expenditure on private hospitals (R 46.4 billion), in nominal and aggregate terms, had increased significantly from its 2000 value (R 8.1 billion) and more than doubled from 2006 (R 17.7 billion) to 2014. Similarly, total nominal medical scheme expenditure increased from R 27.2 billion in 2000, to R 51.3 billion in 2006 and R 124.1 billion in 2014. The gradient (year-on-year increases or growth) in expenditure on private hospitals was closely related to the gradient for total medical scheme expenditure over the entire period, but particularly so between 2006 and 2014.
Therefore, this figure indicates that while expenditure on private hospitals has increased as a portion of total medical scheme expenditure (from 30% in 2000 to 35% in 2006 and 37% in 2014), the trend between 2006 and 2014 has been in line with increases in total medical scheme expenditure. The longer term landscape is relevant, but the explanatory data in this study are restricted to the period from 2006 onwards.
Real hospital expenditure
To further analyse increasing medical scheme expenditure on private hospitals - specifically its relation to price and volume of care - the data are decomposed to account for the growth in medical scheme beneficiaries, as well as headline inflation.
Beneficiary numbers have grown by almost 2 million over the period 2000-2014, from approximately 7 million to more than 8.81 million. Careful consideration of the data indicates that beneficiary growth was flat in the earlier years with growth significantly increasing after 2006. This is mainly because of the introduction of the Government Employees Medical Scheme in 2006, as well as growth in formal employment. Growth in more recent years is positive, but exhibiting a declining rate, in line with macroeconomic realities and specifically low growth in formal employment.
In addition to adjusting the expenditure of medical schemes on private hospitals to account for the increase in beneficiary numbers (i.e. to show the values per average beneficiary per annum [PABPA]), the data must also be adjusted by headline inflation (CPI). It must be highlighted that this adjustment - here and throughout the report - is made for headline inflation and not hospital price inflation (as measured and reported on by StatsSA), notwithstanding the well-documented drivers of hospital price inflation ahead of general inflation. (Higher hospital price inflation is driven by the fact that the price of hospital input items, for example, nurse wages, increase at rates higher than the headline CPI basket. This may be because of macro- and microeconomic factors, for example, skills shortage, unionised labour, power supply constraints, basic services, exchange rates, etc.). Information that is of interest to the study may, however, be removed by accounting for hospital price inflation at the outset. In other terms, although the existence of some degree of hospital price inflation is recognised, no control for this is made at the outset so that it can be investigated in the residual of expenditure. It is therefore important to note that the use of headline inflation might exaggerate the role played by price increases, but this conservative approach is preferred.
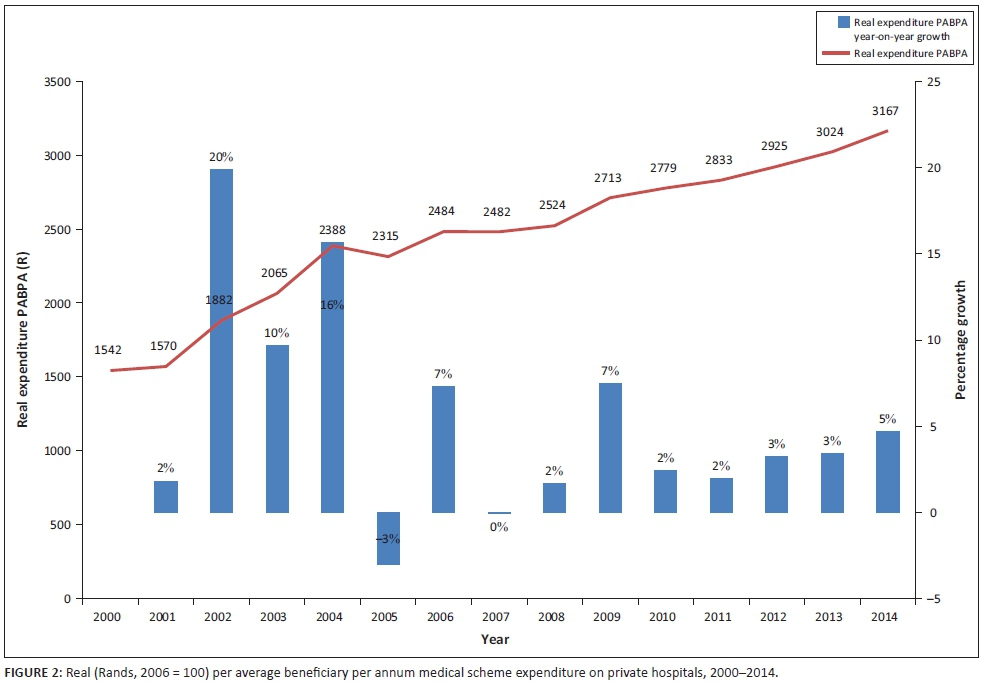
Figure 2 shows the real PABPA expenditure on private hospitals by medical schemes. This shows that there are higher increases in the earlier years (2002-2004), with single-digit growth for the remainder of the period. Although some years exhibit a negative growth rate, the overall trend is a positive increase in real PABPA medical scheme expenditure on private hospitals. It is therefore true that expenditure by medical schemes on private hospitals is increasing, also on a 'per beneficiary' level. In our view, the year-on-year growth rates in the earlier (2001-2004) years may be related to institutional and macroeconomic factors, including the introduction of open enrolment, community rating and prescribed minimum benefits (PMBs)4 packages, as well as hospital input costs at the time and as reflected in exchange rates. Similarly, the year-on-year increase in 2009 may be related to the macroeconomic environment existent at the time and following the global financial crisis (as reflected in exchange rate depreciation). After acknowledging these potential influences, a general upward trend is observed. It is therefore relevant to question what known factors contribute to this.
Literature review
While this research is one of the first contributions (in South Africa) to the academic literature on the phenomenon pointed out above, it has been investigated by a number of stakeholders locally. In 2016, the hospital group Netcare stated that, 'The principle industry role players all appear to be in agreement that inflation and increases in utilisation are some of the primary reasons for the increase in private healthcare expenditure' (Netcare 2016:46). One of these role players is the medical scheme administrator Discovery Health, which analysed the increase in Discovery Health Medical Scheme (DHMS) claims for the period 2008-2013. From this, claims expenditure per life per month were found to increase by an average of 11.3% per annum, of which 6.7% could be attributed to headline inflation. The remaining 4.6% was found to be attributed to increased consumption of all healthcare goods and services (4.2%), and tariffs and prices exceeding inflation (0.4%). Forming part of these claims were the hospital admissions of members, which experienced an increased rate, from 23.9% in 2009 to 24.8% in 2013. This was found to be higher than the 24.55% predicted by demographic factors (Discovery Health 2014:22, 51).
The Hospital Association of South Africa (HASA 2008) also analysed the increase in total private hospital expenditure that can be attributed to utilisation. For the period 2002-2006, they found evidence of higher levels of utilisation in terms of increased volume: the total number of admissions to the same hospitals owned by the three largest hospital groups in South Africa (Life Healthcare, Netcare and Mediclinic) showed an increase of approximately 13% over this period. This was equivalent to an increase of slightly over 3% per annum (HASA 2008:20). Econex (2012) examined a later period and found similar results for inpatient admissions and total number of patient days. The total number of inpatient admissions per 1000 medical scheme beneficiaries to those three hospital groups (with the data adjusted to reflect their share of beds in the market) increased from 244 per 1000 beneficiaries in 2006 to 256 per 1000 beneficiaries in 2010. This amounted to a cumulative increase of 6.2% in the admission rate over the period. Patient days, or beneficiary days in hospital, refer to the cumulative number of days that medical scheme beneficiaries spend in hospitals. Econex's (2012) calculations showed that this increased from 753 per 1000 beneficiaries in 2006 to 847 beneficiaries in 2010, or by 12.5% cumulatively. From this, the average length of stay (ALOS) was calculated, revealing that beneficiaries spent 3.09 days in hospital in 2006 compared to (the 5.9% higher) 3.27 days in 2010.
Globally, increased healthcare costs and their drivers have been analysed under various different frameworks dependent on the context of healthcare in question. A commonly cited framework specific to expenditure on private hospitals is provided by the American Hospital Association and the Lewin Group (2005). This framework attributes a role to utilisation, with this utilisation being driven by inter alia, ageing and burden of disease. Alongside these types of frameworks, various detailed breakdowns of healthcare expenditure, both hospital and other, by private insurers have been documented. Certainly, the most complex and extensive disaggregation of healthcare spending, including that for hospitalisation, is included in the 2016 study by Dieleman et al. This study comprehensively disaggregates US healthcare spending according to condition, age, gender and type of care, thereby eliciting what the main drivers are. In this, utilisation is found as the primary driver of cost, consequently driven by factors most prominently including an increasing burden of disease.
More specific to the South African context, with medical scheme expenditure on private hospitals in question, a gap in the academic literature exists. Despite this, and as mentioned above, various factors have been suggested by industry stakeholders, in line with international frameworks and studies. The growing medical scheme population, increased burden of disease (especially the higher prevalence of beneficiaries with chronic diseases) and the related ageing of the medical scheme population have been argued to worsen the case mix. New and improved technologies have been discussed to lead to an increase in the number of procedures performed in hospitals. The introduction of PMBs and open enrolment to medical schemes with community rating has been shown to increase utilisation by beneficiaries, and the fee-for-service structure is said to incentivise higher utilisation because of its direct relationship between earnings and volume of services (CMS 200838; HASA 2008:21; Life Healthcare 2016:18; McIntyre & Thiede 2007:42).
Supplier-induced demand has also been suggested as a reason for increased hospital utilisation. While there is not as yet a robust study on this phenomenon in the context of South African private hospitals, the literature highlights the technical and context-specific considerations one should have in studying this. Econex (2016) provides a review of this literature. Similarly, moral hazard by those insured is expected to drive up utilisation and consequent expenditure rates. The existence of the latter within healthcare is well established, with the most cited references of this deriving from the RAND Health Insurance Experiment that elicited the phenomenon of increased claims as a result of coverage (Vera-Hernandez 2003). Despite these reasoning, there exists a gap in the academic literature with regard to the drivers of medical scheme spending on private hospitals in South Africa. This study aims to make a first contribution to this gap, with subsequent studies deepening this contribution.
Research aims and approach
The analysis thus far indicates that after adjusting the medical scheme data for volume growth (beneficiary numbers) and inflation, expenditure growth has still been positive overall. This study contributes by further unpacking the data in order to examine which other factors have contributed to these growth rates in medical scheme expenditure on private hospitals.
Factors such as ageing, burden of disease, advances in medical technology and institutional factors are expected to play a role and may interdependently impact on utilisation and expenditure. Against this background, the aim of this study is to provide an updated review of some of these factors at private hospitals in South Africa and their impact on expenditure. In other terms, the aim of the study is to critically analyse the drivers of medical scheme expenditure on private hospitals, by analysing these expenditure increases after accounting for factors that are evident in the data. More specifically, the questions of the study are the following:
-
Has private hospital utilisation per 1000 beneficiaries increased, and how does this relate to expenditure?
-
· Has private hospital utilisation per 1000 beneficiaries, per age band increased, and how does this relate to expenditure?
-
How do technological and other factors influence utilisation and expenditure?
In addition to these research questions, this study mentions our further preliminary investigation of the private hospital data for individual disease classifications per age band. This will be the focus of a forthcoming analysis.
Data and methodology
Having illustrated the overall trends of medical scheme expenditure on private hospitals, the remainder of the study aims to answer the specific research questions (stated above) by looking at private hospital admission data from Netcare, Mediclinic and Life Healthcare. These are the three largest private hospital groups in South Africa and represent approximately 70% of private hospital beds in South Africa over the period 2006 to present. The admission data will be referred to throughout the report as 'private hospital data'. Private hospital data were chosen for two reasons mainly. Firstly, the hospital data provided more detailed and granular information, for example, admission indicators by age and diagnosis levels, as opposed to utilisation data published by the CMS. This was crucial to the study as the aim was to move beyond previous aggregate analysis. Secondly, independently collecting and collating the data from the three largest private hospital groups ensured consistent variable definitions, which was also crucial to the accuracy of the study.
The private hospital data collected cover the period of 2006-2014, as, at the time of writing, 2014, were the latest year for which CMS beneficiary data were published.5 The data are assessed at face value and cover all admissions in the time specified, aggregated by year, age band and select ranges of ICD10 codes.6 Each aggregate entry then includes number of admissions, total patient days and total expenditure - where the following definitions are noted:
-
admissions - occupation of a bed in a hospital (all hospitals considered); excludes outpatients
-
patient days - calendar patient days and not bed patient days; [discharge date - admission date + 1]
-
expenditure - billed revenue in nominal Rands, including value-added tax (VAT).
All data were cleaned and organised for the purpose of the study, and reasonability checks carried out.
This study uses targeted descriptive and exploratory analyses, relying on a residual approach to hospital expenditure, in order to analyse the data for the purpose of answering the research questions. The residual approach, pioneered by Feldstein (1971) and Fuchs (1972), subtracts the impact of known variables from hospital expenditure, leaving a residual, which may be an approximate representation of expenditure attributable to a variable of interest. Such an equation is usually analysed in growth rates rather than absolute terms. The study analyses the expenditure-utilisation link from various angles, in aggregate and per age band. Where necessary and appropriate, the data are adjusted for the share of total private hospital beds accounted for by the three listed hospital groups, and for self-paying patients.7
Results
Utilisation rates in aggregate
The first step in the utilisation analysis is to examine the aggregate trends (all diagnoses, all ages, etc.). This has limitations as, in aggregate, relevant trends may be hidden and even reversed.8 However, this is a valuable starting point to indicate overall trends before moving to the next step that is decomposing the data by age group.
When considering the aggregated admissions of Netcare, Mediclinic and Life Healthcare, it is found that utilisation per 1000 beneficiaries at these three groups has, over the period of analysis, increased. This is indicated in the left-hand frame of Figure 3 where it is shown that admissions per 1000 beneficiaries have increased by a cumulative 3.5% over 2006-2014, from approximately 242 admissions per 1000 beneficiaries in 2006 to 250 admissions per 1000 beneficiaries in 2014.
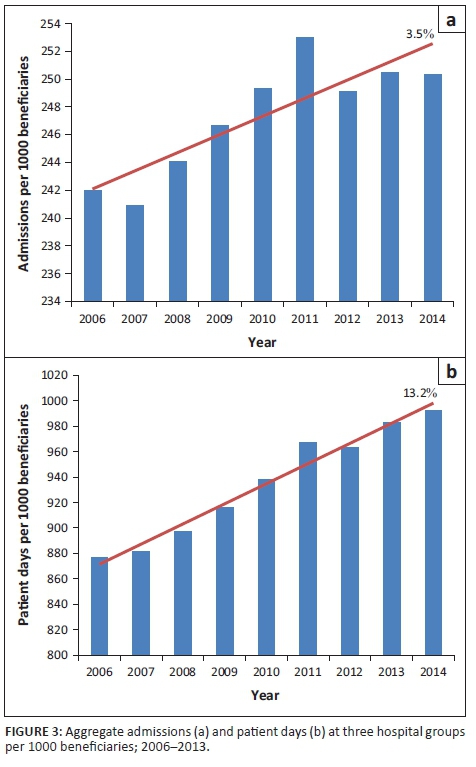
Similarly, patient days per 1000 beneficiaries at these three groups have also increased by a cumulative 13.2% over the 2006-2014 period as shown in the right-hand frame, from approximately 877 patient days per 1000 beneficiaries in 2006 to approximately 992 patient days per 1000 beneficiaries in 2014. The underlying lengths of stay in this variable may be driven by supply (e.g. extent of care) and/or demand (e.g. acuity) factors. This study does not analyse the split, but the impact of acuity is analysed in terms of age in this study, and in terms of diagnoses in the forthcoming study.
These increasing utilisation trends are relevant insofar as they impact expenditure increases and therefore inform related perceptions.
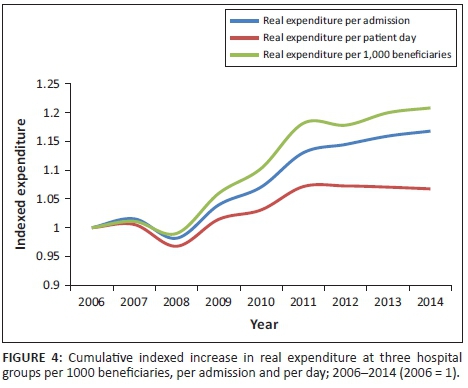
Figure 4 illustrates that when viewing expenditure per 1000 beneficiaries, the real cumulative increase over 2006-2014 is approximately 21% (upper line). However, if viewing real expenditure increases in terms of admissions and/or patient days, these cumulative increases are lower, exhibiting cumulative increases of 17% (middle line, approximately 2% p.a.) and 7% (lower line, approximately 1% p.a.), respectively (2006-2014). Such expenditure increase residuals correlate closely to hospital price inflation, with the latter averaging 0.8% points above headline inflation over 2003-2013 (Econex 2014). The fact that the increase in real expenditure per 1000 beneficiaries trends above the increase in real expenditure per admission and patient day is therefore a first indication that increased utilisation is a significant contributor to increased expenditure, and that inflation trends are in line with overall price increases in the economy. In other words, simply ascribing private hospital expenditure increases to hospital price increases is incorrect. The below subsection expands on this by further unpacking the aggregate data by age band.
Utilisation rates by age group
Population ageing is expected to have an influence on healthcare expenditure as older beneficiaries are generally expected to require more care relative to younger individuals. This is because of higher prevalence of various acute and chronic health conditions in older age groups - a global phenomenon. As such, ageing within the medical scheme population is relevant to this study's context.
Previous researchers have often looked at the average age of beneficiaries (rather than patients) and concluded that this is relatively stable, and therefore they do not delve deeper into other drivers such as utilisation and cost (CMS 2008; Van den Heever 2013:65). This is, however, not sufficient as it is a simplistic measure of central tendency and may be balanced by the underlying distribution, such that information regarding the latter is lost. This is also the view taken by Discovery Health, DHMS and Insight Actuaries, as, respectively, referred to here:
While the average age is a good summary measure for comparing age trends and their claims impact over time, this summary measure also hides changes in the distribution of age groups over time. (Discovery Health 2014:34)
Average age calculations tend to hide the negative impact of changes in the distribution of age groups on the health profile of the medical scheme membership base. While DHMS has maintained a relatively stable average age, it now has a) a higher proportion of lives at the older ages, as well as more younger children, who are higher claimers; and b) fewer older children and young adults, who are relatively low claimers. (Discovery Health Medical Scheme 2014:86-87)
The average age is not a good indicator of the demographic profile of medical scheme beneficiaries as increases in the proportion of older members can simultaneously be masked by similar increases at lower ages. (Insight Actuaries and Consultants 2014:36)
Understanding changes in the underlying beneficiary age distribution is therefore imperative, but it is not sufficient when analysing its related influence on private hospital utilisation and expenditure. This study therefore considers patient (rather than general beneficiary) ageing by analysing actual admission and expenditure data per age band from the above-mentioned three hospital groups. This concentrates the analysis on the age distribution and its direct relation to expenditure, using the same age bands as are analysed by the CMS. The trends both within and between age bands, and both in levels and growth rates, are of interest. In addition to controlling for the number of beneficiaries per age band and the change in this over time, the data are also adjusted to the share of total private hospital beds accounted for by the three listed hospital groups, and for self-paying patients. The data presented here provide ample indication of the ageing-utilisation-expenditure link.
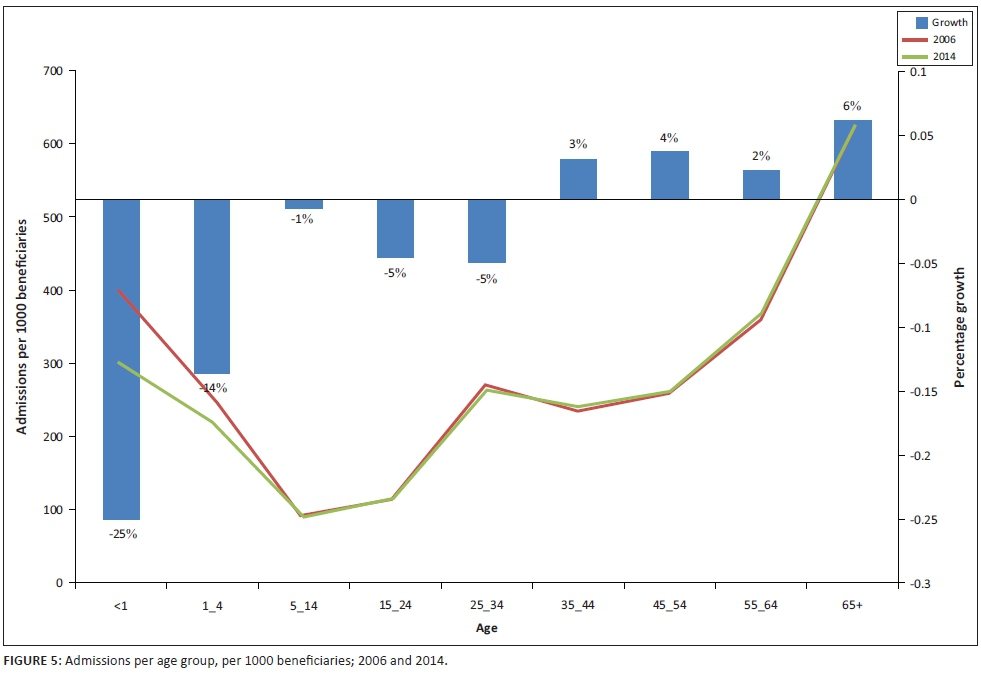
Figure 5 shows admissions per 1000 beneficiaries per age band in 2006 and 2014. The trend lines relate to the left axis and show the level of admissions per 1000 beneficiaries in these two time periods. The bars relate to the right axis and show the growth in admissions per 1000 beneficiaries between these two time periods. Most relevant to note from this figure is that levels of admissions per 1000 beneficiaries are the highest for the 65+ age band. Considering that it is shown that there are around 600 admissions for every 1000 beneficiaries in this upper age band, it can be said that of every 10 beneficiaries aged 65+, six of them are admitted to hospital per year. This is in contrast to the younger age bands for which between one and four of every 10 beneficiaries are admitted to hospital per year. In terms of the growth in admissions, this is also highest for the 65+ age band. Between 2006 and 2014, admissions per 1000 beneficiaries increased by 6% for that age band, that is, indicating that utilisation increased at a greater rate than its beneficiary base for this age band. Such positive figures are also indicated for other age bands, but to a lesser degree.
Interestingly, it appears that admissions per 1000 beneficiaries decreased in the very young age bands, implying that in this period, admissions grew at a lesser rate than beneficiaries in these age bands. This is because of a number of factors and will be the focus of future research. Preliminary investigation indicates that it is partially driven by significant beneficiary growth (66%) for this age band from 2006 to 2014, making the overall fraction of calculation (admissions per 1000 beneficiaries) negative. It may also be influenced by the fact that in South Africa, healthy newborn babies are not counted as separate admissions. Hence, the newborns that are included in this figure are those that have complications and so are admitted in their own right. High growth in beneficiaries (44%) for those aged 1-4 also partly explains the negative fraction in this age band. Other factors such as medical scheme option choice or benefits and demographic factors of new beneficiaries being added to the medical scheme population may also influence these trends. This study's data do not, however, allow analysis of these factors. In summary, it is clear that ageing has a strong and increasing influence on admissions at private hospitals both in terms of admission levels and growth rates per 1000 beneficiaries as shown in Figure 5.
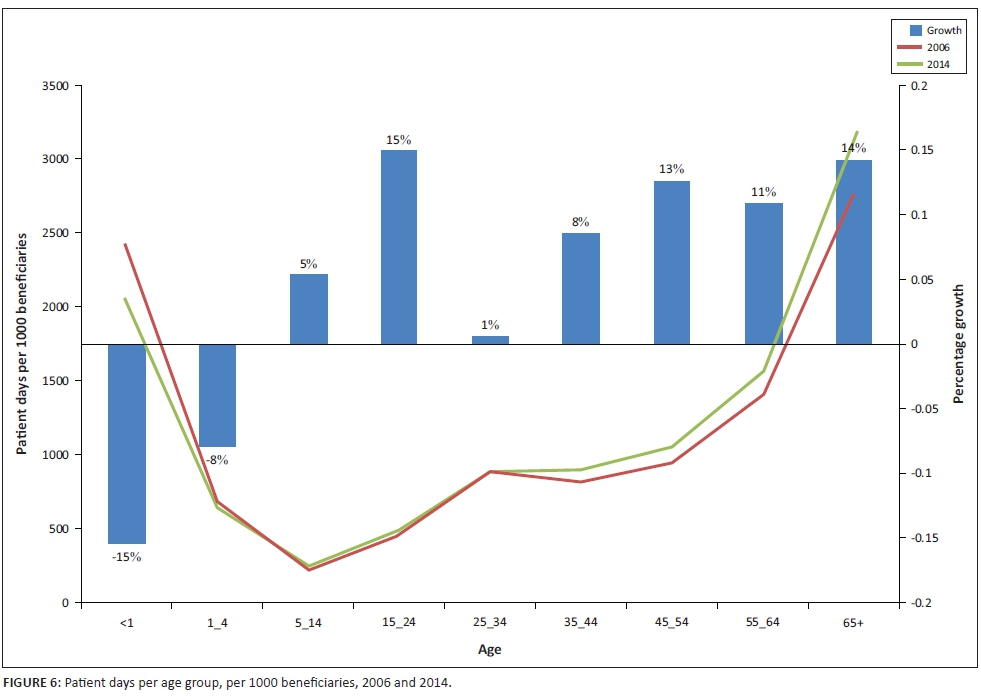
Figure 6 shows a similar trend for patient days as for admissions; illustrating that when jointly considering the levels of patient days per 1000 beneficiaries and the growth thereof over the past 9 years, these appear to be most significant in the case of the 65+ age band. At just over 3000 patient days per 1000 beneficiaries for this age band in 2014, it can be said that, on average, there are three patient days spent per year for every beneficiary in that age band, and that this is increasing significantly over time. The negative trends for <1 s and 1-4 s are similar to those observed in Figure 5 and have been discussed above; suffice to note that it remains an interesting phenomenon that will be researched further in the future.
These utilisation trends are relevant for many reasons but most importantly insofar as they impact on expenditure. If utilisation is increasing at a more rapid rate than beneficiaries are increasing, it may be expected that the expenditure per average beneficiary is also increasing. Considering the impact of utilisation increases on expenditure is particularly important because of the higher average expenditure in the older age bands, which are also the age bands with the largest utilisation increases.
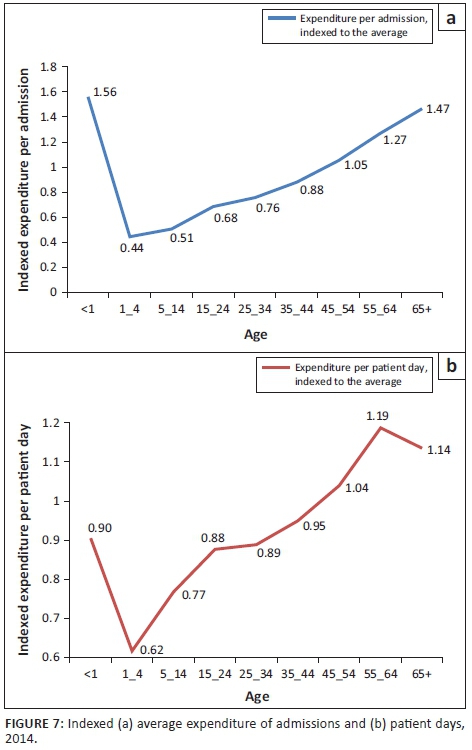
Figure 7 shows the expenditure per admission (left-hand side frame) and per patient day (right-hand side frame) per age band, indexed to the average across all age bands. The left frame shows that the expenditure per admission for patients under the age of 1 and above the age of 65 is the highest - the average expenditure for treating patients in these age bands is roughly 50% (1.47 indexed value) higher than the average spent on all admissions. The expenditure per admission for a patient aged 55-64 is also significantly above the average - close to 30% (1.27 indexed value) above the average. In slight contrast to the left frame, the right frame shows that patient days are progressively more costly for older age bands. These trends confirm that older individuals, on average, and when hospitalised, generally require more care and may also stay in hospital for longer periods. Taking these trends into account, it is clear that the increasing utilisation trends for older age bands, as shown in Figures 5 and 6, are significant cost drivers for private hospitals and therefore also medical scheme expenditure. While the average cost of treating an individual aged <1 is also costly, this is overshadowed by the fact that the admission and patient days for this age band have been decreasing. However, this does not 'cancel out' the increase in expenditure related to the increase in admissions and patient days for those in the older age bands as there are many more beneficiaries in the older age bands, relative to beneficiaries in the youngest two age bands.
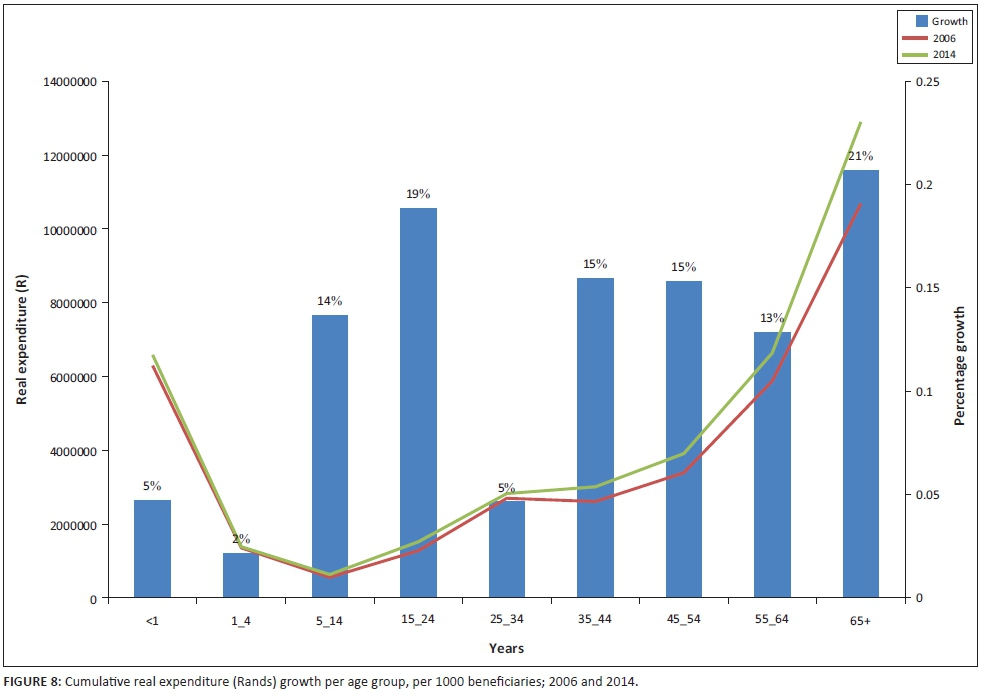
The section below proceeds to examine the change in average expenditure per age band over time, while controlling for beneficiary growth and inflation. As expected from the evidence presented in the preceding three figures, Figure 8 illustrates that real expenditure per 1000 beneficiaries has cumulatively increased over the period 2006-2014. Expenditure has therefore increased at a more rapid rate than beneficiaries in this period. The largest portion of expenditure is attributed to the 65+ age band as shown (by the lines), and this age band also relates to the most rapidly increasing expenditure as indicated (by the bars). Note that expenditure per 1000 beneficiaries for <1 s is positive, in contrast to utilisation in this age band (as earlier shown). This study has, however, discussed that this is because of the fact that those patients admitted in this age band are those who have complications (healthy babies remain on their mother's admission file). In these cases, they usually require significantly more care.
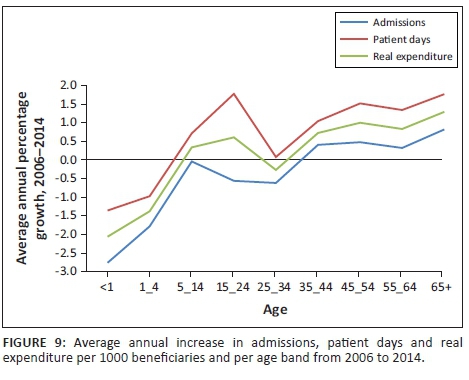
To be certain that the above analyses do not mask changes that are occurring in the interim periods, Figure 9 additionally shows average annual growth rates for admissions, patient days and real expenditure, with each being per thousand beneficiaries (as in the above figures). This indicates the same trends as evident in Figures 6-8, specifically that utilisation of hospital services by older medical scheme beneficiaries, and consequently related expenditure, is increasing over time.
The above analyses and discussions have indicated that utilisation, in terms of admissions and patient days, plays a strong role in medical scheme expenditure on private hospital services. This is particularly pronounced for patients in older age bands, confirming that there is an evident link between ageing, utilisation and expenditure. It may, however, be relevant to more explicitly question what the expenditure increases are once this utilisation has been accounted for. Figure 10 shows these increases over 2006-2014 in expenditure per admission and per patient day.
The results show that, after accounting for utilisation in terms of admissions and patient days, real expenditure has increased minimally. In terms of patient days, for instance, the data show an average (unweighted) cumulative increase across all age bands over the 9-year period of 7.4%, translating into an increase in expenditure per patient day of less than 1% per annum. This may be related to benign hospital price inflation, technological advances that may cost slightly more, and so on, but, in general, negates the fact that price is the main driving factor in expenditure increases.
In the case of the younger age bands, the higher expenditure increases noted are most likely derived from technological advances in neonatal and general childcare over the last decade, as well as general acuity in these age bands. As discussed above, the case of <1's is particularly unique. In this age band, the data indicate decreased admissions and patient days per 1000 beneficiaries, alongside increased expenditure per 1000 beneficiaries. It has been mentioned that beneficiaries in this age band have been increasing rapidly, while admissions in this age band are mostly for those babies who present highly acute conditions and require a significant amount of care. This is hence not expected to be a function of increasing prices, but rather more intensive treatments. Nevertheless, utilisation trends in these younger age bands remain interesting and different from the other age bands - this will be the focus of future research.
In summary, the analyses in this section show a strong and increasing influence of ageing on utilisation and this, in turn, has a significant influence on expenditure on hospital services. The fact that older individuals are in general likely to be admitted to hospital more often, and when admitted also require more care, is not the main issue. The issue to be highlighted is rather the problem that utilisation by these age bands appears to be increasing rapidly over time. This implies that ageing is not only a strong influence on expenditure, but also one that is playing an increasingly important role. Looking at expenditure in terms of utilisation confirms that utilisation is a strong driver of expenditure. It is found that the residual of expenditure increases per patient day over time, after adjusting for utilisation increases, is below 1% per annum.
In addition to and in conjunction with medical scheme ageing effects on utilisation and expenditure at private hospitals, the disease burden of beneficiaries is expected to impact on utilisation and expenditure. There is a growing body of research that supports that there is an increasing burden of disease evident in the South African medical scheme population, with the majority of research focussing on chronic diseases.
Research by the CMS (2015) indicates that the upward trend in prevalence rates of chronic diseases in the South African medical scheme population had, over 2008-2013, continued to increase at rates more rapid than the medical scheme population growth. In addition, it is found that concurrent disease prevalence is becoming an increasing phenomenon. In this regard, the following was stated by the CMS (2015):
The number of medical scheme beneficiaries who were diagnosed and treated for multiple chronic conditions increased by more than 25% between 2012 and 2013, whilst the number of beneficiaries with four or more chronic conditions increased over the same period by 78%. (p. 9)
Other stakeholders have also provided insights into the growing chronic disease burden. For example, Discovery Health (2014) reports that:
Over a 5 year period, age and plan mix adjusted chronic disease prevalence in DHMS has increase by 27.3%, or 4.9% per annum. This increase in chronic disease prevalence leads to an expected increase in claims costs of approximately 1.4% per annum, before any other inflation related factors. (pp. 35-37)
The above indicates that chronic disease prevalence does impact on overall healthcare expenditure and it is also expected to be the case specifically for medical scheme expenditure on private hospitals. This is because of the medical schemes regulatory environment mandating chronic diseases and other conditions that are specified as included in PMBs to be covered in full by medical schemes, particularly in the case that a designated service provider (DSP) is utilised and the correct protocols are followed for treatment.9
In addition to chronic diseases, it is also well documented that South Africa in general is facing a complex, quadruple burden of disease. As stated by the Competition Commission of South Africa in their initial terms of reference to the ongoing inquiry into the private healthcare sector:
South Africans are facing what is referred to as a 'quadruple burden of disease': The first burden is the HIV/AIDS pandemic; the second is that of injury, both accidental and non-accidental; the third consists of infectious diseases such as tuberculosis, diarrhoea and pneumonia, and the fourth is the growing prevalence of lifestyle disease related to relative affluence. (South African Competition Commission 2013:77)
In this context, it is important to understand the profile of diseases that the private healthcare sector of South Africa is exposed to. A preliminary investigation of the private hospital data for individual disease classifications per age band seem to confirm and further explain the results presented earlier in this study: disease related utilisation by beneficiaries in the older age bands appears to be increasing rapidly over time. It also looks to be the case that younger individuals are progressively exposed to such diseases. A complete analysis of changes in the disease burden per age band should prove very interesting and aid in the better understanding of utilisation increases, as well as its interaction with ageing and expenditure. This will be the focus of a forthcoming analysis.
Discussion: Other drivers of medical scheme expenditure on private hospitals
It was explained in earlier sections that the expenditure residual can be attributed to many factors. The sections above have accounted for beneficiary growth, headline inflation and utilisation adjustments. Having adjusted the expenditure data for these factors, the analysis showed that the price residual is similar to general price increases in the economy (and highly correlated to hospital price inflation). This section provides some qualitative discussion on the other factors that are known to contribute to healthcare expenditure here and in other countries.
Technology
In addition to an increase in the volume of private hospital services being demanded, the last decade has also witnessed a shift in the type of services being demanded and supplied. This is driven by the ageing and disease trends that have been discussed, but concurrently also by the development of new medical technologies over the last decade. These technologies facilitate new or improved treatments, and are therefore expected to interdependently influence utilisation and expenditure by medical scheme beneficiaries at private hospitals. The relevant international literature provides a significant amount of discussion and empirical work on the portion of healthcare cost and expenditure increases that is driven by new technology. There are also numerous international literature reviews available on this topic (see, e.g., Sorensen, Drummond & Kahn 2013).
New medical technologies include products that are both substitutes and complements to existing products (and thus those that may result in substitutive or complementary procedures), as well as those that are entirely new products and may therefore result in entirely new procedures. They therefore include diagnostics, medicines, surgicals, prostheses and equipment, as well as knowledge and support systems.
Where these technologies have been linked to improved health outcomes, they are expected to influence both demand for and supply of private hospital services, and also to influence expenditure on private hospitals through both price and utilisation (with the direction of influence for each being specific to that technology).
Institutional factors
Although this study has analysed increases in medical scheme expenditure on private hospitals mainly over 2006-2014, institutional changes in the preceding period should also be noted insofar as they are expected to relate to private hospital utilisation and expenditure. Specifically:
-
In 2000, the Medical Schemes Act10 was promulgated in South Africa. This introduced various important pillars of the private healthcare system that are in existence today. Importantly, it introduced open enrolment - removing any option to decline membership of an open scheme to any prospective member. Additionally, community rating was introduced - removing any option to differentiate members' contributions based on the health or similar risk profile of that person.
-
With the introduction of the Medical Schemes Act also came PMBs.11 These are benefits that are mandatory for medical schemes to cover in full, irrespective of the members' medical scheme benefit option. All medical schemes at present are specifically obliged to cover the full costs related to the diagnosis, treatment and care of any life-threatening emergency condition, a defined set of 270 diagnoses and 25 chronic conditions. This must be sought at a DSP in order to be covered in full, except in the case of emergencies.
The next section explains how these two broad institutional factors are expected to influence utilisation and expenditure by medical scheme beneficiaries at private hospitals.
Anti-selection and moral hazard
As the medical scheme environment in South Africa is characterised by open enrolment and community rating, but not mandatory membership, it can be expected that some degree of anti-selection is exercised by medical scheme beneficiaries. The existence and degree of anti-selection in the medical scheme population impacts the private hospital admission rate.
The general concept of anti- (or adverse) selection is well understood by healthcare funders, for example, as explained by Discovery Health (2014):
-
Adverse selection describes a process whereby low risk individuals drop out of (or fail to join) the insurance pool, leaving proportionally more high-risk individuals in the pool - resulting in unsustainable insurance markets. An insurer has to base the premium on a risk pool that includes both healthy and sick individuals, as the principle is that everyone pays less because the costs of only a proportion of those members who become sick are spread across everyone. But individuals purchasing insurance have better information regarding their risk status than does the insurer. Therefore, low risk individuals (who know they are low risk) are less inclined to purchase insurance (or to remain members) because the premium does not reflect their risk status, whilst high risk individuals are more inclined to buy insurance (or to remain members), resulting in premium revenue over time being insufficient to cover expected losses. An increasing age and increasing chronic prevalence and disease burdens … are manifestations of the broader problem of adverse selection. (p. 40)
There is a growing body of research to support the existence of adverse or anti-selection in the South Africa medical scheme population. This is evident in studies that consider the age distribution of the medical scheme population relative to the age distribution of the South African population as a whole (e.g. McLeod & Grobler 2009). These studies find that there is, in fact, a significant difference, with the medical scheme population showing peaks around maternity years and again around more disease prevalent, older years. Studies regarding the inflation of contribution trends between open and closed medical schemes (e.g. Oxera 2012) also offer support for the existence of adverse and anti-selection. These find that inflation is significantly higher for open schemes, indicating the fact that these schemes are more widely exposed to risk-seeking individuals.
While this study does not estimate a counterfactual or precisely quantify to what extent utilisation and expenditure trends are affected by the institutional changes, the data analysed in the preceding sections have illustrated that anti-selection is a plausible characteristic of the current private healthcare system in South Africa. This is deduced from the fact that the private hospital utilisation data are indicative of a progressively ageing distribution.
In addition to adverse selection, it is also expected that moral hazard within the private healthcare sector influences increases in utilisation and hence increases in medical scheme expenditure on private hospitals. Moral hazard is a common phenomenon within healthcare markets and, in South Africa specifically, is a function of the community rating principle, whereby medical schemes cannot charge different amounts for the same level of coverage. Therefore, this coverage turns unpredictable health expenditures into predictable coverage payments, and consequently may encourage beneficiaries to simply utilise (or act in such a way so as to be more likely to utilise) more care because of the fact that they are covered. As with anti-selection, the data in this study do not allow inference about the degree of moral hazard existent within the private healthcare sector, but this is acknowledged to be an additional and relevant driver of cost. Any further study of this phenomenon would need to carefully distinguish this from anti-selection as it is expected that these two phenomena would exhibit joint effects.
Prescribed minimum benefits
Prescribed minimum benefits also influence utilisation of and expenditure by medical scheme beneficiaries at private hospitals. PMBs, defined at the start of this section, were introduced with the intention of providing a minimum healthcare package for all those who contributed to a medical scheme. However, because of the hospital-centric nature of many PMBs, these do significantly impact medical scheme expenditure on private hospitals by expanding medical scheme beneficiaries' access to private hospitals and increasing utilisation of private hospital services by these beneficiaries. There is evidently greater incentive for patients to seek out these benefits in hospital and potentially also for service providers to provide care in these instances (as this is not a direct financial cost to their patient).
Again, this study does not estimate a counterfactual and precisely quantify to what extent utilisation and expenditure trends are affected by the PMBs regulation. The forthcoming research on disease diagnoses provides more detail on this.
In summary, there are many interdependent factors that may impact on private hospital utilisation and expenditure. Amongst these are technological factors and institutional factors. This study discussed the mechanisms through which these factors may impact on expenditure, and the data analysed in this report support the fact that these factors do play a role in determining utilisation and expenditure. They must therefore be taken into account by the relevant stakeholders and policymakers when considering expenditure increases.
Conclusion
This study was motivated by the high and rising medical scheme expenditure on private hospitals that has often been referred to in the ongoing debate around what drives these expenditure increases. In previous years, this was, without due consideration, attributed mainly to hospital price increases. In recent years, however, more detailed research has contributed to a better understanding of the expenditure trends and its relationship to utilisation and associated underlying trends such as ageing, disease, technology, anti-selection and so forth. This study contributes to this progressively growing body of research by providing important insights into how utilisation is a driving force in explaining medical scheme expenditure on private hospitals.
In order to do so, this study analysed the detailed admission data of Netcare, Mediclinic and Life Healthcare - the three largest private hospital groups in South Africa, accounting for more or less 70% of the total private hospital beds. The level of detail allowed us to answer specific research questions by analysing the data at a granular and aggregate level (e.g. age level).
The analysis shows that year-on-year increases in real expenditure PABPA by medical schemes on private hospitals over the last decade present low single-digit growth rates. Specifically, the data show year-on-year increases in real PABPA expenditure of less than 5% over 2010-2014. Notwithstanding this, it is found that utilisation of private hospitals has, in fact, increased, with the results indicating that admissions and patient days per 1000 beneficiaries have cumulatively increased by 3.5% and 13.2% over 2006-2014, respectively. The analyses indicate that in aggregate, these utilisation adjustments explain a significant portion of the real expenditure increases and after accounting for these increases, there is a residual of 2% p.a. per average admission and 1% p.a. per average patient day over those 9 years. These residuals can be decomposed further and are shown to correlate closely to hospital price inflation, with the latter averaging 0.8% points above headline inflation over 2003-2013 (Econex 2014). Most notably, the study finds that the cumulative expenditure increase residual, after accounting for utilisation, is in most cases relatively benign. The residual may be because of hospital price inflation, acuity and/or technology. For this purpose, a discussion on the impact of technology and institutional factors on the admission rates faced by private hospitals is included. The evidence analysed, therefore, clearly shows that utilisation trends significantly contribute to the medical scheme expenditure increases that are observed for private hospitals. In addition, utilisation is inter alia driven by ageing and disease trends, the first of which is analysed in detail in this study and the latter in a forthcoming study.
In summary, the detailed analysis in this study showed that utilisation at private hospitals is indeed on the rise, and that this is inter alia driven by the ageing trends of the medical scheme population. This strongly contradicts certain stakeholder's assertions that such factors do not play a role in explaining utilisation and expenditure trends. The data also indicate - after controlling for beneficiary growth and headline inflation - that hospital price increases during the latter years examined in this study (2006-2014) have been in line with general price increases in the economy. It would therefore be incorrect to attribute expenditure increases to price increases, as the analyses clearly show that there are many factors contributing to increased expenditure, with price increases being fairly benign over the period.
These trends should also carefully be interpreted in the context of a continually evolving private healthcare sector with consistent improvements in care and concurrent incentives for individuals to self-select into the private sector. Taken together, the evidence in this study shows that utilisation and underlying trends explain most of the medical scheme expenditure increases that are observed for private hospitals. This is an important finding and relevant for informing the direction of future health policy.
Acknowledgements
This work has been commissioned and paid for by the Hospital Association of South Africa (HASA).
Competing interests
The authors declare that they have no financial or personal relationship(s) that may have inappropriately influenced them in writing this article.
Authors' contributions
M.E. was responsible for research and writing the report and interpretation of results. H.K. did statistical and technical analysis and wrote the report.
References
American Hospital Association and the Lewin Group, 2005, The cost of caring: Sources of growth in spending for hospital care, viewed from http://www.aha.org/content/00-10/CostCaring.pdf [ Links ]
Besesar, S. & van Eck, H., 2009, Hospital admission rates for the medical scheme population in SA: Is there a supplier induced demand problem? In Private Hospital Review, Commissioned by HASA, viewed 26 March 2016, from http://www.compcom.co.za/wp-content/uploads/2015/05/Mediclinic-Annexure-14-HASA-Publication_-Private-Hospital-Review-2009.pdf [ Links ]
CMS, 2008, Evaluation of medical schemes' cost increases: Findings and recommendations, CMS Research Brief, viewed 30 March 2016, from https://www.medicalschemes.com/files/Research%20Briefs/Report_on_Cost_Inc.pdf [ Links ]
CMS, 2015, Prevalence of chronic diseases in the population covered by medical schemes in South Africa, Research and Monitoring Unit of the CMS, viewed 30 March 2016, from http://www.medicalschemes.com/files/Research%20Briefs/RBPrevCD20150128.pdf [ Links ]
Dieleman, J.L., Baral, R., Birger, M., Bui, A.L., Bulchis, A., Chapin, A. et al., 2016, 'US spending on personal health care and public health, 1996-2013', JAMA 316(24), 2627-2646. https://doi.org/10.1001/jama.2016.16885 [ Links ]
Discovery Health, 2014, Submission to the competition commission market inquiry into the private health sector, viewed 14 April 2016, from http://www.healthinquiry.net/Lists/Submissions%20from%20Public/AllItems.aspx [ Links ]
Econex, 2012, Medical scheme expenditure on private hospitals, viewed 14 April 2016, from http://econex.co.za/publication/occasional-note-august-2012/ [ Links ]
Econex, 2014a, Market concentration trends in private healthcare. Research note and underlying analysis, viewed 14 April 2016, from http://econex.co.za/publication/occasional-notes-march-2014/ [ Links ]
Econex, 2014b, Rising prices in the healthcare sector: Unpacking health inflation, Econex Research Note, viewed 14 April 2016, from http://econex.co.za/publication/research-note-36/ [ Links ]
Econex, 2016, Supply-induced demand in the private healthcare sector: Theoretical considerations, viewed 24 July 2017, from https://econex.co.za/publication/research-note-40/ [ Links ]
Feldstein, M., 1971, The rising costs of hospital care, Information Resources Press, Washington, DC. [ Links ]
Fuchs, V.R., 1972, Essays in the economics of health and medical care, National Bureau of Economic Research, New York. [ Links ]
HASA, 2008, Private hospital review 2008: Examination of factors impacting on private hospitals, viewed 06 December 2015, from http://www.mediclinic.co.za/about/Documents/HTG%20Private%20Hospital%20R eview%202008.pdf [ Links ]
Insight Actuaries and Consultants, 2014, International benchmarking of hospital utilisation, Commissioned by HASA, viewed 15 May 2016, from http://www.compcom.co.za/wp-content/uploads/2016/03/HASA-Intl-utilisation-benchmarking-Final-20141123.pdf [ Links ]
Life Healthcare, 2016, Presentation for health market inquiry public hearing - Set 1, viewed 14 April 2016, from http://www.compcom.co.za/week-3-public-hearings-2/ [ Links ]
McIntyre, D.I. & Thiede, M., 2007, 'Health care financing and expenditure', South African Health Review 2007, 35-46. [ Links ]
McLeod, H. & Grobler, P., 2009, 'The role of risk equalisation in moving from health voluntary private insurance to mandatory coverage: The experience in South Africa', Advances in Health Economics and Health Services Research 2009(21), 159-196. [ Links ]
Netcare, 2016, Presentation to healthcare market inquiry, viewed 14 April 2016, from http://www.compcom.co.za/week-3-public-hearings-2/ [ Links ]
Oxera, 2012, Private healthcare market in South Africa, p. 20, viewed 02 March 2016, from http://www.healthinquiry.net/Public%20Submissions/MCSA%20Annexure% 205.10%20-%20Oxera%20report%20entitled,%20Private%20Healthcare%20Market %20in%2 0Soutth %20Africa,%20dated%2014%20December.pdf [ Links ]
Sorensen, C., Drummond, M. & Kahn., B.B., 2013, 'Medical technology as a key driver of rising health expenditure: Disentangling the relationship', ClinicoEconomics and Outcomes Research 2013(5), 223-234. [ Links ]
South African Competition Commission, 2013, Terms of reference for market inquiry into the private healthcare sector, Government Gazette, 29 November 2013, Notice 1166 of 2013: 77. [ Links ]
Van den Heever, A., 2013, Review of competition in the South African Health System, Produced for the Competition Commission, p. 65, viewed 09 June 2016, from http://www.compcom.co.za/wp-content/uploads/2014/09/Review-of-Competition-in-the-South-African-Health-System.pdf [ Links ]
Vera-Hernandez, M., 2003, 'Structural estimation of a principal-agent model: Moral hazards in medical insurance', RAND Journal of Economics 34(4), 670-693. https://doi.org/10.2307/1593783 [ Links ]
 Correspondence:
Marine Erasmus
marine@econex.co.za
Received: 02 Sept. 2016
Accepted: 16 Sept. 2017
Published: 29 Mar. 2018
1. This period is selected because of data availability.
2. For the purpose of this report, utilisation is used as a collective term to describe changes in volume and case mix.
3. This year (2006) was chosen as the analysis of utilisation data focused on the period between 2006 and 2014. Prior to 2006, differences in clinical coding make it difficult to aggregate data across hospital groups. While this issue still needs to be overcome with data after that point, it is less of an issue and data seem to be more comparable.
4. Prescribed minimum benefits as a policy instrument were introduced in the Medical Schemes Act, 131 of 1998. These are benefits that are mandatory for medical schemes to cover in full, irrespective of the members' medical scheme benefit option. Regulations made in terms of the Act were promulgated in 1999 and came into force in 2000. Significant clarity was added to the PMBs regulation in 2002 (published in the Government Gazette Volume 449, No. 24007, November 2002). This is discussed further in the section 'Institutional factors'.
5. The private hospital data were not collected for the period preceding 2006 because of coding inconsistencies and problems related to the cross-mapping of clinical codes between the various hospital groups.
6. International Classification of Diseases and Related Health Problems, 10th version.
7. The methodology is as used by (1) Econex (2012), (2) Insight Actuaries and Consultants (2014) and (3) Besesar and van Eck (2009). This assumes an equal occupancy to bed ratio between groups.
8. This is usually referred to in statistics and probability theory as Simpson's paradox.
9. This may impact on the care seeking behaviour of medical scheme beneficiaries and those in particular using private hospitals, further exacerbating the indication of disease patterns. This regulatory environment and relation to expenditure is discussed further in the 'Institutional factors' section.
10. No. 131 of 1998. Regulations made in terms of the Act were promulgated in 1999 and came into force in 2000.
11. Please refer to section 29 (1) of the Medical Schemes Act, as well as Regulation 8.

