


Servicios Personalizados
Articulo
 Inglés (pdf)
 Articulo en XML
 Referencias del artículo
Indicadores

Links relacionados
-
 Citado por Google
 -
 Similares en Google
Compartir

 Permalink
South African Journal of Economic and Management Sciences
versión On-line ISSN 2222-3436
versión impresa ISSN 1015-8812
S. Afr. j. econ. manag. sci. vol.21 no.1 Pretoria 2018
http://dx.doi.org/10.4102/sajems.v21i1.1959
ORIGINAL RESEARCH
A review of biodiversity reporting by the South African seafood industry
Kieran Usher; Warren Maroun
School of Accountancy, University of the Witwatersrand, South Africa
ABSTRACT
BACKGROUND: Biodiversity reporting is an area of sustainability accounting research that has received comparatively little attention from the academic community. This is despite the growing scientific concern about climate change, habitat destruction and extinction of species and mounting evidence on the implications of these environmental issues for our current way of life. This necessitates additional research on biodiversity reporting, especially in a South African context given that the country is home to some of the richest biodiversity regions on earth.
AIM: This research examines what information companies in the South African seafood industry are reporting on biodiversity. This includes the development and application of an easy-to-use disclosure scorecard to track the quality of biodiversity-related disclosures.
SETTING: The study focuses on South African biodiversity reporting. The choice of region is informed by the country's significant marine resources and mature corporate reporting environment, where non-financial disclosures are expected to be well developed.
METHODS: Content analysis was used to collect data from a sample of companies' integrated and sustainability reports. The data were analysed interpretively to determine what biodiversity disclosures companies provide and the quality of those disclosures.
CONCLUSION: The study shows that while the quantum of biodiversity reporting is relatively low, some companies are starting to provide more detailed accounts of their biodiversity impact, pointing to higher levels of reporting quality. There is still room for improvement, but these findings suggest that reporting on non-financial sustainability issues is maturing and that companies are beginning to appreciate the importance of preserving biodiversity for ensuring long-term sustainability.
Introduction
There are numerous national and international standards dealing with what is referred to generally as 'sustainability reporting' (Dumay, Guthrie & Farneti 2010). The guidelines issued by the Global Reporting Initiative (GRI) are the most prominent. They are used by over 90% of the world's largest companies when preparing their sustainability and, more recently, integrated reports (Dumay et al. 2010; Hughen, Lulseged & Upton 2014). Of particular interest for the purpose of this research is the GRI's (2016) emphasis on the biodiversity reporting as part of the broader sustainability agenda:
Protecting biological diversity is important for ensuring the survival of plant and animal species, genetic diversity, and natural ecosystems. In addition, natural ecosystems provide clean water and air, and contribute to food security and human health. Biodiversity also contributes directly to local livelihoods, making it essential for achieving poverty reduction, and thus sustainable development. (p. 185)
Given the importance of biodiversity for assessing sustainability, academics have begun to evaluate reporting on biodiversity-related issues by some of the world's most prominent companies (Adler, Mansi & Pandey 2018; Atkins et al. 2016a; Hossain 2017; Jones & Solomon 2013). This research is, however, limited mainly to biodiversity reporting in developed economies (Jones & Solomon 2013). In addition, the work concentrates on describing what information companies are reporting, the extent of compliance with reporting frameworks and the quantity of biodiversity disclosures (Mansoor & Maroun 2016; Rimmel & Jonäll 2013; Romi & Longing 2016). The quality of biodiversity reporting has not been considered in detail. This research addresses this gap.
The aim of this article is to examine biodiversity reporting by South African food producers and harvesters, focusing specifically on seafood production and consumption. Drawing on the prior corporate social responsibility (CSR), (Laine 2009b; Michelon, Pilonato & Ricceri 2015) and integrated reporting research (Atkins and Maroun 2015; Stent & Dowler 2015), the study develops a normative scorecard that is used to evaluate the quality of biodiversity disclosures. This complements the biodiversity reporting research that has neglected one of Africa's largest economies and biodiversity regions (Jones & Solomon 2013; Mansoor & Maroun 2016). It also adds to the body of integrated reporting research that deals in detail with the proliferation of environmental, social and governance (ESG) disclosures by leading South African corporations (e.g. see De Villiers & Van Staden 2006; PwC 2015; Raemaekers, Maroun & Padia 2016; Solomon & Maroun 2012) but stops short of focusing specifically on biodiversity reporting. Finally, although this article examines the quality of a specific type of environmental reporting by a relatively small group of companies, it provides a basis for future researchers wishing to deal more generally with the quality of non-financial reporting by companies.
The remainder of this article is structured as follows. The section 'A brief note on the state of South Africa's marine biodiversity' provides a brief context of South Africa's marine biodiversity. 'Biodiversity reporting' and 'Method' outline the prior research on biodiversity reporting and develop a biodiversity reporting framework that is used to evaluate the quality of biodiversity reporting in the chosen sub-sector of the South African food industry. The 'Results' section presents the findings. The last section concludes and identifies areas for future research.
A brief note on the state of South Africa's marine biodiversity
South Africa is among the world's most biodiverse regions. It is made up of nine biomes, some of which are home to unique plant and animal species (Mayes 2012; Wynberg 2002). This biodiversity is, however, under threat because of climate change, expanding human populations and unsustainable use of natural resources (Daly & Friedmann 2016; Endangered Wildlife Trust [EWT] 2016). South Africa's marine territories have been particularly hard hit by over-fishing which has placed populations of key species under pressure and threatened the sustainability of the local seafood industry (Brookbanks 2012; Petersen 2016; Planet Earth Herald 2016).
It is estimated that approximately 61% of the world's fish stocks are fully exploited and that 29% of fish stocks are over-exploited. Alarmingly, 63% of fish stocks need to be protected to allow populations to recover and to prevent the complete collapse of vulnerable species (World Wildlife Fund South Africa [WWF-SA] 2014, 2016). For South Africa in particular, abalone, rock lobster and several line fish species have been overfished, a problem compounded by the growing prevalence of illegal harvesting (Department of Agriculture Forestry and Fisheries [DAFF] 2014; WWF-SA 2014).
These trends pose a significant risk for the South African economy. Commercial fisheries create an estimated 27 000 jobs and generate over ZAR5 billion (USDF560 million) in revenue per annum (WWF-SA 2016). From a social perspective, the oceans are an important source of food, providing an estimated 17% of average protein intake (WWF-SA 2014). As a result, a number of environmental agencies (including government departments) and non-governmental organisations (NGOs) have reacted to the threats posed to South Africa's marine biodiversity. The most prominent agencies include the EWT, DAFF, the Marine Stewardship Council (MSC), the South African National Biodiversity Institute (SANBI) and WWF-SA.
The DAFF was formed in 2009 to oversee and support the agricultural, forestry and fishery sectors through sustainable policies and programmes. DAFF is involved in monitoring sustainable fishing practices including, in particular, the enforcement of the Fishing Rights Allocation Process (FRAP) that regulates the harvest of fish stocks. DAFF also provides advice on utilisation of fish resources and marine ecosystem conservation (DAFF 2017). Its work is supported by SANBI which conducts biodiversity research and monitors biodiversity levels in South Africa. SANBI is also concerned with ecosystem restoration and rehabilitation in order to curb the effects of unsustainable natural resource consumption (SANBI 2017).
From an NGO perspective, the MSC is involved in the certification and labelling of seafood that is designed to promote consumer awareness about species threatened by overfishing and to change consumption patterns. The MSC also works closely with harvesters to encourage the use of sustainable fishing methods and manage their business needs to ensure long-term supply of fish stocks (MSC 2015). This is similar to the WWF-SA which seeks to conserve biodiversity and ensure the sustainable development of local ecosystems. The WWF-SA works to improve communities dependent on natural resources, protect biodiversity by encouraging companies and individuals to be more environmentally responsible and, ultimately, ensure healthy oceans and sustainable populations of fish species (WWF-SA 2017). The most notable effort in this regard is the Southern African Sustainable Seafood Initiative (SASSI).
Launched in 2004, SASSI seeks to raise awareness about growing seafood sustainability concerns and the absence of a clear position by harvesters and retailers on ensuring that seafood was being sourced responsibly. SASSI has resulted in a significant change to the industry. It has highlighted biodiversity concerns to consumers who, in turn, are demanding action by suppliers and retailers. These organisations have responded with clear commitments to ensure environmental responsibility and the incorporation of the applicable biodiversity risks into their corporate strategies (SASSI 2016).
Biodiversity reporting
The last 20 years has seen a steady increase in the range of environmental data being included in sustainability and integrated reports (PwC 2014, 2015) and, to a lesser extent, details on biodiversity conservation and management (Atkins & Maroun 2018; Jones & Solomon 2013; Mansoor & Maroun 2016). According to the GRI (2007):
Biodiversity is the variability among living organisms from all sources, including, inter alia, terrestrial, marine and other aquatic ecosystems and the ecological complexes of which they are part, this includes diversity within species, between species and of ecosystems. (p. 11)
Elements of biodiversity reporting
To provide a detailed account of how an organisation is managing its biodiversity impact, the GRI recommends that a company report on different biodiversity indicators. These are summarised in Table 1.

The disclosures recommended by the GRI are similar to those found in the prior biodiversity reporting research (see Jones & Solomon 2013; Mansoor & Maroun 2016) which suggests that companies provide a descriptive account of the species and habitats affected by their operations (Van Liempd & Busch 2013), paying particular attention to animal populations and ecosystems under pressure because of human activity (Atkins et al. 2015b). These can be complemented by 'scene-setting disclosures' that include a clear explanation of what a company understands about biodiversity, its biodiversity mission statement or policy and an explanation of any affiliations with applicable environmental groups, NGOs or research communities (Jonäll & Rimmel 2016; Mansoor & Maroun 2016; Van Liempd & Busch 2013). Additional detail can be provided on specific engagements with these groups, including partnerships, conservation initiatives and any advice provided on how to make business models more sustainable (partnership engagements). Companies in the food industry are also likely to interact with local communities, governments and consumers on their operating practices and the extent to which these conform to recommended environmental practices. Details on these social engagements should also be reported (stakeholder engagement) (Jonäll & Rimmel 2016; Rimmel & Jonäll 2013).
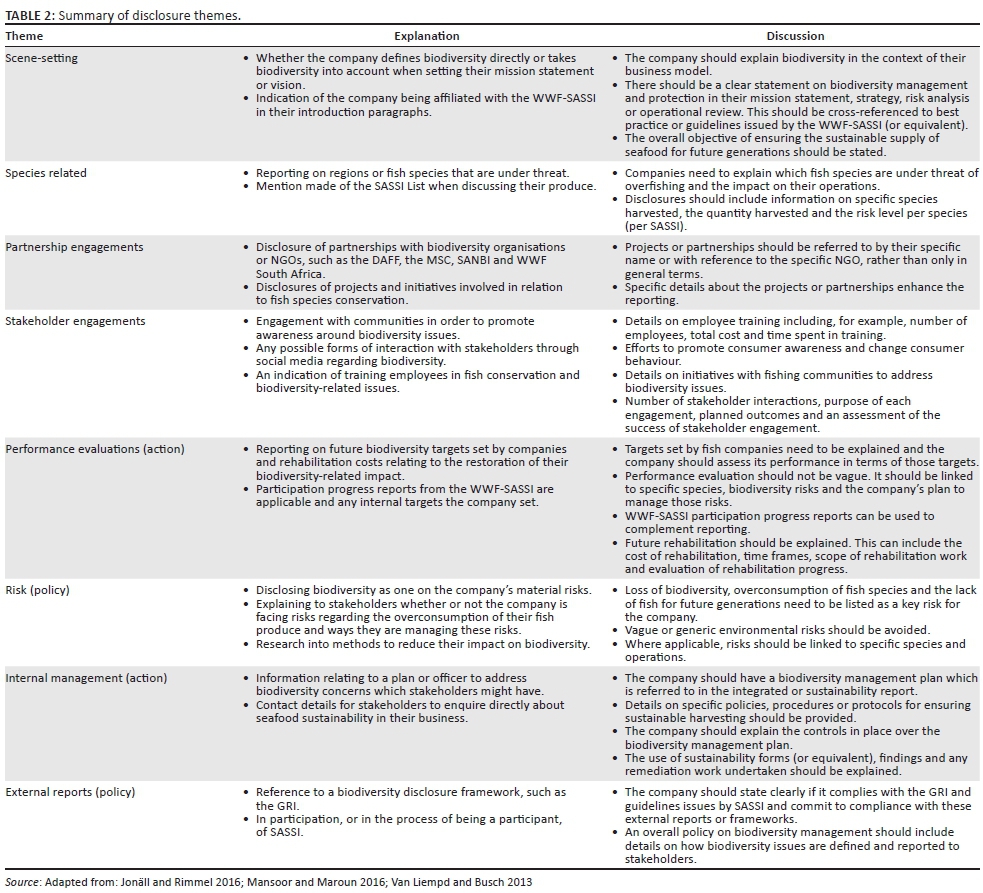
For a company's account of biodiversity impact to be more than just policy-focused, providing feedback on how it has performed against biodiversity targets, rehabilitation costs incurred and the successes and challenges of its partnerships with NGOs and environmental agencies are important (performance evaluation reporting) (Atkins et al. 2015a; Atkins & Maroun 2018). This should be supported by a clear explanation of the risks posed by biodiversity loss (risk reporting) and specific actions or plans used to mitigate or manage these risks (internal management reporting) (Hossain 2017; Van Liempd & Busch 2013). A company can support its biodiversity risk management with details recommended by the GRI and its involvement in specific environmental initiatives such as its participation on the SASSI project (WWF-SA 2016). Each of the disclosure elements or themes is explained in Table 2.
To ensure high-quality reporting, a company needs to comply with the relevant external reporting frameworks and ensure that it has policies in place to identify biodiversity-related risks and report on them effectively (Jones & Solomon 2013). Under the GRI's principle of clarity, this requires providing sufficient information on how the company defines and measures biodiversity risk, the species affected by operations and how the company is managing its biodiversity impact (see GRI 2007, 2016). This requires detailed reporting on, for example, which species of fish are at risk of being over-exploited; the assessed impact of over-exploitation on the business model and how the company plans to reduce the use of that species (Atkins et al. 2016b. This can include the use of NGOs and active engagement with key stakeholders to, for example, assess biodiversity risks more accurately, make recommendations on how to improve harvesting methods or review the sustainability of operations (Atkins & Maroun 2018; De Villiers & Maroun 2018). Finally, high-quality biodiversity reporting needs to be supported by an effective internal management function which provides the policies, procedures, operating standards and controls for sustainable harvesting of seafood and ensures that the disclosures included in an integrated or sustainability report are not just rhetoric (see Alrazi, De Villiers & Van Staden 2015; McNally, Cerbone & Maroun 2017).
Assessing the quality of biodiversity disclosures
Assessing the quality of biodiversity reporting based on the themes provided in Table 2 is both complex and subjective. To provide an easy-to-use disclosure framework or scorecard to assess the quality of biodiversity reporting, this research draws on the prior CSR literature that points to the following quality dimensions, each of which is adapted for assessing biodiversity disclosures:
-
a quantity indicator (QI) - a measure of the total amount of information provided on biodiversity according to a defined reporting framework (see Beretta & Bozzolan 2004; Wolniak & Hąbek 2016)
-
a density indictor - the total biodiversity reporting relative to the length of the integrated or sustainability report (see Dagiliene, Leitoniene & Grencikova 2014; Michelon et al. 2015).
-
an emphasis indicator (EI) - an assessment of the perceived relevance of biodiversity reporting as indicated by the extent of disclosures included a corporation's primary rather than complementary reports to stakeholders (De Villiers & Van Staden 2011).
-
an action indicator (AI) - the extent to which disclosures deal with actions, plans and projects designed to mitigate the risk of biodiversity loss rather than just descriptive, policy or compliance-related disclosures (Cho et al. 2015; Freundlieb, Gräuler & Teuteberg 2014; Michelon et al. 2015).
-
an assurance indicator (ASI) - this takes into account whether or not companies make use of any independent assurance services for their sustainability reporting (Jones & Solomon 2010; Michelon et al. 2015). This would include, by default, details on biodiversity.
Quantity indicators
According to Beretta and Bozzolan (2004), the quality of disclosure 'depends on both the quantity of information disclosed and on the richness offered by additional information' (p. 266). Providing detailed disclosures on key ESG issues ensures that stakeholders are provided with sufficient information to understand the relevant risks and how these are being managed (GRI 2016). High levels of ESG reporting can also be used to signal that a company understands its environmental and social impact, has developed the relevant systems to monitor and report on this and is taking appropriate action to respond to underlying risks (see Beretta & Bozzolan 2004; De Villiers & Maroun 2018; Dube & Maroun 2017; Wolniak & Hąbek 2016). This is, however, provided that the disclosures deal specifically with the relevant ESG issues and are presented clearly in corporate reports (Atkins & Maroun 2014; Michelon et al. 2015).
In this context, the simplest indicator of biodiversity reporting quality is provided by a measure of the extent to which each of the biodiversity themes according to Table 2 are covered in annual, integrated and sustainability reports. The indicator focuses only on biodiversity-specific reporting and disclosures that deal directly with biodiversity risks related to the seafood industry (see Michelon et al. 2015; Romi & Longing 2016). To calculate a QI, the total number of biodiversity disclosure themes is expressed as a percentage of the total number of themes that are expected to be included in the corporate's reports. For a company preparing an integrated and sustainability report, this is expressed as follows:
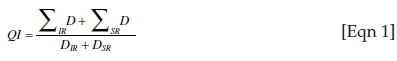
where QI is the measure of disclosure quantity, ΣIR D is the number of disclosure themes per Table 2 addressed in the integrated report, ΣSR D is the number of disclosure themes per Table 2 addressed in the sustainability report and DIR and DSR denote the total possible biodiversity disclosures (being eight themes in the integrated report and eight themes in the sustainability report). A QI equal to 1 means that the biodiversity metrics referred to by the GRI and prior literature (per Table 2) have been addressed. This implies1 a high level of quality. Conversely, a score of 0 indicates low quality.
Density indicator
The increase in the extent of environmental reporting does not necessarily mean that companies are providing more useful information to users of integrated or sustainability reports (Michelon et al. 2015). For example, an analyses of South African-integrated reports have found that, while more detail on ESG issues is being provided to users, this information is often repetitive or generic and, as a result, unhelpful for understanding the respective organisations' environmental impact (see PwC 2015; Solomon & Maroun 2012). In addition, an increase in the extent of reporting can make it difficult for stakeholders to identify the most pertinent information or be used obfuscated negative facts and circumstances or divert attention (Cho, Roberts & Patten 2010; Michelon et al. 2015). To address this, we calculate a density index (DI). This can be carried out at the level of individual words, sentence or phrases (Michelon et al. 2015). As a practical expedient, the DI is calculated with reference to the number of pages in the integrated or sustainability report dealing with biodiversity-related issues relative to the total number of pages found in these documents.

where DI is the measure of disclosure density, ΣIR PB is the number of pages in the integrated report that contain information dealing with biodiversity metrics and ΣSR PB is the total number of pages in the sustainability report that contain information dedicated to biodiversity issues. The total numbers of pages in the integrated and sustainability report are denoted by PIR and PSR, respectively.2 A DI close to 1 implies that there is little dilution and that biodiversity-related disclosures are not being repeated in multiple sections of the integrated and sustainability report, implying a higher level of quality. A score tending to zero suggests low quality.
Emphasis indicator
When voluntary disclosure is necessary for reducing information asymmetry, lowering the cost of capital or responding to the most material information needs of important stakeholders, the disclosures are normally concentrated in the corporation's primary report (De Villiers & Van Staden 2011). In contrast, disclosures that are required only for addressing a general expectation for, at least, some reporting on the respective metric are likely to be included mainly in secondary reports or on webpages (De Villiers & Van Staden 2011; Michelon et al. 2015). The same principle applies for evaluating biodiversity reporting by South African companies. Companies that see biodiversity metrics as material should include this information in their primary report to stakeholders, this being the integrated report (see Mansoor & Maroun 2016; Rensburg & Botha 2014). We therefore calculate a ratio of the total biodiversity disclosures included in companies' integrated reports, relative to the total biodiversity disclosures found in the sustainability reports to measure an emphasis quality dimension:

where EI is the emphasis indicator, ΣIR is the total biodiversity disclosures included in a company's integrated report and ΣSR is the total disclosure included in the same company's sustainability report. An EI tending to 1 represents a higher level of reporting quality. A minimum score of zero implies low quality.
Action indicator
Biodiversity reporting can be focused on policy-related issues and form part of a broader environmental rhetoric without resulting in actual changes to business practices (Cho et al. 2015; Tregidga, Milne & Kearins 2014). To address this, we differentiate between biodiversity reporting that is descriptive, compliance-focused or related only to policy (organisational rhetoric) and disclosures on specific plans, actions or projects (organisational action) (see Table 3).
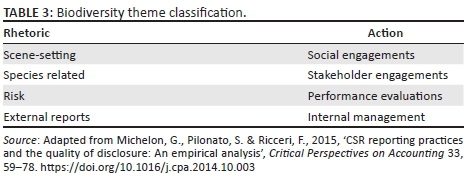
An AI is used to measure the emphasis on action-focused reporting relative to policy-related information or organisational rhetoric. This is calculated as follows:

The sum of action-related biodiversity disclosure in the integrated ΣIR A and sustainability report ΣsR A is expressed as a sum of the action and rhetoric-related disclosure in both documents. The total score is averaged. A score tending to 1 implies that most reporting focuses on details on different partnerships, stakeholder engagement and internal plans for managing biodiversity loss rather than, for example, on general details on biodiversity policy, affected species and compliance with external reporting frameworks. This is indicative of higher quality reporting. Conversely, a score tending to zero implies that most disclosure is at the level of organisational rhetoric and that reporting quality is therefore low (see Beretta & Bozzolan 2004; Cho et al. 2015).
Assurance indicator
Finally, a comprehensive measure of report quality takes into account whether or not a company relies on independent external assurance services. Presently, companies do not provide external assurance on the validity and reliability of their integrated or sustainability reports as a whole or on whether or not their environmental plans and actions are adequate to prevent biodiversity loss (see Farooq & De Villiers 2018; Maroun 2017). Nevertheless, elements of their sustainability or integrated reports may be assured by an independent practitioner. Examples include historical and factual data such as carbon emissions, populations of species and compliance with the GRI (Jones & Solomon 2010; Maroun & Atkins 2015). These assurance services are typically associated with higher levels of reporting quality, even though they are not mandated (Michelon et al. 2015). As a result, our quality index (QIND) includes an ASI that is '1' if at least some sustainability assurance services are relied on and '0' if this is not the case.
Final quality index
The final QIND is calculated as follows:

A score tending to 5 indicates high biodiversity reporting quality and a score of zero implies low quality reporting. The index is an inferred measure of quality but is a useful way of evaluating non-financial disclosures without overemphasising the high levels of disclosures that may not necessarily provide useful information to users of an integrated or sustainability report (Michelon et al. 2015). Table 4 summarises the elements in the final quality index.
Method
To apply the QIND outlined in the 'Biodiversity reporting' section, the research focuses on companies listed on the Johannesburg Stock Exchange (JSE) and included in the farming and fishing sector. Companies not involved with the harvesting or sale of seafood were excluded. This left a total of seven companies for review.3
The relatively small sample size may appear to be an inherent limitation of this research. It is a function of the size of the local industry and is also in keeping with an exploratory research design. The aim is not to extrapolate results, generalise findings and confirm or reject hypotheses. The study is interpretive. It demonstrates how a mix of quantitative and narrative information on biodiversity can be summarised by a normative QIND that can be used to evaluate the development of biodiversity reporting and, by default, other types of non-financial disclosures included in integrated or sustainability reports.
Data collection
The researchers analysed the companies' integrated and sustainability reports from 2013 to 2015. The 2016 and 2017 reports were not available at the time of data collection. Periods prior to the introduction of the International Integrated Reporting Council's (IIRC) framework (in 2013) were excluded. This ensured that the basis being used to prepare the corporate reports included in the study was consistent.
The researchers used content analysis, a method that is commonly used to study ESG disclosures (Merkl-Davies, Brennan & Vourvachis 2011; Michelon et al. 2015). Data collection began with the lead researcher reading each report to gain a sense of its overall content and structure. Following a similar approach to Rimmel and Jonäll (2013) and Mansoor and Maroun (2016), sections of the reports dealing with issues relating to biodiversity were then identified and analysed in more detail to identify specific words, sentences or paragraphs that dealt with the biodiversity. For this purpose, the disclosure themes per Table 2 ('Elements of biodiversity reporting' section) were used as codes:
-
scene-setting
-
species related disclosures
-
partnership engagements
-
stakeholder engagements
-
performance evaluations
-
risk or policy disclosures
-
internal management
-
external reports.
Specific disclosures found in the integrated or sustainability reports were flagged and grouped according to which of the disclosure themes or codes these related to. A score of zero or one was used to indicate the absence or presence of a specific disclosure per code or disclosure theme. Results were aggregated in a frequency table. Once this was done, the disclosure could be analysed according to the QIND elements. For this purpose, the location of disclosures (in the integrated or sustainability report), whether or not the disclosure was action- or policy-orientated, the presence or absence of an external assurance report and the number of pages in the integrated and sustainability reports were also recorded.
For example, the researcher identified a paragraph in one of the sustainability reports under review on fishing quotas. The disclosure was examined carefully. It contained three sentences that explained different species of fish affected by the quota and an arrangement with an NGO to prevent over-exploitation. The disclosure was coded as species-related and partnership engagement. The frequency table recorded a score of 2 (quantity element). The two disclosure themes were recorded as being located in the sustainability report (emphasis element). The first theme was rhetoric-focused because it dealt only with the species of fish affected by over-exploitation. Details on the work performed with the NGO to ensure responsible harvesting (the second disclosure theme) were recorded as action-orientated (action element). The disclosure was located on a single page in the sustainability report. There were no other biodiversity disclosures on that page. A score of 1 was recorded for the purpose of calculating the density element. The assurance element was only assessed in total once all of the disclosures were coded and scored according to the other quality elements.
It should be noted that data collection was carried out in the interpretive tradition, with the result that the coding is dependent on the lead researcher's judgement and, as a result, is inherently subjective (adapted from Laine 2009a). As a result, once all of the integrated and sustainability reports were coded, the researchers re-examined the reports to ensure that the data had been coded consistently. No changes to the original coding were made as a result of this review. In addition, to ensure that all relevant disclosures were identified, the lead researcher performed a third analysis of each report and also performed a key word search. Examples included: biodiversity, conservation, fish, marine, SASSI,4 WWF and total allowable catch (TAC).5 This revealed no additional disclosures and did not result in any changes to the original coded results.
Data analysis
As the study focuses only on reports issued from 2013 to 2015, when there were no material changes to local codes of governance and reporting frameworks, an analysis of changes in disclosures over time was excluded. An average disclosure score was computed for the 3 years for each disclosure theme. Once this was complete, the lead researcher was able to calculate each of the indicators included in the QIND discussed in the 'Biodiversity reporting' section and compute a total quality score. The results are presented in the 'Results' section.
To provide additional information of the types of disclosures evaluated and scored, the researchers included specific examples of biodiversity disclosures found in the integrated and sustainability reports being reviewed. The examples were selected based on an interpretive analysis of the integrated or sustainability reports by the lead researcher and according to the disclosure theme or code to which they related (see above). They were chosen to provide clear illustrations of the disclosure elements being examined and add to the depth of analysis of the quality of biodiversity reporting (see Merkl-Davies et al. 2011; Solomon & Maroun 2012).
Finally, the researchers acknowledge that the analysis process is inherently subjective. This subjectivity is a characteristic of interpretive-inspired research and, far from being a threat to validity and reliability, was essential for evaluating qualitative or narrative disclosures typically included in the integrated and sustainability reports being reviewed (see Laine 2009b; Maroun & Jonker 2014; Tregidga et al. 2014).
Results
The total biodiversity-related disclosures included in the integrated and sustainability reports for the 3 years under review are shown in Figure 1.
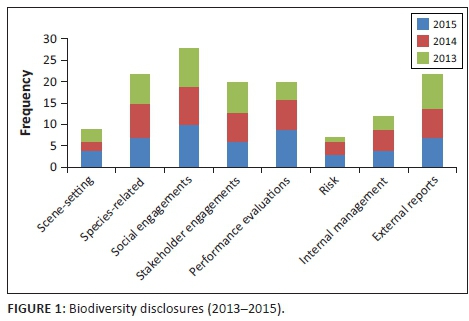
In total, there are 50 biodiversity-related issues disclosed in 2015 compared with 48 and 42 disclosures in 2014 and 2013, respectively. Social engagements account for 20% of the 140 disclosures over the 3-year period. This is followed by species-related disclosures and details on external reports that account for 16% of total disclosures each. Risk (6%) and scene-setting disclosures (5%) had the lowest scores. On average, companies include only seven disclosures per annum in their integrated and sustainability reports combined. This low level of reporting is consistent with the findings of Van Liempd and Busch (2013), Mansoor and Maroun (2016) and Romi and Longing (2016) and implies that biodiversity reporting is underdeveloped or marginalised (Jones & Solomon 2013; Maroun 2016). The quantity of disclosures is not, however, a definitive indication of the quality of biodiversity reporting. As a result, the researchers calculated a QIND score presented in Figure 2.

When the low level of biodiversity reporting (QI) is assessed relative to the other quality indicators, the results are more positive. Figure 2 shows that half of the companies have a QIND of 2.7 or more. The most material contributors to the QIND are the EI, AI and ASI. Each of these is discussed in more detail below.
Assurance indicator
None of the companies under review provides direct assurance over their biodiversity reporting including, for example, assurance on the adequacy of their risk assessment, action plans and environmental impact (see Cohen & Simnett 2015; Maroun 2017). Five of the companies did, however, rely on an independent assurance provider to test some elements of their sustainability reporting. This typically involved compliance with the GRI and provides, at least, indirect evidence of the quality of the biodiversity elements which the GRI recommends should be included in a sustainability or integrated report (Jones & Solomon 2010; Michelon et al. 2015).
Emphasis indictor
The EI is inherently subjective. The fact that companies tend to include more of their biodiversity reporting in their integrated rather than their sustainability report does not prove that the disclosures are of a high quality (see De Villiers & Van Staden 2011). Nevertheless, an analysis of the specific types of disclosures found in integrated reports suggests, at least, some commitment to biodiversity conservation. For example, one company acknowledges clearly its responsibility for the environment in context of a business model dependent on harvesting marine resources:
'Beyond integrity and transparency in our dealings with our shareholders, customers, consumers, employees and other stakeholders, this also encompasses a commitment to ensuring that [the company] plays its role as a corporate citizen to minimise any adverse environmental impact…' [Company 1, Integrated report 2015]
Similarly, a second company establishes sound biodiversity management as part of its overall strategy:
'Mission statement: To be the leading empowered fishing and commercial cold storage company in Africa… Responsibly harvesting a diverse range of marine resources.' [Company 4, Integrated Report 2014]
As indicated in Figures 1 and 2, the scene-setting and risk themes had two of the lowest disclosure scores. The companies under review do not provide a clear definition of 'biodiversity', lists of affected species and a breakdown of biodiversity impact by geographical or operating segment (Van Liempd & Busch 2013; GRI 2016). Explicit statements on the risks posed by biodiversity loss are also limited (Mansoor & Maroun 2016; Raemaekers et al. 2016). As such, the extent to which biodiversity is being incorporated into an integrated assessment of companies' business models can be questioned. It may, however, be premature to conclude that current biodiversity reporting is not providing any relevant information for users of integrated reports. There are indications of companies beginning to frame the risk of fish species becoming extinct (an otherwise biological issue) as a material business risk. For example:
'Our material risks: Our variation/depletion in availability of marine resources.' [Company 4, Integrated Report 2015]
Similarly, as part of the risk review sections of its corporate reports, Company 5 states:
'We drive change throughout our seafood supply chain to mitigate risks of over-fishing.' [Company 5, Sustainability Report 2015]
These illustrations should be interpreted in the context of an overall low QI and DI and the fact that some companies (such as Companies 5 and 7) reported relatively low EIs. This reflects the fact that risk disclosures were often generic, a clear biodiversity management plan was not apparent and there were indications that disclosures were compliance-focused, rather than the result of a complete commitment to change business practices (see Mansoor & Maroun 2016; Raemaekers et al. 2016). In addition, while some companies dealt with biodiversity-related issues at the strategic level or as part of their risk management plans in their integrated reports, others placed more emphasis on general environmental disclosures in their sustainability reports (see Cho et al. 2015; De Villiers & Van Staden 2006). As a result, the researchers examined the focus on reporting on specific actions, plans and projects designed to mitigate biodiversity impact to gain a better sense of reporting quality.
Action indicator
Favouring disclosures in a sustainability report (leading to a low EI) often occurred in conjunction with more narrative or disruptive reporting, rather than details on the specific actions, projects or initiatives used to manage biodiversity risks (leading to a low AI). There are, however, some exceptions. Consider the following example of how a company improves the detail provided on its internal management plans relating to overfishing:
'While [the company] takes care to minimise its impact on the environment, certain risk factors are beyond our direct control and can affect performance. [The company] has a detailed plan on how to address the impact within its control and influence and manage the factors outside its control.' [Company 4, Sustainability Report 2013]
The organisation acknowledges the biodiversity-related risk and makes reference to the need to mitigate it but the details are limited and the disclosure is an example of biodiversity rhetoric rather than of biodiversity action. By 2015, however, the disclosure is more extensive. A detailed analysis of performance is not provided but the company outlines the broad elements or component of its biodiversity management plan:
-
Obtaining independent research reports of the resources in order to monitor the status of the resources
-
Compliance with the regulatory framework
-
Complying with responsible fishing practices
-
Training crew on responsible fishing practices. [Company 4, Sustainability Report 2015]
There are also examples of quantified commitments to different conservation projects driven by some of the environmental groups discussed in 'A brief note on the state of South Africa's marine biodiversity' section:
'Since 2010 we have invested R13.5 million in the World Wildlife Fund's Sustainable Fisheries Programme. (By year-end 45% of our seafood products by species, and 87% of these products by sales, met our seafood sustainability targets).' [Company 5, Integrated Report 2015]
Similarly:
'The [company] entered into a relationship with WWF's Southern African Sustainable Seafood Initiative (SASSI) in December 2010. The initiative is aligned to the [company's] sustainable business strategy, in which the group commits to:
-
Driving innovation in our house brands to reduce the environmental impact of their full lifecycles
-
Raising awareness and improving education around sustainability issues within our own organisation, our retailers' businesses and our own communities
-
Engaging and collaborating with our suppliers and retailers to ensure that their business practices are ethical and environmentally sustainable.' [Company 6, Integrated Report 2014]
Another company focuses on its use of internal sustainability champions to create an awareness of biodiversity-related initiatives and to provide staff with an opportunity to provide feedback:
'One of the [sustainability champion's] main responsibilities is to share monthly [sustainability] newsletters with their colleagues during a Let's Talk meeting. These discussions aim to provide colleagues with the opportunity to grasp issues such as climate change, water scarcity, food security and biodiversity, and learn how [the company] is tackling some of these issues.' [Company 7, Sustainability Report 2013]
These disclosures need to be improved. For example, it would be useful to know the level of financial commitments to partnerships; exactly how the companies' brands and internal processes are being revised, the successes and challenges of any education initiatives and the specific outcomes from supplier, staff and community engagement. For these reasons, the AI scores of these companies do not equal the maximum. What is, however, encouraging is that, despite the relatively low quantum of disclosure (QI < 0.5), the companies provide some insight into their partnership with environmental groups and some detail on how they are reacting to the risks posed by overfishing and associated biodiversity loss.
As a final illustration of action-related reporting, some companies are starting to include biodiversity-related performance-measures in their corporate reports. For example, dealing with environmental audits carried out by NGOs, one company comments:
'Annual progress against agreed targets for key environmental initiatives, the company's participation in external accreditation surveys and the results of health and safety and environmental audits of company sites and vessels were reviewed and found to be satisfactory.' [Company 4, Integrated Report 2014]
A second company reports on its harvesting of a specific species over the 3 years under review and the need to ensure that this did not result in undue pressure on fish stocks. In the 2015 integrated report, the company concludes:
'In May 2015 the Marine Stewardship Council ('MSC') recertified that the South African hake resources met the requisite environmental standards for sustainable fishing for a further five years. This certification gives assurance to buyers and consumers that the seafood comes from a well-managed and sustainable resource, which is increasingly relevant in [the company's] export markets.' [Company 1, Integrated Report 2015]
The above disclosure is a good example of how a company has partnered with an NGO to provide an independent review of its harvesting process and how this accreditation process is used to reassure customers (and other stakeholders) about the long-term sustainability of the seafood supply. As indicated, it can be argued that the disclosure could be bolstered by, for example, providing quantified measures of harvested seafood, number of certificates issued, specific feedback received from the NGO and any plans to change operating practices. At the same time, the illustration (coupled with the AI score) gives a good indication that companies are becoming more aware of biodiversity management and reporting.
Conclusion
Prior studies on the extent of biodiversity reporting in developed economies in Europe (Rimmel & Jonäll 2013), the United Kingdom (Jones 1996) and USA (Romi & Longing 2016) find low levels of disclosures that often give only a high level account of biodiversity risk and impact (Jones & Solomon 2013). To some extent, these findings are applicable in a South African context where a review of integrated and sustainability reports by a sample of the country's seafood producers and retailers finds low levels of reporting on biodiversity-related issues. This is despite the important contribution of South Africa's marine resources to the economy (WWF-SA 2016) and the country's leading role in championing codes of corporate governance and reporting standards designed to emphasise the importance of the environment for generating responsible returns (Maroun, Coldwell & Segal 2014; Rossouw, Van der Watt & Malan 2002; Solomon 2010). An examination of the quality - rather than the quantity - of disclosures presents a different perspective.
Drawing on the prior CSR and integrated reporting literature (see, e.g., Cho et al. 2015; De Villiers et al. 2018; Freundlieb et al. 2014; Michelon et al. 2015), this research makes an important contribution by proposing a scorecard for calculating a QIND for biodiversity disclosures. Based on the work of Michelon et al. (2015), the index includes a measure of the total and relative quantify of disclosure (QI and DI). This is complemented by a review of whether or not the disclosures are included in the primary report to stakeholders (EI), the focus on reporting on policies or general biodiversity detail or specific plans of action (AI) and the use of independent assurance services to address the quality of sustainability reporting in general (ASI).
The quality index reveals a number of important findings. The quantity of reporting is low (average QI = 0.42) and not always discussed in detail in the different sections of the integrated and sustainability reports (average DI = 0.39) but this does not mean that South African harvesters and retailers are completely marginalising biodiversity risk. There has been a shift in reporting emphasis with companies including relatively more detail in their integrated reports rather than in complementary sustainability reports (average EI = 0.75). Arguably, the disclosures included in integrated reports do not provide a complete account of biodiversity risk, how this links to an organisation's strategy and steps being taken to reduce biodiversity impact. This is in line with prior research on environmental and social reporting by South African companies in general which finds that local organisations are taking time to understand their non-financial impact and explain this clearly and comprehensively in their integrated reports (Atkins & Maroun 2015; PwC 2014; Solomon & Maroun 2012). Nevertheless, there are indications that non-financial reporting practices (De Villiers, Rinaldi & Unerman 2014), including biodiversity reporting (Atkins et al. 2016a), are improving. The companies under review are relying on sustainability assurance services, pointing to a higher level of reporting quality in general (Michelon et al. 2015). Companies are also complementing descriptive biodiversity information with commitments to reduce their biodiversity impact and details on partnerships formed with NGOs to assist with management of their biodiversity footprint (see Atkins et al. 2015b, 2016a; Jonäll & Rimmel 2016). Perhaps, most important are disclosures dealing with different plans, actions and conservation initiatives being implemented in response to the risks associated with biodiversity loss. This suggests that companies' biodiversity reporting is not only rhetoric (average AI = 0.44); there is room for improvement but companies are beginning to realise the importance of supporting policy statements with details on action to manage biodiversity risk.
To avoid losing momentum, companies need to be provided with more detailed guidance on how to interpret and define biodiversity risks, assess their impact and incorporate biodiversity issues in long-term business strategies. This needs to be supported by the development of a framework for how management and corporate reporting systems can be enhanced to enable biodiversity protection. Examples include how operations can be tailored to reduce biodiversity impact, the type of data that should be collected to monitor these changes and how best to explain internal developments to stakeholders.
Finally, it should be noted that the findings presented in this article are not without limitations. The results are based on a relatively small number of companies and focus on a very specific section of the broader food industry. More research is needed to understand the extent and quality of biodiversity reporting in other sectors with a high environmental impact before definitive conclusions can be reached. This can be complemented by an expanded analysis of biodiversity reporting in South Africa and how it compares with other developed and developing economies. Apart from providing additional empirical evidence on biodiversity reporting, more is required to be done at a practical and theoretical level. This article is limited to the development of a normative scorecard for evaluating the quality of biodiversity reporting. Future research can concentrate on the drivers of biodiversity reporting and how, for example, organisational systems, the availability of resources and attitudes or cultures affect the commitment to high-quality biodiversity (and other types of non-financial reporting) (Alrazi et al. 2015; De Villiers, Rouse & Kerr 2016). Perhaps, most important is the need for additional research on the role which accounting can play in preserving biodiversity. The current body of research on biodiversity reporting takes the position that biodiversity is under threat and that associated risks should be reported in the interest of transparency and accountability (Jonäll & Rimmel 2016; Maroun 2016; Romi & Longing 2016). Examining how the process of accounting for biodiversity may be used to create an awareness of biodiversity loss, change organisational dynamics and begin to have a positive effect on biodiversity conservation can contribute significantly to the understanding of how accounting functions. This avenue of research may also create an opportunity for accountants to participate in the conversation process rather than in after-the-fact reporting on continuing environmental degradation.
Acknowledgements
The authors would like to thank the participants at the Meditari Accountancy Research Conference (2016) for their comments on earlier drafts of this article. In particular, the authors would like to acknowledge the support received from Prof. Jill Atkins, Prof. Robert Garnett, Prof. Nirupa Padia and Lelys Maddock. Special thanks also go to the National Research Foundation for partially funding this project.
Competing interests
The authors declare that they have no financial or personal relationship(s) that may have inappropriately influenced them in writing this article.
Authors' contributions
This article was developed jointly by the authors and based on the postgraduate thesis of the first author.
References
Adler, R., Mansi, M. & Pandey, R., 2018, 'Biodiversity and threatened species reporting by the top Fortune Global companies', Accounting, Auditing & Accountability Journal, viewed n.d., from https://doi.org/10.1108/AAAJ-03-2016-2490 [ Links ]
Alrazi, B., De Villiers, C. & Van Staden, C.J., 2015, 'A comprehensive literature review on, and the construction of a framework for, environmental legitimacy, accountability and proactivity', Journal of Cleaner Production 102, 44-57. https://doi.org/10.1016/j.jclepro.2015.05.022 [ Links ]
Atkins, J., Barone, E., Gozman, D., Maroun, W. & Atkins, B., 2015a, 'Exploring rhinoceros conservation and protection: Corporate disclosures and extinction accounting by leading South African companies', in Meditari Accountancy Research, Meditari Accountancy Research, Forli, Italy, 02 July. [ Links ]
Atkins, J., Gozman, E., Maroun, W. & Atkins, B., 2015b, 'Exploring accountability for rhinoceros conservation and protection: The Emergence of "Extinction Accounting"?', in 27th International Congress on Social and Environmental Accounting Research, Centre for Social and Environmental Accounting Research, Egham, UK, 27th August. [ Links ]
Atkins, J., Barone, E., Maroun, W. & Atkins, B., 2016a, 'Bee accounting and accountability in the UK', in K. Atkins & B. Atkins (eds.), The business of bees: An integrated approach to bee decline and corporate responsibility, pp. 201-234, Greenleaf Publishers, Sheffield, UK. [ Links ]
Atkins, J., Barone, E., Maroun, W. & Atkins, B., 2016b, 'From the Big Five to the Big 4? Exploring extinction accounting for the rhinoceros', in GARI Conference, April 18, 2016, Henley-on-Thames, United Kingdom. [ Links ]
Atkins, J. & Maroun, W., 2014, South African institutional investors' perceptions of integrated reporting, ACCA, The Association of Chartered Certified Accountants, London. [ Links ]
Atkins, J. & Maroun, W., 2015, 'Integrated reporting in South Africa in 2012: Perspectives from South African institutional investors', Meditari Accountancy Research 23(2), 197-221. https://doi.org/10.1108/MEDAR-07-2014-0047 [ Links ]
Atkins, J. & Maroun, W., 2018, 'Integrated extinction accounting and accountability: building an ark', Accounting, Auditing & Accountability Journal, viewed n.d., from https://doi.org/10.1108/AAAJ-06-2017-2957 [ Links ]
Beretta, S. & Bozzolan, S., 2004, 'A framework for the analysis of firm risk communication', The International Journal of Accounting 39(3), 265-288. https://doi.org/10.1016/j.intacc.2004.06.006 [ Links ]
Brookbanks, A., 2012, Overfishing in SA, Live Eco, viewed 25 February 2017, from http://www.liveeco.co.za/2012/06/04/overfishing-in-sa/ [ Links ]
Cho, C.H., Laine, M., Roberts, R.W. & Rodrigue, M., 2015, 'Organized hypocrisy, organizational façades, and sustainability reporting', Accounting, Organizations and Society 40, 78-94. https://doi.org/10.1016/j.aos.2014.12.003 [ Links ]
Cho, C.H., Roberts, R.W. & Patten, D.M., 2010, 'The language of US corporate environmental disclosure', Accounting, Organizations and Society 35(4), 431-443. https://doi.org/10.1016/j.aos.2009.10.002 [ Links ]
Cohen, J.R. & Simnett, R., 2015, 'CSR and assurance services: A research agenda', AUDITING: A Journal of Practice & Theory 34(1), 59-74. https://doi.org/10.2308/ajpt-50876 [ Links ]
Dagiliene, L., Leitoniene, S. & Grencikova, A., 2014, 'Increasing business transparency by corporate social reporting: Development and problems in Lithuania', Engineering Economics 25(1), 54-61. https://doi.org/10.5755/j01.ee.25.1.2356 [ Links ]
Daly, B. & Friedmann, Y., 2016, Red data book of the mammals of South Africa: A conservation assessment, viewed 05 May 2017, from http://www.nationalredlist.org/files/2012/11/red-data-book-mammals-south-africa-conservation-assessment.pdf [ Links ]
De Villiers, C. & Maroun, W., 2018, Sustainability accounting and integrated reporting, Taylor & Francis, Oxfordshire, UK. [ Links ]
De Villiers, C., Rinaldi, L. & Unerman, J., 2014, 'Integrated reporting: Insights, gaps and an agenda for future research', Accounting, Auditing & Accountability Journal 27(7), 1042-1067. https://doi.org/10.1108/AAAJ-06-2014-1736 [ Links ]
De Villiers, C., Rouse, P. & Kerr, J., 2016, 'A new conceptual model of influences driving sustainability based on case evidence of the integration of corporate sustainability management control and reporting', Journal of Cleaner Production 136(A), 78-85. [ Links ]
De Villiers, C., Rouse, P. & Kerr, J., 2016, 'A new conceptual model of influences driving sustainability based on case evidence of the integration of corporate sustainability management control and reporting', Journal of Cleaner Production. https://doi.org/10.1016/j.jclepro.2016.01.107 [ Links ]
De Villiers, C. & Van Staden, C.J., 2006, 'Can less environmental disclosure have a legitimising effect? Evidence from Africa', Accounting, Organizations and Society 31(8), 763-781. https://doi.org/10.1016/j.aos.2006.03.001 [ Links ]
De Villiers, C. & Van Staden, C.J., 2011, 'Where firms choose to disclose voluntary environmental information', Journal of Accounting and Public Policy 30(6), 504-525. https://doi.org/10.1016/j.jaccpubpol.2011.03.005 [ Links ]
Department of Agriculture Forestry and Fisheries (DAFF), 2014, Status of the South African marine fishery resources, Cape Town, South Africa, viewed 20 November 2016, from http://www.nda.agric.za/doaDev/sideMenu/fisheries/03_areasofwork/Resources %20Research/STATUS% 20OF%20THE%20SOUTH%20AFRICAN%20MARINE% 20FISHERY%20RESOURCES%202014%20WEB.pdf [ Links ]
Department of Agriculture Forestry and Fisheries (DAFF), 2017, Vision and mission, viewed 07 January 2017, from http://www.daff.gov.za/daffweb3/About-Us/Vision-and-Mission [ Links ]
Dube, S. & Maroun, W., 2017, 'Corporate social responsibility reporting by South African mining companies: Evidence of legitimacy theory', South African Journal of Business Management 48(1), 23-34. [ Links ]
Dumay, J., Guthrie, J. & Farneti, F., 2010, 'Gri sustainability reporting guidelines for public and third sector organizations', Public Management Review 12(4), 531-548. https://doi.org/10.1080/14719037.2010.496266 [ Links ]
Endangered Wildlife Trust (EWT), 2016, 'Reassessing the red data list of mammals for South Africa', viewed from https://www.ewt.org.za/scientific%20publications/Red%20Data%20List.pdf [ Links ]
European Commission, 2015, Fisheries, TACs and quotas, viewed 24 June 2015, from http://ec.europa.eu/fisheries/cfp/fishing_rules/tacs/index_en.htm [ Links ]
Farooq, M.B. & De Villiers, C., 2017, 'The market for sustainability assurance services: A comprehensive literature review and future avenues for research', Pacific Accounting Review 29(1), 79-106. https://doi.org/10.1108/PAR-10-2016-0093 [ Links ]
Freundlieb, M., Gräuler, M. & Teuteberg, F., 2014, 'A conceptual framework for the quality evaluation of sustainability reports', Management Research Review 37(1), 19-44. https://doi.org/10.1108/MRR-04-2012-0087 [ Links ]
GRI, 2007, Biodiversity: A GRI reportingresource, viewed 01 August 2014, from http://www.globalreporting.org/resourcelibrary/Biodiversity-A-GRI-Resource-Document.pdf [ Links ]
GRI, 2016, Consolidated set of GRI sustainability reporting standards (2016), viewed 12 December 2016, from https://www.globalreporting.org/standards/gri-standards-download-center/?g=ae2e23b8-4958-455c-a9df-ac372d6ed9a8 [ Links ]
Hossain, M.M., 2017, 'Accounting for biodiversity in Australia: The case of the Murray-Darling Basin Authority', Pacific Accounting Review 29(1), 2-33. https://doi.org/10.1108/PAR-03-2016-0033 [ Links ]
Hughen, L., Lulseged, A. & Upton, D., 2014, 'Improving stakeholder value through sustainability and integrated reporting', CPA Journal March, 57-61. [ Links ]
Jonäll, K. & Rimmel, G., 2016, 'Corporate bee accountability among Swedish companies', in K. Atkins & B. Atkins (eds.), The business of bees: An integrated approach to bee decline and corporate responsibility, pp. 301-319, Greenleaf Publishers, Sheffield, UK. [ Links ]
Jones, M.J., 1996, 'Accounting for biodiversity: A pilot study', The British Accounting Review 28(4), 281-303. https://doi.org/10.1006/bare.1996.0019 [ Links ]
Jones, M.J. & Solomon, J.F., 2010, 'Social and environmental report assurance: Some interview evidence', Accounting Forum 34(1), 20-31. https://doi.org/10.1016/j.accfor.2009.11.002 [ Links ]
Jones, M.J. & Solomon, J.F., 2013, 'Problematising accounting for biodiversity', Accounting, Auditing & Accountability Journal 26(5), 668-687. https://doi.org/10.1108/AAAJ-03-2013-1255 [ Links ]
Laine, M., 2009a, 'Ensuring legitimacy through rhetorical changes? A longitudinal interpretation of the environmental disclosures of a leading Finnish chemical company', Accounting, Auditing & Accountability Journal 22(7), 1029-1054. https://doi.org/10.1108/09513570910987367 [ Links ]
Laine, M., 2009b, 'Towards sustaining the status Quo: Business talk of sustainability in Finnish Corporate disclosures 1987-2005',. European Accounting Review 19(2), 247-274. https://doi.org/10.1080/09638180903136258 [ Links ]
Mansoor, H. & Maroun, W., 2016, 'An initial review of biodiversity reporting by South African corporates - The case of the food and mining sectors', South African Journal of Economic and Management Sciences 19(4), 592-614. https://doi.org/10.4102/sajems.v19i4.1477 [ Links ]
Marine Stewardship Council (MSC), 2015, Marine Stewardship Council - Certified sustainable seafood, viewed 03 April 2015, from https://www.msc.org/ [ Links ]
Maroun, W., 2016, 'No bees in their bonnet: On the absence of bee reporting by South African listed companies', in K. Atkins & B. Atkins (eds.), The business of bees: An integrated approach to bee decline and corporate responsibility, pp. 317-325, Greenleaf Publishers, Sheffield, UK. [ Links ]
Maroun, W., 2017, 'Assuring the integrated report: Insights and recommendations from auditors and preparers', The British Accounting Review 49(3), 329-346. https://doi.org/10.1016/j.bar.2017.03.003 [ Links ]
Maroun, W. & Atkins, J., 2015, The challenges of assuring integrated reports: Views from the South African auditing community, The Association of Chartered Certified Accountants, London. [ Links ]
Maroun, W., Coldwell, D. & Segal, M., 2014, 'SOX and the transition from apartheid to democracy: South African auditing developments through the lens of modernity theory', International Journal of Auditing 18(3), 206-212. https://doi.org/10.1111/ijau.12025 [ Links ]
Maroun, W. & Jonker, C., 2014, 'Critical and interpretive accounting, auditing and governance research in South Africa', Southern African Journal of Accountability and Auditing Research 16, 51-62. [ Links ]
Mayes, D., 2012, Pollinators in Africa: Understanding is the first step to protecting, viewed 12 December 2016, from http://biodiversityadvisor.sanbi.org/wp-content/uploads/2012/11/Pollinators-in-Africa.pdf [ Links ]
McNally, M.-A., Cerbone, D. & Maroun, W., 2017, 'Exploring the challenges of preparing an integrated report', Meditari Accountancy Research 31(3), 240-254. [ Links ]
Merkl-Davies, D., Brennan, N. & Vourvachis, P., 2011, 'Text analysis methodologies in corporate narrative reporting research', 23rd CSEAR International Colloquium, St Andrews, United Kingdom. [ Links ]
Michelon, G., Pilonato, S. & Ricceri, F., 2015, 'CSR reporting practices and the quality of disclosure: An empirical analysis', Critical Perspectives on Accounting 33, 59-78. https://doi.org/10.1016/j.cpa.2014.10.003 [ Links ]
Petersen, S., 2016, Marine environment, Enviropedia, viewed 24 November 2016, from http://www.enviropaedia.com/topic/default.php?topic_id=155 [ Links ]
Planet Earth Herald, 2016, No fish left In 50 years from now, viewed 27 March 2016, from http://planetearthherald.com/no-fish-left-in-50-years-from-now/ [ Links ]
PwC, 2014, The Value Creation Journey: A survey of JSE Top-40 companies' Integrated reports, viewed 07 August 2015, from http://www.pwc.co.za/en/assets/pdf/integrated-reporting-survey-2014.pdf [ Links ]
PwC, 2015, Integrated reporting where to next?, viewed 16 February 2016, from http://www.pwc.co.za/en/assets/pdf/integrated-reporting-survey-2015.pdf [ Links ]
Raemaekers, K., Maroun, W. & Padia, N., 2016, 'Risk disclosures by South African listed companies post-King III', South African Journal of Accounting Research 30(1), 41-60. https://doi.org/10.1080/10291954.2015.1021583 [ Links ]
Rensburg, R. & Botha, E., 2014, 'Is integrated reporting the silver bullet of financial communication? A stakeholder perspective from South Africa', Public Relations Review 40(2), 144-152. https://doi.org/10.1016/j.pubrev.2013.11.016 [ Links ]
Rimmel, G. & Jonäll, K., 2013, 'Biodiversity reporting in Sweden: Corporate disclosure and preparers' views', Accounting, Auditing & Accountability Journal 26(5), 746-778. https://doi.org/10.1108/AAAJ-02-2013-1228 [ Links ]
Romi, A. & Longing, S., 2016, 'Accounting for bees: Evidence from disclosures by US listed companies', in K. Atkins & B. Atkins (eds.), The business of bees: An integrated approach to bee decline and corporate responsibility, pp. 1-19, Greenleaf Publishers, Sheffield, UK. [ Links ]
Rossouw, G.J., Van der Watt, A. & Malan, D.P., 2002, 'Corporate governance in South Africa', Journal of Business Ethics 37(3), 289-302. https://doi.org/10.1023/A:1015205511601 [ Links ]
SASSI, 2016, How SASSI helps, viewed 07 January 2017, from http://wwfsassi.co.za/how-sassi-helps/ [ Links ]
Solomon, J., 2010, Corporate governance and accountability, 3rd edn., John Wiley and Sons Ltd., West Susex, UK. [ Links ]
Solomon, J. & Maroun, W., 2012, Integrated reporting: The new face of social, ethical and environmental reporting in South Africa? ACCA, The Association of Chartered Certified Accountants, London. [ Links ]
South African National Biodiversity Institute (SANBI), 2017, About SANBI, viewed 07 January 2017, from http://www.sanbi.org/about [ Links ]
Stent, W. & Dowler, T., 2015, 'Early assessments of the gap between integrated reporting and current corporate reporting', Meditari Accountancy Research 23(1), 92-117. https://doi.org/10.1108/MEDAR-02-2014-0026 [ Links ]
Tregidga, H., Milne, M. & Kearins, K., 2014, '(Re)presenting "sustainable organizations"', Accounting, Organizations and Society 39(6), 477-494. https://doi.org/10.1016/j.aos.2013.10.006 [ Links ]
Van Liempd, D. & Busch, J., 2013, 'Biodiversity reporting in Denmark', Accounting, Auditing & Accountability Journal 26(5), 833-872. https://doi.org/10.1108/AAAJ:02-2013-1232 [ Links ]
Wolniak, R. & Hąbek, P., 2016, 'Quality assessment of CSR reports-Factor analysis', Procedia-Social and Behavioral Sciences 220, 541-547. https://doi.org/10.1016/j.sbspro.2016.05.530 [ Links ]
World Wildlife Fund South Africa (WWF-SA), 2014, WWF-SASSI Retailer/supplier participation scheme report 2014, viewed from http://www.wwf.org.za/media_room/publications/?12201/WWF-SASSI-Retailer-Supplier-Participation-Scheme-Report-2014 [ Links ]
World Wildlife Fund South Africa (WWF-SA), 2016, Ocean facts and futures: Valuing South Africa's ocean economy, viewed from http://awsassets.wwf.org.za/downloads/wwf_oceans_facts_and_futures_ report_oct16.pdf [ Links ]
World Wildlife Fund South Africa (WWF-SA), 2017, Our goals, viewed 07 January 2017, from http://www.wwf.org.za/what_we_do/our_goals/ [ Links ]
Wynberg, R., 2002, 'A decade of biodiversity conservation and use in South Africa: Tracking progress from the Rio Earth Summit to the Johannesburg World Summit on Sustainable Development', South African Journal of Science 98(5&6), 223-243. [ Links ]
 Correspondence:
Warren Maroun
warren.maroun@wits.ac.za
Received: 26 May 2017
Accepted: 28 Sept. 2017
Published: 03 Apr. 2018
1. We say 'imply' because the quantity indicator by itself only considers whether the disclosure themes are included in the integrated or sustainability report and not whether sufficient detail has been provided to explain the biodiversity impact. As a result, we use additional quality indicators to refine the measure of quality as per Michelon et al. (2015).
2. No adjustment is made for the number of times the same or different biodiversity theme is dealt with per page in an integrated report. As a result, using the number of pages to calculate the density indicator is less accurate than using individual words, sentences or disclosure themes. This was, however, a practical limitation given the large volume of data that would need to be processed if the density indictor is calculated by coding each word, sentence or disclosure theme in the integrated and sustainability reports (see Michelon et al. 2015).
3. One company's integrated and sustainability reports included no biodiversity-related disclosures. As a result, it was treated as an outlier and excluded from the analysis.
4. The SASSI provides information, through the SASSI list, about certain fish species and their consumption (SASSI 2016).
5. Total allowable catch is a catch limit set for commercial fish stocks (European Commission 2015).

