


Services on Demand
Article
 English (pdf)
 Article in xml format
 Article references
Indicators

Related links
-
 Cited by Google
 -
 Similars in Google
Share

 Permalink
South African Journal of Economic and Management Sciences
On-line version ISSN 2222-3436
Print version ISSN 1015-8812
S. Afr. j. econ. manag. sci. vol.20 n.1 Pretoria 2017
http://dx.doi.org/10.4102/sajems.v20i1.1644
ORIGINAL RESEARCH
Chief Executive Officer and Chief Financial Officer compensation relationship to company performance in state-owned entities
Mark H.R. Bussin; Marvin Ncube
Gordon Institute of Business Science, University of Pretoria, South Africa
ABSTRACT
BACKGROUND: Optimal contracting continues to dominate boardroom and dinner discussions worldwide in light of the 2008 global financial crisis and especially in South Africa, due to the growing income gap. Increased scrutiny is being placed on South African state-owned entities (SOEs), as a result of the seemingly poor performance of SOEs. Some of the SOEs are reported to have received financial bailouts from taxpayers' money, while executives are raking in millions of rands in remuneration, provoking some concerns on the alignment of executive pay to company performance in SOEs.
AIM: The study will assist remuneration committees and policymakers in the structuring of executive pay in SOEs to ensure alignment to company performance.
SETTING: The study sought to assess, based on empirical evidence, if there is a positive relationship between Chief Executive Officer (CEO) and Chief Financial Officer (CFO) remuneration and company performance in South African SOEs in the period between 2010 and 2014. All 21 Schedule 2 SOEs were included in the study.
METHODS: The research was a quantitative archival research methodology. Correlation and multiple regression analysis were the main statistical techniques used in this study.
RESULTS: Contrary to popular media, a positive relationship between CEO and CFO remuneration (fixed pay and short-term incentives) and company performance in SOEs was observed. Company size appears to be the key determiner of fixed pay in SOEs. The positive relationship was mainly noted on absolute profitability measurements like EBITDA (earnings before interest and tax and depreciation and amortisation) and net profit.
CONCLUSION: SOE remuneration committees and policymakers should maintain the positive relationship; however, more emphasis should be placed on financial efficiency measurements so as to enhance efficiencies in SOEs.
Introduction
The executive remuneration of South African state-owned entities (SOEs) has come under increasing scrutiny because of their perceived poor performance and as a result of being in a country with one of the worst economic inequalities in the world (Naidoo 2012). The increasing income gap in South Africa between rich and poor split along racial lines has resulted in numerous questions being raised about the seemingly excessive top management remuneration. Naidoo (2012) cites a 2012 Price Waterhouse Coopers report stating that executive directors of large-capital companies earn on average R10m/year (R4m/year guaranteed package, R2m performance bonus and R4m in share plan benefits). In contrast, SA's lowest-paid workers earn around R3500 per month or R42 000 per year. This equates to a pay gap of 250-300 times. It is no different in SOEs. The average pay gap ratio between Eskom's top management and workers is 93:9 (Naidoo 2012).
Globally, the executive remuneration debate has intensified following the 2008 global financial crisis as bankers were seen to have given themselves excessive remuneration, despite the poor performance of the institutions (Choe, Tian & Yin 2014). Equally, SOEs have not been immune to this debate. For example, the Spanish government in 2012 announced that it was cutting executive pay by up to 35% for companies supported by taxpayers' money in order for the executives to share in the pain of austerity measures (Tremlett 2012). Furthermore, the Chinese government announced it would be cutting the salaries of the top executives in Banks and SOEs in order to reduce inequality (Wright 2015). The State-Owned Assets Supervision Commission of China recently called for all SOE salaries to be strictly linked to business performance, it emphasised that salary increases should be in line with the increases in company profits (Juan 2015).
Some authors have questioned whether the exponential growth in executive compensation in the past two decades is consistent with shareholder interests (Bebchuk & Fried 2004; Jensen & Murphy 1990). Chief Executive Officer (CEO) compensation is crucial in mitigating the potential conflict of interest between executives and shareholders, as it is used as an instrument of aligning shareholders' and executives' interests (Ozkan 2011). Prior studies by Murphy (1999); Core, Guay and Larcker (2003); Jensen, Murphy and Wruck (2004) and Devers et al. (2007) conducted on mostly listed companies, have not been consistent on the impact of executive compensation on company performance. The studies have raised doubt on the ability of executive compensation to align with shareholder and executive interests.
The debates on executive compensation have essentially been split into two seemingly competing views. The first view contends that executive compensation is a result of efficient bargaining between executives and shareholders to mitigate the agency-principal problem, commonly referred to as the optimal contracting approach. The competing view contends that executive compensation is a result of 'greedy' powerful executives who essentially extract rents from companies and thus set their own pay, commonly referred to as the managerial power approach. These seemingly contrasting views have resulted in the ongoing debate on whether executive pay is linked to organisational performance, in line with the optimal contracting approach. The concept of pay for performance has largely been led by Jensen and Murphy (1990). In South Africa, there is growing discontent regarding executive compensation in SOEs, in light of the seemingly poor performance by the SOEs. Some of the SOEs, like the South African Broadcasting Corporation Limited (SABC) and South African Airways (Pty) Limited (SAA), have been reported in the media to be receiving or have received Government bailouts, yet the company executives are said to be raking in millions in salaries and bonuses (Business Tech 2014).
Most of the literature reviewed has focused primarily on the relationship between executive pay and company performance in listed companies. Academic literature relating to pay for performance relationships in SOEs is scarce. Most of the executive pay studies in SOEs have been done on listed Chinese SOEs and these studies have generally been inconclusive. It is therefore crucial to understand how South African SOEs set compensation packages and how they are linked to company performance, considering the critical developmental role that these organisations play in the economy and the importance of these entities to remain sustainable.
Research questions
Based on popular media reports and current debates between policymakers and academics, there appears to be a disconnection between executive remuneration and SOE performance. The aim of this study is to contribute to the literature relating to executive pay for performance in SOEs, especially unlisted SOEs in developing countries, where policymakers, academics and the general public have been debating the link between CEO pay to company performance. The following are the research questions:
Research question one
Is there a positive relationship between CEO and Chief Financial Officer (CFO) fixed pay and company performance over the period 2010-2014 in South African Schedule 2 SOEs?
Research question two
Is there a positive relationship between CEO and CFO short-term incentive payout and company performance over the period 2010-2014 in South African Schedule 2 SOEs?
Research question three
Which individual company performance measure is the best predictor of the CEO and CFO fixed pay component of compensation over the period 2010-2014 in South African Schedule 2 SOEs?
Research question four
Which individual company performance measure is the best predictor of the CEO and CFO short-term incentive component of compensation over the period 2010-2014 in South African Schedule 2 SOEs?
Literature review
Chief Executive Officer and Chief Financial Officer responsibilities
According to Shaw (2012), the CEO's main responsibility is to manage company resources within the context of a dynamic external environment in order to create value for the shareholders. Friedman (2014) states that the CFO's responsibility is to oversee and manage information and reporting systems. The author also notes that, while the CFO has a fiduciary duty to the shareholders and the board, he also reports to the CEO.
The SOX Act requires that the CFO and CEO certify the financial reports of companies listed in United States. In South Africa, the Companies Act of 2008, which came into effect on the 1 May 2011 requires that both the CEO and CFO certify the financial statements (Republic of South Africa 2011). Moreover, the CEO and CFO are the two executives who are generally the members of the company board in South African SOEs. This fact elevates the power and importance of CFOs beyond that of other executives. According to Hambrick and Quigley (2014), executives play a critical role in a company as they substantially shape the fate of companies. The CEO and CFO can be viewed as shareholder agents; thus, their primary role is to protect and grow shareholder value.
Company performance measurement
Bussin (2015) notes that there are three different measurements of company performance, that is, absolute financial performance measures (verified measures of performance within a specific year), financial performance ratios derived from absolute financial performance measures and market performance measures, assessed through the share price performance of the company. Various agency theorists argue that multiple performance measurements can be used by principals in an optimal contract, for the principals to be able to fully understand the effort put in by the agent in achieving shareholder value.
Conyon and He (2014) posit that once principals have a full understanding of the performance measurements that best reflect the agent's effort, more sensible and precise measures can be consistently used in the optimal contract as an indication of the agent's effort.
Goergen and Renneboog (2011) and Bussin (2015) argue that accounting-based performance measurements measure past performance and are subject to manipulation and thus might not be appropriate in determining executive past performance as rent-seeking CEOs are prone to manipulating the accounting measurements in order to achieve higher bonuses, evidenced by accounting scandals at Enron and Worldcom. According to Goergen and Renneboog (2011) and Wang and Xiao (2011), the most common accounting measures used to assess company performance are revenue, operating income or profit and earnings per share (EPS). However, based on literature reviewed, there appears to be no consensus on measuring company performance as various authors have used various measures of absolute financial performance to assess company performance in the pay to performance studies. Shaw (2012) used profit after tax, earnings before interest and tax and depreciation and amortisation (EBITDA), return on equity (ROE) and headline earnings per share (HEPS) in order to assess company performance, while Bussin and Nel (2013) used ROE, asset turnover, profit margin and leverage in order to assess company performance. Van Blerck (2013) used economic value added (EVA), share price performance and ROE. Theku (2014) used ROE, return on assets (ROA), Asset Turnover, Revenue, HEPS, change in share price and market capitalisation as measurements of company performance. Bussin and Modau (2015) used market value added, EVA, ROE and EPS.
State-owned entities
There is no comprehensive legislative definition of national or provincial SOEs in the South African statues (Bronstein & Olivier 2015). The starting point for defining national or provincial SOEs is the PFMA Act 1 of 1999, which lists public entities in Schedules 2 and 3. Major public entities like Eskom, Transnet and Telkom are listed in Schedule 2. According to 'Introduction' section of the PFMA Act 1 of 1999, national public entities are defined as government business enterprises or an entity that is substantially funded from tax revenues or levies or other statutory funds. Thus, government business enterprises are more self-sufficient and commercial than the remainder of the ordinary entities. Most of the entities that are substantially funded from tax revenues are classified under Schedule 3 entities, while major government business enterprises are classified as Schedule 2 enterprises. Most of the Schedule 2 SOEs have come under scrutiny in recent years in the media because of the seemingly excessive executive salaries in spite of the poor performance of the SOEs.
According to Thomas (2012), SOEs primarily drive a developmental agenda in developing countries through the provision of basic services such as water and electricity, and thus profit maximisation is not their main goal. However, Thomas (2012) notes that the funding model prevalent at most of the major SOEs is generally profit driven, which is at odds with the provision of basic resources at the lowest cost possible to the populace. It is this conflict between social objective versus the profit motive that raises debates on executive remuneration in SOEs, that is, whether the executive compensation should be based on company performance measured through accounting measurements or the company achieving its social objectives. However, it is apparent that for the SOEs to remain financially sustainable, a closer alignment of pay for performance is necessary.
Pay for performance relationship
Agency theory suggests that a high pay-performance relationship motivates top executives to enhance their input and improve corporate performance (Amzaleg et al. 2014). Numerous studies relating to the relationship between CEO pay and company performance have been done in South Africa. A study by Shaw (2012) on executive pay to performance relationship in the South African financial industry over a 6-year period (2005-2010) noted a moderate to strong relationship between CEO remuneration and company performance. However, the study noted that the moderate to strong relationship noted was in decline during periods of economic downturn, and thus, CEOs tended to use managerial power in uncertain economic periods to draw high pay than for their pay to be in accordance with the company performance. Moreover, Shaw (2012) observed a shift from variable pay to fixed pay in the remuneration structure of CEOs as a result of the declining company performance. The restructuring of the CEO remuneration results in a lower pay to performance relationship as most of the variable pay is linked to company performance.
In a study by Bussin and Nel (2015) on the pay to performance sensitivity in the South African retail and consumer goods industry over a 6-year period (2006-2011), the authors observed a weak relationship between CEO pay and company performance, based on Du Pont analysis measurements. A negative relationship was noted between CEO guaranteed pay versus ROE. Thus, Bussin and Nel (2015) note that there is no alignment between CEO compensation and company performance in this industry.
A study by Van Blerck (2013) supported the findings by Shaw (2012) as Van Blerck (2013) noted in the study of the relationship between executive remuneration and company performance based on EVA over a 10-year period (2002-2011) that, unlike United States, South African banks showed a strong positive relationship between executive pay and company performance and this could serve to explain why South African banks survived the 2008 financial crisis.
Theku (2014) also supported the findings by Shaw (2012), Van Blerck (2013) in the study of 30 South African mining companies listed on the Johannesburg Stock Exchange (JSE) over a period of 5 years (2009-2013). In the study, the author noted that in most of the mining companies there was a moderate to strong relationship between CEO remuneration and company performance. Furthermore, Bussin and Modau (2015) supported the observations by Shaw (2012), Van Blerck (2013) and Theku (2014), in the study of executive remuneration relationship to company performance in 26 firms listed on the JSE over a 7-year period (2006-2012). In the study, Bussin and Modau (2015) noted that there was a positive relationship between CEO pay and company performance based on ROE. However, similar to observations by Shaw (2012), Bussin and Modau (2015) observed that during periods of economic uncertainty, such as after the 2008 financial crisis, there has been a restructuring of CEO remuneration among firms. Post 2008, most of the variable pay linked to company performance has been restructured to be fixed, thus resulting in a declining correlation between CEO pay and company performance.
Approaches and theories
Corporate governance
Corporate governance is defined as a collection of rules and policies, which affect how a company is controlled or monitored (Donaldson 2012). Corporate governance serves to ensure that executives are working mainly for the benefit of shareholders by trying to increase the economic value of the firm (Chalevas 2011). Conyon and He (2011) also support the above view, as they note that, according to various studies by Hölmstrom (1979), Holmstrom and Milgrom (1991) and Core and Guay (1999), agency theory predicts that incentive remuneration and monitoring are substitute mechanisms that together mitigate agency problems. Conyon and He (2011) note in their study that the relationship between executive pay and firm performance is driven by the strength of internal corporate governance mechanisms, mainly being the monitoring by shareholders and boards of directors. In addition, Dicks (2012) notes in his study that governance mitigates agency costs, by allowing firms to reduce incentive compensation and thus pay executives in line with company performance, limiting rent extraction by powerful CEOs.
In South Africa, according to the Institute of Directors Southern Africa (2017), the code that drives governance of executive compensation is King IV. According to Bussin (2015), a critical requirement by the code is the requirement that CEO remuneration be linked to company performance.
Even though the code is not legally enforceable as it is a code of practice, it appears to have a significant impact on how South African companies, including SOEs, set their executive remuneration (Bussin 2015). The code also recommends that every company should ideally have a minimum of two executive directors as part of its board of directors, being the CEO and CFO.
Composition of Chief Executive Officer compensation
According to Goergen and Renneboog (2011), the amount and composition of the compensation package is important for motivating and aligning executives with shareholders' interests. Compensation packages normally consist of the following: base salary, pension, insurance, bonus, severance package and long-term benefits like shares or share options (Goergen & Renneboog 2011). Goergen and Renneboog (2011) posit that the following is considered with regards to the following compensation components:
-
• Base Salary - In setting the base salary, the authors note that the compensation committee takes into account some of the factors such as the experience, seniority and firm size of the company. According to Bussin (2015), base salary is viewed as a risk-free monthly payment as this is normally not linked to company performance. In addition, Bussin (2011) notes that the base salary includes allowances such as travelling, entertainment and telephone and it also includes company benefits, such as pension and the guaranteed annual bonuses, commonly referred in South Africa as the 13th Cheque.
-
• Bonus - This represents the annual bonus that is mainly based on the company performance of the previous financial year. Based on previous studies, company performance is mainly based on financial performance (accounting and market). The bonus is normally referred to as a short-term incentive as this is based on annual performance.
-
• Long-term benefits - This normally includes share options, shares and long-term bonuses, which are based on company performance over more than a year.
-
• Severance and retirement package - Companies award this to executives, so as to encourage shareholder wealth maximisation without any job loss concerns by the executives. Among the major South African SOEs, only Telkom is listed, thus most of the executive remuneration in SOEs exclude the long-term benefits, such as shares and share options.
Research design
A quantitative deductive research methodology was used in this study. The study was longitudinal, covering the period 2010-2014 financial years and followed an archival research strategy. The financial data used were obtained from published financial statements of the SOEs. All the SOEs have a common financial year-end that is 31st of March. Thus, no adjustments had to be done to the financial information to ensure comparability and analysis. The quantitative deductive research methodology approach enables the testing of the relationship between CEO and CFO remuneration with company performance.
Population and sample
This study focused on entities listed in Schedule 2 of the PFMA Act as these entities are more commercially oriented and thus have a profit objective. The executive compensation of Schedule 2 SOEs is expected to be aligned to company financial performance. The list shown in Table 1 is a list of the Schedule 2 entities. All the entities, including the subsidiary companies are included in the study.

Unit of analysis
The CEO and CFO total remuneration includes the Fixed and Variable portion of remuneration. Bussin (2011) notes that fixed pay includes basic salary and employee benefits, for example, all allowances, guaranteed annual bonuses (13th Cheque) and car and housing benefits and employer contributions, while variable pay includes short-term incentives such as performance bonuses. Fewer than five companies were noted to be paying long-term bonuses; thus, long-term bonuses were excluded for the purposes of this study.
Company performance
According to Theku (2014), two key performance measures are commonly used to assess company performance. These are market-related performance measurements, for example, change in share price and accounting-related performance measurements, and for example, change in net profits. Because SOEs are not listed companies, only account ing measures of performance can be used to assess the company performance. The company information that was used to assess company performance, measured through 10 accounting performance metrics based on prior pay for performance relationship studies, was ROE, ROA, liquidity, revenue growth, EBITDA margin, net profit margin, revenue amount, EBITDA amount, net profit amount and total assets.
Data collection and analysis
The source of the data used in this study was the published annual reports of the Schedule 2 SOEs. Once the financial statements were obtained, the company financial information as stated above, that is, the remuneration of the CEO and CFO and the relevant financial performance information, was captured onto an excel spreadsheet. Some of the descriptive statistics were done using excel functionalities and the rest of the descriptive statistics, for example, calculating mean, minimum and maximum were done using the Statistical Package for Social Sciences (SPSS 2012) software package. In addition, SPSS (2012) was also used to perform correlation statistical analysis in order to test the strength of the relationship between remuneration and company performance measured as per the accounting measures mentioned above for the CEO and CFO. Because of the statistical analysis required to be performed on the data, the data were tested for normal distribution using the Shapiro-Wilks test as the sample size was small. Based on the Shapiro-Wilks test, the data were observed not to be normally distributed. As a result, non-parametric testing was performed to test for differences between the financial years for all the variables (company performance measures and remuneration components).
According to Pallant (2013), the Kruskal-Wallis Test allows comparison of scores on a continuous variable for three or more groups. The Kruskal-Wallis test was performed to test for differences between the financial years. Following the test for normality and the comparison test, the data were observed to be positively auto-correlated and thus in order to test which company performance measurement is the best predictor of the CEO and CFO fixed pay and short-term incentive, a multiple regression analysis using the Cochrane-Orcutt estimation method was performed.
Empirical results and discussion
Descriptive statistics
The study included all the SOEs listed as Schedule 2 entities. There are 21 Schedule 2 entities.
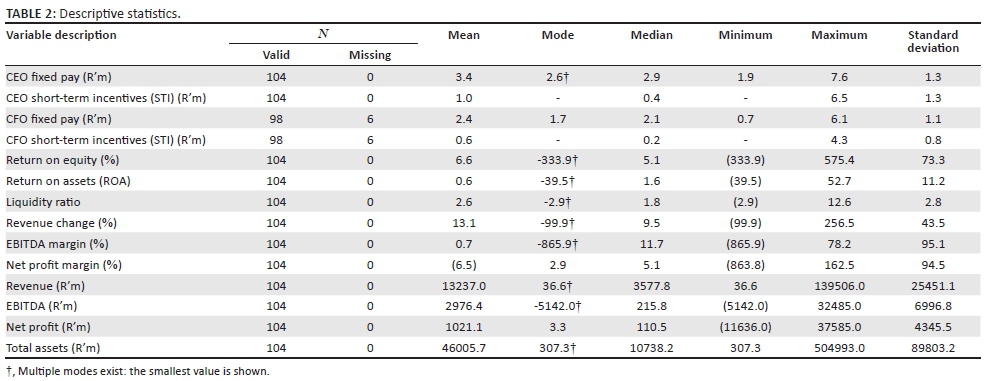
Because of the small number of Schedule 2 entities, all Schedule 2 entities were included in the sample. Only Schedule 2 entities were included in the sample as these are the major SOEs and these SOEs are expected to be self-sustainable, thus remuneration is expected to be linked to company performance. Of the 21 SOEs, only 4 SOEs had no change in CEO over the study period (2010-2014) and only 6 SOEs had no change in CFO over the study period (2010-2014). Thus, the bulk of the SOEs had more than one CEO or CFO over the study period. In a case where a CEO or CFO was in the position for few months of the financial year, the few months fixed pay was extrapolated for 12 months. No extrapolation was, however, done on short-term incentives as this was expected to be aligned to company performance. The total number of cases included in the study was 104, being 21 SOEs over a period of 5 years (20102014). At the time of the study, SA Express had not published the 2014 financial year results, thus only 2010-2013 results for SA Express were included in the study. Table 2 shows a summary of the descriptive statistics relating to the sample included in the study.
As shown in Table 2, they were six missing data points relating to CFO fixed pay and CFO STI relating to two SOEs (Alexkor (SOC) Limited and CEF (SOC) Limited). The information relating to the above two SOEs was not disclosed in the relevant financial years and, as a result, was excluded from this study. Each variable in Table 2 is discussed below under the company performance measures and remuneration measures.
Research question 1
This research question sought to assess if there is a positive relationship between fixed pay for the CEO, CFO and company performance measures. The positive relationship between fixed pay and company performance was tested using SPSS (2012) correlation analysis. It was observed in the correlation analysis results that with the exception of the ROA measure, the company performance measures that had a relationship with CEO Fixed Pay and CFO Fixed Pay were similar. Thus, CEO and CFO Fixed Pay determination appears to be based on similar company performance measures. The following is a discussion of the relationship of each company measures to the fixed pay of the CEO and CFO based on the correlation analysis results presented in Tables 3 and 4.
Chief Executive Officer fixed pay
It was observed that 7 out of the 10 performance measures showed a statistically significant relationship with CEO fixed pay. Among the seven performance measures that displayed a statistically significant relationship with CEO fixed pay, three had a strong positive relationship with CEO fixed pay, which includes revenue, EBITDA and total assets. Three displayed a weak relationship between CEO fixed pay and company performance (liquidity ratio, ROA and EBITDA margin), while net profit showed a moderate to strong relationship with fixed pay. The company performance measures that displayed a moderate or strong relationship with fixed pay are closely related to the company profitability measurements (EBITDA and Net Profit) and size of the company measurements (revenue and total assets); thus, it appears that CEO fixed pay in SOEs has a positive relationship with company performance, mainly being profitability measurements. In addition, it was observed that CEO fixed pay has a strong positive relationship with company size.
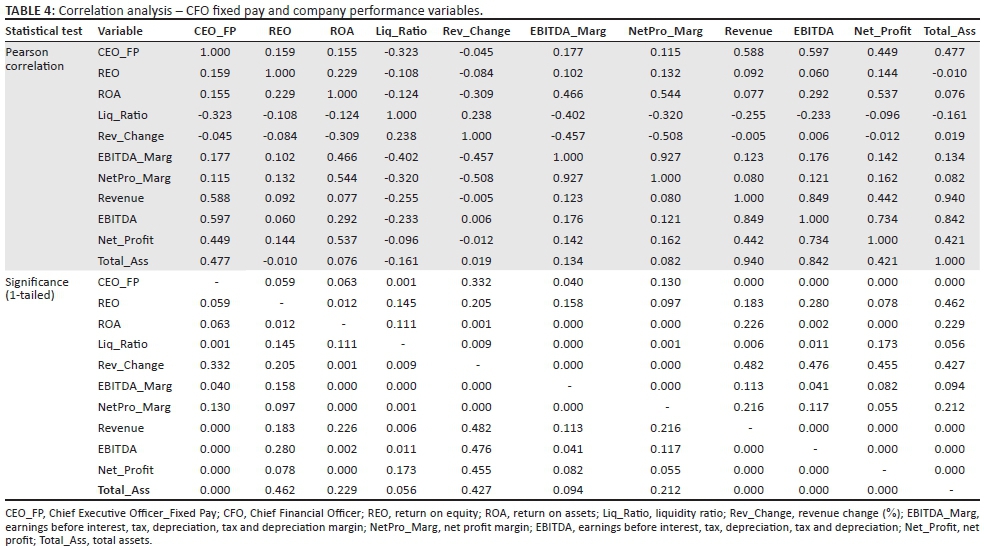
Chief Financial Officer fixed pay
Six out of the 10 performance measures showed a statistically significant relationship between CFO fixed pay and the company performance measures. Revenue and EBITDA showed a strong relationship with CFO fixed pay. Net profit and total assets showed a moderate to strong positive relationship with CFO fixed pay. EBITDA margin showed a weak positive relationship, similar to what was observed for the CEO fixed pay. However, it was observed that there was a weak to moderate negative relationship with the liquidity ratio. This was not expected, however, because of the fact that the relationship was noted to be weak, and no further investigation was conducted. Similar to the CEO fixed pay relationship with the company performance measures, most of the company performance measurements with a moderate or strong positive relationship were related to company profitability and company size; thus, it can be reasonably assumed that CFO fixed pay in SOEs has a positive relationship with company performance, mainly being company profitability measurements and a strong positive relationship with company size. The strong positive relationship observed between CEO and CFO fixed pay and company size is in line with studies by Tosi et al. (2000), Gabaix, Landier and Sauvagnat (2014), Yusuf and Abubakar (2014) and Theku (2014).
Research question 2
This research question seeks to understand if there is a positive relationship between short-term incentive payout for CEO, CFO and company performance measures. A correlation analysis was performed between the short-term incentive payout and each of the company performance measures. Similar to the observations made in research question 1, it was noted that the CEO and CFO had similar statistically significant company performance measures that had an impact on their short-term incentive amount, and inversely, company performance that did not have any statistically significant impact on short-term incentive. The results of research question 2 are summarised in Table 5.

As per Table 5, it was observed that 4 of the 10 company performance measures that were tested for correlation with CEO and CFO short-term incentive payout had a statistically significant relationship. Of the four company performance measures, only EBITDA had a moderate relationship with a short-term incentive payout for the CEO. The rest of the measures, that is revenue, net profit and total assets had a weak positive relationship for the CEO. The weak positive relationship for company size measurements that is revenue and total assets indicates that company size does not appear to be a key consideration for the purposes of determining CEO short-term incentives.
With regard to the CFO, three of the 10 company performance measurements had a moderate relationship with CFO short-term incentive payout, that is, revenue, EBITDA and total assets, while net profit had a weak relationship. Of the three company performance measurement with a moderate relationship, it was observed that EBITDA had the strongest correlation. Thus, it appears that company size does not appear to be a key consideration with regards to short-term incentives. Based on the correlation analysis results, it appears that there is positive relationship between CEO and CFO short-term incentives and company performance measure, mainly being the absolute company profitability measurement (EBITDA). This finding is line with the findings by Firth, Fung and Rui, (2006) and Conyon and He (2011), who observed a positive relationship between CEO pay and company performance in state-controlled companies in China, even though the relationship was weaker than privately controlled companies.
The moderate positive relationship between company EBITDA and CEO and CFO short-term incentives might be an indication that other factors other than the financial performance of the company have an influence on the CEO and CFO short-term incentive payout. This could be an indication that CEOs and CFOs use managerial power in determining the short-term incentives as envisaged by Bebchuk and Fried (2004). Moreover, this might be explained by the dichotomy of objectives as indicated by Thomas (2012) that SOEs drive a developmental agenda, yet their funding model is profit driven; thus, CEOs and CFOs performance rating for the purposes of short-term incentives might be more biased towards social development key performance indicators (KPIs) than financial performance KPIs.
Research question 3
This research question seeks to understand which company performance measure is the best predictor of CEO and CFO fixed pay. A standard multiple regression analysis was performed. However, prior to performing the regression analysis, a multicollinearity test relating to the independent company performance measures that have a correlation was performed. This test is performed to ensure that independent variables that display a high correlation are removed from the regression analysis. Based on the latter, with regards to CEO and CFO fixed pay, total assets and EBITDA company performance measures were removed from the regression analysis model. Total assets and EBITDA had the highest correlation as evidenced by the multicollinearity test results in (CEO fixed pay) and (CFO fixed pay). Revenue was observed to have a low correlation with the rest of the company performance measures after removing total assets and EBITDA, evidenced by the multicollinearity test results. Furthermore, because of the positive auto-correlation that was observed, the Cochrane-Orcutt estimation method was used to perform the regression model analysis. The results for the CEO and CFO fixed pay are discussed below separately.
To determine which individual company performance measure is the best predictor of fixed pay for the CEO and CFO in SOEs, a regression analysis using the Cochrane-Orcutt estimation method was performed. The results for both the CEO and CFO indicate that revenue, which is a proxy for company size, is the best predictor of the fixed pay for the CEO and CFO. This finding thus supports similar studies by Tosi et al. (2000), Gabaix, Landier and Sauvagnat (2014), Yusuf and Abubakar (2014), Theku (2014) and Bussin and Nel (2015), who indicated in their studies that firm size was the key determiner of CEO pay.
Research question 4
This research question sought to observe which individual company performance measure is the best predictor of CEO and CFO short-term incentive payout in SOEs. Similar to research question 3, a standard multiple regression analysis was performed. Prior to performing the multiple regression analysis, multicollinearity tests were performed. The multicollinearity tests were performed as the inputs to the multiple regression analysis. In testing which performance measures had a high correlation, that is, through the multicollinearity test, total assets were observed to have a high correlation with the other company performance measures and thus was excluded for both the CEO and CFO short-term incentive test.
As a result of the positive auto-correlation that was noted, based on the Durbin-Watson score that was observed, the Cochrane-Orcutt estimation method was used to perform the regression model analysis. The following is a discussion of the results for the CEO and CFO short-term incentive regression analysis.
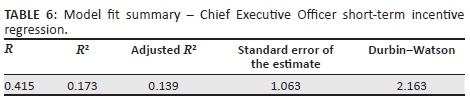
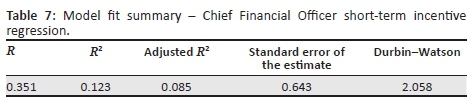
The regression analysis based on the Cochrane-Orcutt estimation method shows that EBITDA is the best predictor for both the CEO and CFO short-term incentive payout. This finding is contrary to the sentiments expressed in popular media that executive remuneration in SOEs is not linked to company performance. However, the extent of influence of EBITDA on short-term incentive for the CEO and CFO appears to be small, evidenced by the R2result of 17.3% for the CEO and 12.3% for the CFO. The R2 result shown in Table 6 (CEO short-term incentive) and Table 7 (CFO short-term incentive) is an indication of the variation in the short-term incentive payout that is explained by changes in revenue, EBITDA, net profit and the constant. EBITDA is the most significant predictor of the short-term incentive payout as a result of having the highest standardised co-efficient beta for both the CEO and CFO short-term incentive payout.
Limitations of this study and areas for further research
As a result of time and the nature of the study, the following limitations were noted: the study does not show a causal relationship between CEO and CFO remuneration and company performance; thus, no additional information about the casual factors influencing CEO and CFO remuneration and company performance has been provided as the study only describes the relationship between CEO and CFO and company performance, measured through accounting measurements. The study is limited to Schedule 2 entities, and thus, the findings from the research may not be applicable for other non-Schedule 2 SOEs or SOEs in other countries because of other dynamics coming into play, for example, culture and the business environment in which the SOE operates. The study focused on accounting company performance measures and thus other critical performance measures, for example, achieving of shareholders compact was considered outside the scope of this study. The meeting of the shareholders compact might be a good indicator of company performance for South African SOEs because the mandate of SOEs is different from listed or privately held companies.
Furthermore, as a result of the high CEO and CFO turnover noted in the SOEs, the impact of the high turnover on the financial performance of the SOE can be considered for future research. While the appointment of South African SOEs CEO and CFO is made by the board, the decision requires to be ratified by the Minister of the responsible Government
Department and South African Executive Cabinet. The latter opens up space for political appointments. Further studies could consider comparing the performance of South African SOEs with highly connected executives or board members to SOEs with low political connections. Moreover, further studies could be done to assess what effect the political connections have on the pay to performance relationship.
Conclusion
Executive remuneration remains a hot topic, especially in the South African context where the income gap continues to increase. Thus, it is important that the policy makers ensure that an appropriate balance is achieved between executive pay and company performance in order to ensure that executives are appropriately rewarded to achieve company objectives, while ensuring that SOE employees or customers are not alienated in the process as a result of the rising income gap.
Contrary to popular media reports, it appears that the fixed pay and short-term incentives of CEOs and CFOs have a positive relationship with company performance. However, the positive relationship was mainly observed on absolute profitability measurements, like EBITDA and Net Profit. Company size appears to be a key consideration in the determination of CEO and CFO fixed pay. More emphasis needs to be placed on efficiency-related company performance measures, to ensure that the SOE executives continue to drive efficiencies in their operations and in so doing secure the financial sustainability of the SOE and reduce reliance on market dominance as the competitive advantage. Moreover, it is important that remuneration committees of the SOEs reconsider the balance of financial performance measures versus non-financial performance measures in the determination of the CEO and CFO short-term incentive payout as evidenced by the moderate positive relationship and the low level of influence EBITDA seems to have on the short-term incentive payout, in order to ensure that the financial sustainability of the SOEs remains a top priority for the executives. This will reduce the reliance of some of the SOEs on South African taxpayers as some of the SOEs have been reported to having received financial bailouts from the South African government in the past financial years.
Lastly, it is important that SOEs remuneration committees continue to manage fixed pay for SOE executives to ensure that company size is not used as the main reason for high fixed pay, by rent-seeking executives. However, at the same time, in order to attract the appropriate talent at these SOEs, it is important that short-term incentives take into account company size.
Acknowledgements
Competing interests
The authors declare that they have no financial or personal relationship(s) which may have inappropriately influenced them in writing this article.
Authors' contributions
The study was conducted by M.N. (GIBS) as part of his Masters in Business Administration research project in 2015. M.H.R.B. (University of Johannesburg) was M.N.'s supervisor and edited this article for publication.
References
Amzaleg, Y., Azar, O.H., Ben-Zion, U. & Rosenfeld, A., 2014, 'CEO control, corporate performance and pay-performance sensitivity', Journal of Economic Behavior & Organization 106, 166-174. https://doi.org/10.1016/j.jebo.2014.07.004 [ Links ]
Bebchuk, L.A. & Fried, J.M., 2004, 'Executive compensation as an agency problem', Journal of Economics Perspectives 117(2), 371-392. [ Links ]
Bronstein, V. & Olivier, M., 2015, An evaluation of the regulatory framework governing state owned enterprises (SOEs) in the republic of South Africa, Technical Report, The Presidency, Pretoria. [ Links ]
Business Tech, 2014, State-owned company CEO salaries, viewed 15 April 2015, from http://businesstech.co.za/news/government/74752/state-owned-company-ceo-salaries. [ Links ]
Bussin, M., 2011, The remuneration handbookfor Africa, 1st edn., Knowres Publishing, Randburg, South Africa. [ Links ]
Bussin, M., 2015, 'CEO pay-performance sensitivity in the South African context', South African Journal of Economic and Management Sciences 18(2), 232-244. https://doi.org/10.17159/2222-3436/2015/v18n2a7 [ Links ]
Bussin, M. & Modau, M.F., 2015, 'The relationship between chief executive officer remuneration and financial performance in South Africa between 2006 and 2012', SA Journal of Human Resource Management 13(1), 1-18. https://doi.org/10.4102/sajhrm.v13i1.668 [ Links ]
Bussin, M. & Nel, M., 2013, 'Align CEO pay to company performance', HR Future March, 40-41. [ Links ]
Bussin, M. & Nel, M., 2015, 'Relationship between CEO remuneration and company financial performance in the South African retail and consumer goods sector', Acta Commercii 15(1), 1-11. https://doi.org/10.4102/ac.v15i1.240 [ Links ]
Chalevas, C.G., 2011, 'The effect of the mandatory adoption of corporate governance mechanisms on executive compensation', The International Journal of Accounting 46(2), 138-174. https://doi.org/10.1016/j.intacc.2011.04.004 [ Links ]
Choe, C., Tian, G.Y. & Yin, X., 2014, 'CEO power and the structure of CEO pay', International Review of Financial Analysis 35, 237-248. [ Links ]
Conyon, M. J., & He, L., 2011, 'Executive compensation and corporate governance in China', Journal of Corporate Finance, 17(4), 1158-1175. https://doi.org/10.1016/'. jcorpfin.2011.04.006 [ Links ]
Conyon, M.J. & He, L., 2014, 'CEO turnover in China: The role of market-based and accounting performance measures', The European Journal of Finance 20(7-9), 657-680. https://doi.org/10.1080/1351847X.2012.676559 [ Links ]
Core, J. & Guay, W., 1999, 'The use of equity grants to manage optimal equity incentive levels', Journal of Accounting and Economics 28(2), 151-184. https://doi.org/10.1016/S0165-4101(99)00019-1 [ Links ]
Core, J.E., Guay, W.R. & Larcker, D.F., 2003, 'Executive equity compensation and incentives: A survey', Economic Policy Review 9(1), 27-50. [ Links ]
Devers, C.E., Cannella, A.A., Reilly, G.P. & Yoder, M.E., 2007, 'Executive compensation: A multidisciplinary review of recent developments', Journal of Management 33(6), 1016-1072. https://doi.org/10.1177/0149206307308588 [ Links ]
Dicks, D.L., 2012, 'Executive compensation and the role for corporate governance regulation', Review of Financial Studies 25(6), 1971-2004. https://doi.org/10.1093/rfs/hhs055 [ Links ]
Donaldson, T., 2012, 'The epistemic fault line in corporate governance', Academy of Management Review 37(2), 256-271. https://doi.org/10.5465/amr.2010.0407 [ Links ]
Firth, M., Fung, P.M. & Rui, O.M., 2006, 'Corporate performance and CEO compensation in China', Journal of Corporate Finance 12(4), 693-714. https://doi.org/10.1016/j.jcorpfin.2005.03.002 [ Links ]
Friedman, H.L., 2014, 'Implications of power: When the CEO can pressure the CFO to bias reports', Journal of Accounting and Economics 58(1), 117-141. https://doi.org/10.1016/j.jacceco.2014.06.004 [ Links ]
Gabaix, X., Landier, A. & Sauvagnat, J., 2014, 'CEO pay and firm size: An update after the crisis', The Economic Journal 124(574), F40-F59. https://doi.org/10.1111/ecoj.12084 [ Links ]
Goergen, M. & Renneboog, L., 2011, 'Managerial compensation', Journal of Corporate Finance 17(4), 1068-1077. https://doi.org//10.1016/j.jcorpfin.2011.06.002 [ Links ]
Hambrick, D.C. & Quigley, T.J., 2014, 'Toward more accurate contextualization of the CEO effect on firm performance', Strategic Management Journal 35(4), 473-491. https://doi.org/10.1002/smj.2108 [ Links ]
Hölmstrom, B., 1979, 'Moral hazard and observability', The Bell Journal of Economics 10(1), 74-91. https://doi.org/10.2307/3003320 [ Links ]
Holmstrom, B. & Milgrom, P., 1991, 'Multitask principal-agent analyses: Incentive contracts, asset ownership, and job design', Journal of Law, Economics, & Organization 7, 24-52. [ Links ]
Institute of Directors Southern Africa (IOD), 2017, KING IV, viewed 11 September 2015, from http://www.iodsa.co.za/?page=KingIV [ Links ]
Jensen, M.C. & Murphy, K.J., 1990, 'Performance pay and top-management incentives', Journal of Political Economy 98(2), 225-264. https://doi.org/10.1086/261677 [ Links ]
Jensen, M.C., Murphy, K.J. & Wruck, E.G., 2004, 'Remuneration: Where we've been, how we got to here, what are the problems, and how to fix them', Harvard NOM Working Paper 44, 1-116. [ Links ]
Juan, D., 2015, SOEs ordered to cut salaries and reduce costs, viewed 28 September 2015, from http://www.chinadaily.com.cn/cndy/2015-06/05/content_20913065.htm [ Links ]
Murphy, K.J., 1999, 'Executive compensation', Handbook of Labor Economics 3, 2485-2563. [ Links ]
Naidoo, S., 2012, Executive remuneration, viewed 18 May 2015, from http://www.financialmail.co.za/fm/2010/07/15/executive-remuneration [ Links ]
National Treasury, 2014, Public institutions listed in PFMA schedule 1, 2, 3A, 3B, 3Cand 3D, viewed n.d., from http://www.treasury.gov.za/legislation/pfma/public%20entities/default.aspx [ Links ]
Ozkan, N., 2011, 'CEO compensation and firm performance: An empirical investigation of UK panel data', European Financial Management 17(2), 260-285. https://doi.org/10.1111/j.1468-036X.2009.00511.x [ Links ]
Pallant, J., 2013, SPSS survival manual: A step by step guide to data analysis using IBM SPSS, 5th edn., McGraw Hill, Berkshire, England. [ Links ]
Republic of South Africa, 2011, Companies Act of 2008, Act No 71. [ Links ]
Shaw, P., 2012, 'CEO pay-performance sensitivity in South African financial services companies', Masters, University of Pretoria. [ Links ]
SPSS20.00 for Windows [Computer software], 2012, SPSS Incorporated, Chicago, IL. [ Links ]
Theku, M., 2014, 'CEO compensation sensitivity to performance in the South African mining industry', Masters, University of Pretoria. [ Links ]
Thomas, A., 2012, 'Governance at South African state-owned enterprises: What do annual reports and the print media tell us?', Social Responsibility Journal 8(4), 448-470. https://doi.org/10.1108/17471111211272057 [ Links ]
Tosi, H.L., Werner, S., Katz, J.P. & Gomez-Mejia, L.R., 2000, 'How much does performance matter? A meta-analysis of CEO pay studies', Journal of Management 26(2), 301-339. https://doi.org/10.1177/014920630002600207 [ Links ]
Tremlett, G., 2012, Spain to limit executive pay at state owned companies, viewed 05 June 2015, from http://www.theguardian.com/world/2012/feb/17/spain-limit-executive-pay [ Links ]
Van Blerck, T.G., 2013, 'The relationship between executive remuneration at financial institutions and economic value added', Masters, University of Pretoria. [ Links ]
Wang, K. & Xiao, X., 2011, 'Controlling shareholders' tunneling and executive compensation: Evidence from china', Journal of Accounting and Public Policy 30(1), 89-100. https://doi.org/10.1016/j.jaccpubpol.2010.09.014 [ Links ]
Wright, M., 2015, China said to slash senior executive pay at top banks, SOEs, viewed 23 August 2015, from http://www.bloomberg.com/news/articles/2015-03-06/china-said-to-slash-senior-executive-pay-at-biggest-banks-soes [ Links ]
Yusuf, I. & Abubakar, S., 2014, Chief executive officer's pay in Nigerian banks: Are corporate governance, firm size, and performance predictors?, Nasarawa State University, Keffi, Nigeria, 7-9th October 2014, pp. 1-20,viewed 13 September 2015, from https://www.researchgate.net/publication/280011216_Chief_Executive_Officer%27s_ Pay_in_ Nigerian_Banks_Are_Corporate_Governance_Firm_Size_and_Performance_Predictors [ Links ]
 Correspondence:
Mark Bussin
drbussin@mweb.co.za
Received: 06 Aug. 2016
Accepted: 14 July 2017
Published: 30 Oct. 2017

