


Services on Demand
Article
 English (pdf)
 Article in xml format
 Article references
Indicators

Related links
-
 Cited by Google
 -
 Similars in Google
Share

 Permalink
South African Journal of Economic and Management Sciences
On-line version ISSN 2222-3436
Print version ISSN 1015-8812
S. Afr. j. econ. manag. sci. vol.20 n.1 Pretoria 2017
http://dx.doi.org/10.4102/sajems.v20i1.1532
ORIGINAL RESEARCH
Fractional Black-Scholes option pricing, volatility calibration and implied Hurst exponents in South African context
Emlyn Flint; Eben Maré
Department of Mathematics and Applied Mathematics, University of Pretoria, South Africa
ABSTRACT
BACKGROUND: Contingent claims on underlying assets are typically priced under a framework that assumes, inter alia, that the log returns of the underlying asset are normally distributed. However, many researchers have shown that this assumption is violated in practice. Such violations include the statistical properties of heavy tails, volatility clustering, leptokurtosis and long memory. This paper considers the pricing of contingent claims when the underlying is assumed to display long memory, an issue that has heretofore not received much attention.
AIM: We address several theoretical and practical issues in option pricing and implied volatility calibration in a fractional Black-Scholes market. We introduce a novel eight-parameter fractional Black-Scholes-inspired (FBSI) model for the implied volatility surface, and consider in depth the issue of calibration. One of the main benefits of such a model is that it allows one to decompose implied volatility into an independent long-memory component - captured by an implied Hurst exponent - and a conditional implied volatility component. Such a decomposition has useful applications in the areas of derivatives trading, risk management, delta hedging and dynamic asset allocation.
SETTING: The proposed FBSI volatility model is calibrated to South African equity index options data as well as South African Rand/American Dollar currency options data. However, given the focus on the theoretical development of the model, the results in this paper are applicable across all financial markets.
METHODS: The FBSI model essentially combines a deterministic function form of the 1-year implied volatility skew with a separate deterministic function for the implied Hurst exponent, thus allowing one to model both observed implied volatility surfaces as well as decompose them into independent volatility and long-memory components respectively. Calibration of the model makes use of a quasi-explicit weighted least-squares optimisation routine.
RESULTS: It is shown that a fractional Black-Scholes model always admits a non-constant implied volatility term structure when the Hurst exponent is not 0.5, and that 1-year implied volatility is independent of the Hurst exponent and equivalent to fractional volatility. Furthermore, we show that the FBSI model fits the equity index implied volatility data very well but that a more flexible Hurst exponent parameterisation is required to fit accurately the currency implied volatility data.
CONCLUSION: The FBSI model is an arbitrage-free deterministic volatility model that can accurately model equity index implied volatility. It also provides one with an estimate of the implied Hurst exponent, which could be very useful in derivatives trading and delta hedging.
Introduction
Contingent claims on underlying assets are typically priced under the framework introduced by Black and Scholes (1973). This framework assumes, inter alia, that the log returns of an underlying asset are normally distributed. However, many researchers have shown that this assumption is violated in practice. Cont (2001) put forth several 'stylised facts' of empirical asset returns, defined as 'statistical properties found to be common across a wide range of instruments, markets and time periods'. These include the properties of the so-called heavy tails, volatility clustering, leptokurtosis and long memory. While many authors have studied the implications of these stylised facts across a variety of market applications, this article addresses an issue which has previously not received much attention. More specifically, this article considers several theoretical and practical issues in the pricing of contingent claims when the underlying is assumed to display long memory.
Hurst (1951) proposed a statistical metric - and its estimation methodology - for measuring the long-term memory embedded within a given system. This metric is now commonly referred to as the Hurst exponent, index or parameter and is denoted by H ∈ [0,1]. For a given time series, H < 1/2 implies that the series displays a negative, long-term autocorrelation (or anti-persistence), H = 1/2 implies zero long-term autocorrelation and H > 1/2 implies that the series displays a positive autocorrelation. In financial calculus parlance, this would be equivalent to a stochastic process displaying mean-reversion, no memory or momentum, respectively. A stochastic process with high H > 1/2 will also be smoother than the same process with low H < 1/2 because it is less likely to move against the underlying trend.
Mandelbrot and Van Ness (1968) were the first researchers to suggest the use of the Hurst exponent in financial markets. Specifically, they suggested that financial asset prices displayed some form of long memory and introduced fractional Brownian motion (fBm) - a new class of Gaussian random functions - for modelling the log increments in asset price processes. The fBm for a given Hurst exponent H (see, e.g. Biagini et al. 2008) is the continuous Gaussian process {BH(t), t ∈ R+}, with
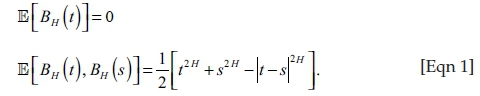
From Equation 1, it is clear that the standard Brownian motion is simply a special case of fBm where H = 1/2. For all other values of H though, the fBm process will have dependent increments. Mandelbrot (2013), as well as the references contained therein, provides an excellent summary of the early applications of the fBm theory in financial markets. A sample of the more recent studies is given below.
Karuppiah and Los (2005) consider the long-term dependence of Asian currencies finding empirical Hurst exponents between 0.3 and 0.5 and thus implying anti-persistent behaviour. In contrast, they note that equities typically exhibit persistent behaviour, with Hurst exponents estimated between 0.6 and 0.7 (see also, e.g. Peters 1989, 1994). Simonsen (2003) demonstrates that Nordic electricity spot prices can be modelled using fBm with a Hurst exponent of approximately 0.4. Alvarez-Ramirez et al. (2002) conclude that crude oil price formations are stochastically persistent with long-term memory processes at work. A long-term dependence (as well as heavy tailed distributions) in financial data has been established by Andersen and Bollerslev (1997) and Müller, Dacorogna and Pictet (1998) using high-frequency financial data. More recent work by Tzouras, Anagnostopoulos and McCoy (2015) employs the Hurst exponent to model memory-dependent properties in share indices and oil prices (see also Alvarez-Ramirez et al. 2008; Serinaldi 2010). Cajueiro and Tabak (2004), as well as Rejichi and Aloui (2012), use the Hurst exponent to test the evolving efficiency of emerging equity markets.
Hu and Øksendal (2003) derived closed-form solutions for contingent claim valuation in a fractional Black-Scholes market, where the standard Brownian motion in the asset price process is replaced with an fBm (see also Necula 2002). Their work was extended by Elliott and Van der Hoek (2003). Specifically, for a market with a risk-free asset A and a risky stock S, a fractional Black-Scholes market is defined as
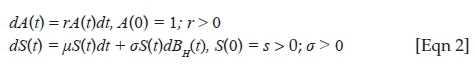
where 0 ≤ t ≤ T, r and μ are constant drift parameters and σ is a constant scale parameter. From this, Hu and Øksendal (2003) derive the fractional Black-Scholes value of a European call option Cf(·) at time t with strike K and term r = T − t as
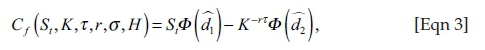
where Φ is the standard cumulative normal distribution function and
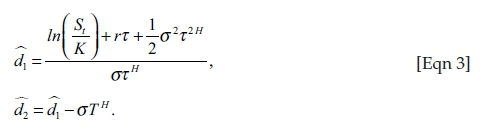
As with the seminal Black-Scholes option pricing formula (Black & Scholes 1973), one can infer the valuation formula for a European put option Pf(·) with strike K and term τ via put-call parity. Furthermore, a dividend yield q can be added to the above equations in a similar manner to Merton's (1973) extension of the standard Black-Scholes framework.
Although already stated above, Equation 3 makes it clear that setting H = 1/2 simply gives one the classical Black and Scholes (1973) option pricing formula. Therefore, assuming that the risk-free rate and dividend yield are known, fBm option prices are fully described by two parameters: the Hurst exponent H as a measure of long memory and the volatility of the stock σ after controlling for long memory.
This article is organised as follows: The section 'Implied volatility in a fractional Black-Scholes market' is devoted to the links between standard Black-Scholes (1973) volatility and fractional Black-Scholes volatility. We also demonstrate how to calculate realistic implied volatility surfaces by assuming parameterisations of the fractional volatility and the Hurst parameter. In sections 'Arbitrage-free, fractional Black-Scholes-inspired volatility surfaces' and 'Calibrating FBSI surfaces and implied Hurst exponents', we demonstrate how arbitrage-free calibration would be conducted. The section 'Empirical FBSI surfaces and Hurst exponents: A South African experiment' deals with the South African equity index and currency examples - we provide market-implied Hurst parameters. We conclude the article in the 'Conclusion' section.
Implied volatility in a fractional Black-Scholes market
Since the early 1970s, option pricing has been characterised by the seminal Black-Scholes option pricing formula, which gives a simple bijective mapping between an option's price and the formula's volatility parameter σBS, termed the option's 'implied volatility'. Under the idealised, theoretical assumptions of the Black-Scholes framework, implied volatility is constant. However, when implied volatility is plotted against option strikes for a fixed expiry, one observes a 'skew' or 'smile' pattern in practice, largely driven by the non-normality of the underlying asset return distribution and the supply-demand dynamics within the selected derivatives market (Dupire 2006). Furthermore, when implied volatility is plotted against option term for a fixed strike, one observes a non-constant relationship, referred to as the term structure of implied volatility.
In reality, then, implied volatility is a function of an option's strike and term. The practitioner's convention in derivatives markets is to speak of separate implied volatility skews (or smiles) for individual option expiries. A collection of implied volatility skews is referred to as an implied volatility surface, which in itself is dynamic, changing with the underlying market conditions (see, e.g. Cont & da Fonseca 2002). The implied volatility surface at time t is denoted as σBS(K,τ,t).
Hu and Øksendal (2003) showed that the variance of the log returns of the stock process in a fractional Black-Scholes market is given by
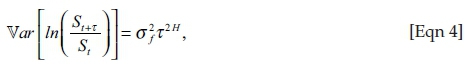
where σf is the volatility parameter specific to the fractional setting, hereafter referred to as fractional volatility. Equating this expression with the equivalent formula in the standard Black-Scholes market (i.e. substituting in H = 1/2 above and dropping strike- and time-dependence for now) yields the relationship
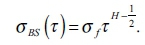
Equation 5 has three clear implications. Firstly, even for constant fractional volatility and Hurst parameters, the Black-Scholes implied volatility term structure is described by a power function rather than a constant. This is the same functional form used in Heston's (1993) stochastic volatility model and is also the deterministic term structure function postulated by many market practitioners (Gatheral 2006). As shown in Figure 1, H > 0.5 gives an up-sloping term structure, H = 0.5 gives a constant value and H < 0.5 gives a downward-sloping term structure.
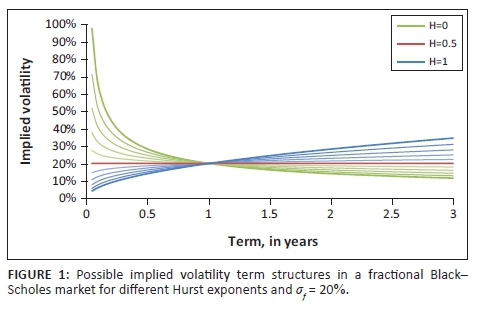
Secondly, the standard and fractional Black-Scholes models give the same implied volatility - and thus option price - for τ = 1, regardless of the specified Hurst exponent. This is also evident from Figure 1. It follows that if one assumes constant fractional model parameters, then it must be that σf = σBS (1).
Thirdly, there is no implicit strike dependence in the fractional Black-Scholes model. This means that the single volatility term structure would apply to all option strikes, which is not consistent with reality. At the very least, one would need to introduce strike dependence into the fractional volatility parameter in order to match the τ = 1 implied volatility skew, which is independent of Hurst exponent by construction. The simplest deterministic model used in practice that gives a reasonable description of the implied volatility skew around current spot levels is a quadratic equation (Dumas, Fleming & Whaley 1998):1

where X is the ratio of the option strike K to the current spot price St, generally termed 'moneyness'. The βi parameters account for the level, slope and curvature of the volatility skew, respectively. Figure 2 shows how different Hurst exponents can affect the constructed implied volatility surface for a fractional volatility skew (i.e. 1-year implied skew) indicative of equity index option markets.
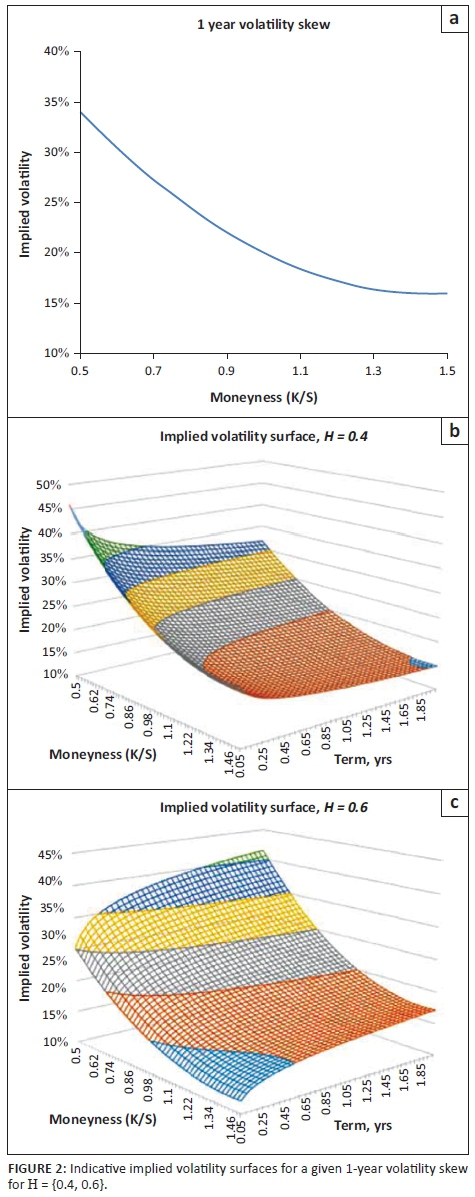
While the surfaces shown in Figure 2 are generally quite realistic, neither captures the universal property that all implied volatility surfaces based on martingale models flatten out with term (Rogers & Tehranchi 2010). This inconsistency is particularly evident for the H = 0.6 surface, which displays increasing skew and curvature across term. In general, for the majority of index volatility surfaces the Hurst exponent would need to be below 0.5 for low strikes and above 0.5 for high strikes to ensure that the surface levels off across term. In contrast, for currency implied volatility surfaces which show considerably more convexity than their equity index counterparts, one would expect the Hurst exponent to be below 0.5 for both very high and very low option strikes. While these expectations stem purely from the mathematics of Equation 5 and the shape of volatility surfaces observed in practice, given the stylised facts already known about each asset class, it would seem plausible to assume that there is an underlying economic rationale to the strike profile of the Hurst exponent. This point will be revisited later but for now, we simply observe that realistic index and currency volatility surfaces would require a strike-dependent Hurst exponent.
Figure 3 shows the implied volatility surface constructed when using a similar deterministic quadratic function as per Equation 6 for the Hurst exponent. Notice the significant level of skew achieved at very short option terms - a feat which many stochastic volatility models struggle to achieve (Gatheral 2006) - in combination with a substantially flatter surface at longer terms.
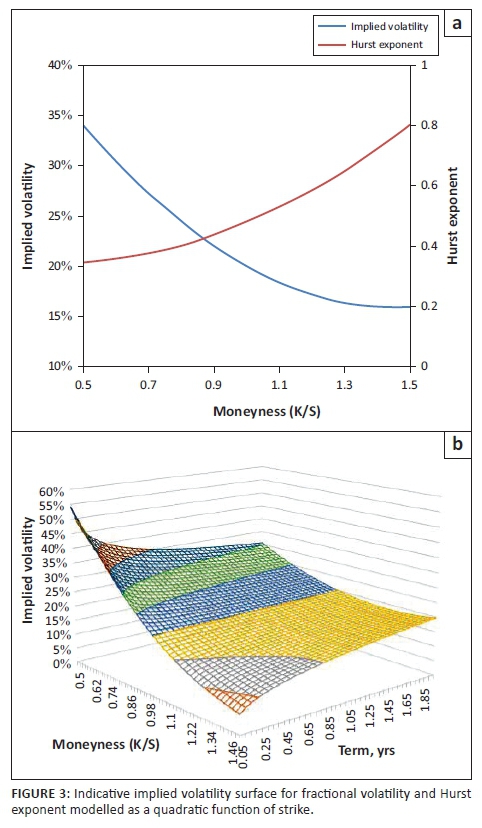
While the quadratic formulations used here are purely for pedagogical purposes, it is evident that even these simple parameterisations provide one with a high degree of flexibility for modelling realistic volatility surfaces in the fractional Black-Scholes framework. Moreover, the idea of using strike-dependent fractional parameters in Equation 5 provides one with the basis for a robust but simple volatility surface model.
Arbitrage-free, fractional Black-Scholes-inspired volatility surfaces
Creating arbitrage-free parameterisations of the implied volatility surface is extremely important for derivatives trading and risk management in practice and has been given considerable attention in the literature (Damghani & Kos 2013; Gatheral & Jacquier 2014; Lee 2004; Roper 2010, and the references therein). In this section, we consider a fractional Black-Scholes-inspired (FBSI) parameterisation of the volatility surface: a combination of the fBm framework outlined in the 'Implied volatility in a fractional Black-Scholes market' section and the stochastic volatility-inspired (SVI) model of Gatheral (2004) for the strike-dependent fractional volatility parameter.
Carr et al. (2005) introduced the idea of static arbitrage, and Carr and Madan (2005) identified the sufficient conditions - eliminating call spread, butterfly spread and calendar spread arbitrages - for ensuring that a set of option prices excludes all static arbitrage. Roper (2010) extended this line of research to find the corresponding set of necessary and sufficient conditions to ensure that the volatility surface was free from all static arbitrages. Following the notation of Gatheral and Jacquier (2014), we outline these conditions - no calendar spread arbitrage and no butterfly spread arbitrage - below.
Let us define k = ln(K/F) as the log moneyness measured relative to the forward F and 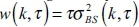 as the total implied variance surface. Then, assuming that dividends are proportional to the underlying asset price, the volatility surface W is free of calendar spread arbitrage if and only if

Furthermore, each time slice of the volatility surface w(k) is free from butterfly spread arbitrage if and only if the corresponding density function is non-negative, or equivalently
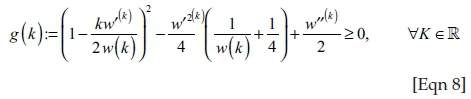
And
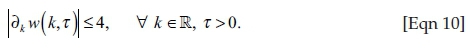
Note that w′(k) and w″(k) refer to the first and second derivatives, respectively. Damghani and Kos (2013) give a necessary but not sufficient butterfly spread condition which they state is commonly used in practice:
Let us now consider the fractional Black-Scholes framework as per the 'Implied volatility in a fractional Black-Scholes market' section. It follows from Equation 5 that the total implied variance surface at a given time can be written as
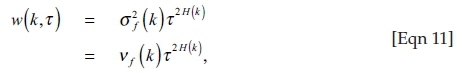
where the formulations for fractional variance  and Hurst exponent remains fully general. Applying the condition in Equation 7, we have that Equation 1 is free from calendar spread arbitrage if and only if

Given that H ∈ [0,1] by construction and vf > 0, it is trivial to see that Equation 12 will hold true at all times. Therefore, regardless of the parameterisations specified for fractional volatility and Hurst exponent, the fractional Black-Scholes volatility surface is always free from calendar spread arbitrage. The same conclusion cannot be easily discerned for butterfly spread arbitrage.
As mentioned above, we limit our focus to Gatheral's (2004) SVI model as a candidate for the fractional variance function. The SVI model is one of the most widely used deterministic volatility functions in the equity derivatives market and is also commonly used by foreign exchange derivatives practitioners. Although Gatheral and Jacquier (2014) have recently proposed several alternative formulations of the model parameters, we consider the original 'raw' parameterisation for simplicity. For a given parameter set Χ = {a, b, ρ, m σ}, the SVI model for total implied variance is given by
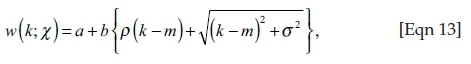
where  gives the overall level of variance, b ≥ 0 gives the angle between the left and right asymptotes, |ρ| < 1 determines the orientation of the curve,
  controls the horizontal positioning of the curve and σ > 0 adjusts the smoothness of the curve vertex. Gatheral (2004) also imposes the condition that
  in order to ensure that w(k; x) ≥ 0 for all
  . Gatheral further states that in order to meet the necessary (but not sufficient) condition for no butterfly arbitrage as per Equation 10, one must have
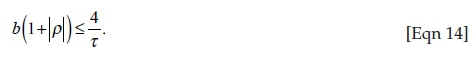
Although Roper (2010) showed that a parameter set which satisfies Equation 14 can still breach the more stringent Equation 8 and thus admit butterfly arbitrage, Gatheral (2004), among others, suggests that the SVI parameter sets calibrated to real market data are arbitrage-free.
As noted in the 'Implied volatility in a fractional Black-Scholes market' section, fractional variance is equivalent to 1-year total implied variance and is thus independent of the Hurst exponent. Therefore, one can directly apply Equations 13 and 14 in order to find the necessary arbitrage-free SVI parameter ranges. Specifically, for the τ = 1 fractional variance time slice, the necessary condition for no butterfly arbitrage is  .
.
Similarly ensuring no arbitrage across all volatility time slices is not easy because of the strike-dependent Hurst exponent. Taking the derivative with respect to strike of the total variance surface as per Equation 11, we have

Even for simple H(k) functions, it is not obvious what the necessary arbitrage-free parameter ranges should be. However, it is a straightforward, if somewhat long-winded, exercise to directly calculate the values of g(k) for a given Hurst parameterisation and thus enforce the necessary Hurst parameter ranges during calibration to remove any butterfly spread arbitrage.
Calibrating fractional Black-Scholes-inspired surfaces and implied Hurst exponents
Building from the 'Implied volatility in a fractional Black-Scholes market' and 'Arbitrage-free, fractional Black-Scholes Scholes-inspired volatility surfaces' sections, we formally define the FBSI parameterisation of total implied variance as follows:
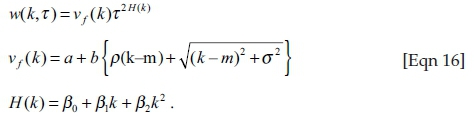
Motivated by the observations in sections 'Implied volatility in a fractional Black-Scholes market' and 'Arbitrage-free, fractional Black--Scholes Scholes-inspired volatility surfaces', and in the absence of prior knowledge, the choice of a quadratic function for the Hurst exponent seems a reasonable guess. In this case, β0 ∈ [0,1] represents the at-the-money (ATM) level, β1 the slope and β2 the curvature of the Hurst exponent.2 The function g(k) can be calculated analytically from Equation 16 and used to ensure that, in conjunction with the SVI parameter bounds given in the 'Implied volatility in a fractional Black-Scholes market' section, the calibrated βi parameters do not introduce butterfly arbitrage at any time slice. The complete volatility surface is thus a function of eight parameters, xf = {a, b, ρ, m, σ, β0, β2, β3}.
Given the reliance on the SVI model to parameterise the fractional variance, it makes sense to augment existing SVI calibration algorithms for the additional Hurst exponent parameters. De Marco and Martini (2009) outline a robust quasi-explicit calibration process for the SVI model which produced a reliable and stable parameter set. Through a clever change of variables, the initial five-dimensional SVI minimisation problem is recast into a much simpler two-dimensional problem, with the remaining three variables having (quasi-) explicit solutions within the new framework. This '2+3' procedure is robust to initial guesses and provides stable, arbitrage-free SVI parameters. In a similar vein, we reformulate the raw eight-parameter FBSI model calibration into a '5+3' procedure, with the three Hurst parameters supplementing the two SVI parameters as per De Marco and Martini (2009). Testing shows that this procedure is also generally robust to initial guesses and fast to implement. The FBSI model and calibration procedure thus give one a robust means of modelling the full volatility surface and also of deriving the implied Hurst exponent across the full moneyness range at any given time.
To the authors' best knowledge, the only other research to date that considers similar fBm-based volatility surface parameterisations is the fBm variance term structure model posited by Li and Chen (2014).3 Based on the relationship between implied volatility in the Black-Scholes framework and implied volatility in the fBm framework, Li and Chen (2014) show that one can estimate both the fractional volatility and the Hurst exponent from traded option data via linear regression. Consider the logarithm of the power function given in Equation 5:
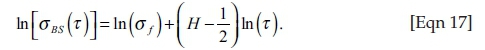
Li and Chen (2014) suggest using ordinary least squares (OLS) to estimate the fractional volatility and implied Hurst exponent by regressing the logarithm of ATM implied volatility against the logarithm of term. In this way, one is able to calculate a single fractional volatility and Hurst exponent from the option data. Li and Chen further suggest replacing the Black-Scholes implied volatilities in Equation 17 with the model-free implied volatilities of Britten-Jones and Neuberger (2000), which can be calculated in practice by applying the standard VIX methodology at all observed option terms. The use of model-free implied volatility as the dependent variable has the benefits of removing dependence on any specific pricing model and of using information from all traded options rather than only ATM options.4 However, despite incorporating information from the full volatility surface, this method still only allows one to model the term structure of implied volatility.
Empirical fractional Black-Scholes-inspired surfaces and Hurst exponents: A South African experiment
The FBSI and Li and Chen (LC) model are calibrated to two sets of South African option market data. The first data set consists of 529 weekly observations of implied volatility skews for listed futures options on the FTSE/JSE Top40 index (Top40) over the period 5 September 2005 to 30 November 2015. Top40 options are the most actively and liquid traded derivative contracts in South Africa. These options trade on the South African Futures Exchange (SAFEX) on the basis of implied volatility and the option price is calculated using the Black (1976) option pricing formula. The weekly implied volatility skews were obtained from Peregrine Securities and generally, cover a strike range of 75% - 125% of the forward price. The second data set consists of 146 weekly observations of implied volatility skews for listed futures options on the United States Dollar to South African Rand (USD/ZAR) exchange rate over the period 11 February 2013 to 30 November 2015. The volatility skews initially cover a range of 80% - 120% of the forward price up to November 2014 and thereafter cover a 70% - 130% range. These data were also obtained from Peregrine Securities.
Fractional Black-Scholes-inspired index volatility surfaces
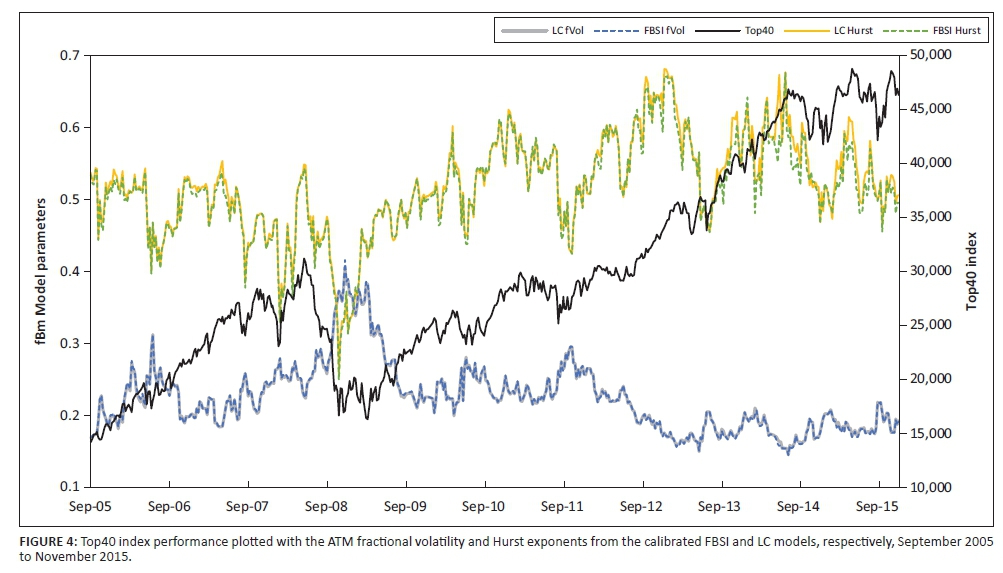
Let us first consider the results for the index volatility surfaces. Figure 4 shows the comparison of the Top40 index performance since September 2005 with the fractional volatility and Hurst exponents from the calibrated FBSI volatility surface model and the LC volatility term structure model.
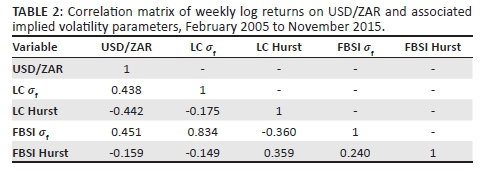
Visual inspection confirms the well-documented inverse relationship between index performance and fractional volatility (i.e. 1-year implied volatility) and also suggests a positive relationship between index performance and the Hurst exponent, particularly evident during the 2008 financial crisis. This is confirmed by the moderately positive correlation values of 0.47 and 0.45 displayed for each model respectively, in Table 1. There are also times when one sees significant changes in the Hurst exponent without any large, associated downturns in the index. For example, the Hurst exponent fell materially from a high of 0.67 down to 0.46 during the first half of 2013, while the index remained range-bound around the 35 000-level. Over the same period, fractional volatility also remained fairly stable between 16% and 18% and only picked up briefly around the middle of 2013. This suggests that the Hurst exponent and fractional volatility capture somewhat different aspects of the uncertainty within the index and thus provide one with more detailed information on the underlying price process.
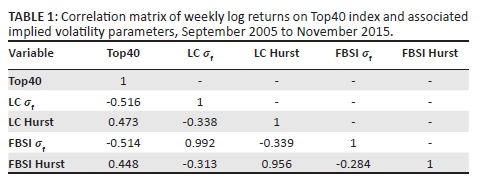
This suggestion is borne out by the correlation between fractional volatility and the Hurst exponent shown in Table 1. Although it is negative as one would expect, it is considerably lower in absolute terms than the correlations displayed between the respective parameters and the underlying index returns. Therefore, deconstructing the single implied volatility number into a long memory component and a long memory-conditioned volatility component may well have useful application in a wide range of financial applications, including derivatives trading, risk management and dynamic asset allocation. For example, discrete delta-hedging strategies could potentially be improved by incorporating the Hurst exponent as a means of identifying how rough or smooth the index returns are likely to be and also whether the index is currently more likely to mean-revert or continue trending. For now, we leave application of the implied Hurst exponent for future research.
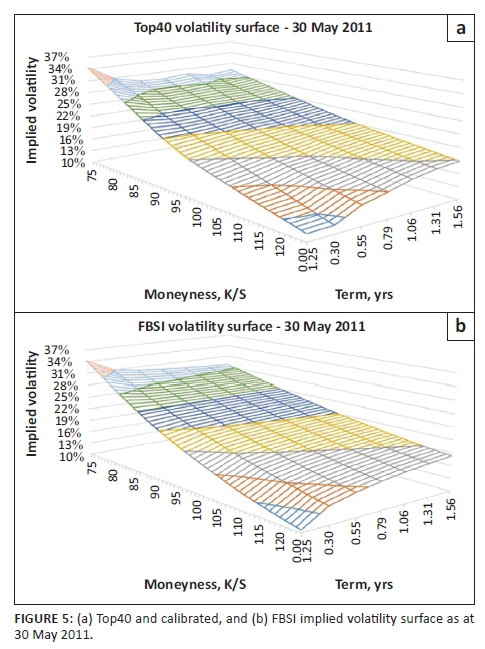
Notice that the ATM FBSI fractional volatility time series is nearly identical to the LC fractional volatility series, with a correlation of 0.99. The ATM Hurst exponent time series is also very similar across models with a correlation of 0.96, although slight deviations are evident in the final 2 years of the sample period. This high degree of equivalence indicates that the FBSI model provides sufficient flexibility to model the ATM term structure accurately even while fitting the complete index volatility surface. Figure 5 confirms this by displaying the Top40 traded volatility surface and its calibrated FBSI counterpart as at 30 May 2011. The modelled surface mirrors the market surface very well at most terms and moneyness levels, although there are a couple of small areas on the market surface where the power law model assumption is violated.
The reason why the FBSI model fits the equity surfaces so well is shown in Figure 6. The calibrated FBSI parameter curves are compared to those obtained from separately fitting the LC term structure models at each moneyness level. For our data, this equates to running 51 independent regressions, which ensures a very accurate fit of the surface thanks to the use of 102 parameters. Although clearly not a viable candidate for modelling the surface directly, this LC 'multi-model' provides one with an excellent means of evaluating whether the quadratic and SVI functions provide sufficient flexibility for capturing the required strike dependence in fBm volatility parameters.
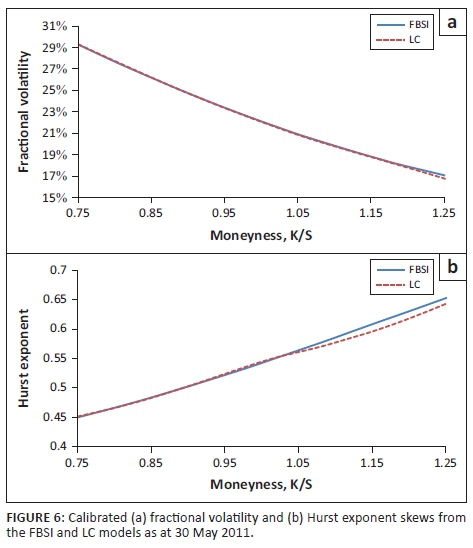
As Figure 6 shows, the fractional volatility curves from both models are essentially equivalent, while the FBSI Hurst exponent shows a slight deviation from the LC multi-model curve above the 105% moneyness level. This discrepancy is responsible for the difference at high moneyness levels and very short terms between the traded and fitted volatility surfaces shown in Figure 5.
Fractional Black-Scholes-inspired currency volatility surfaces
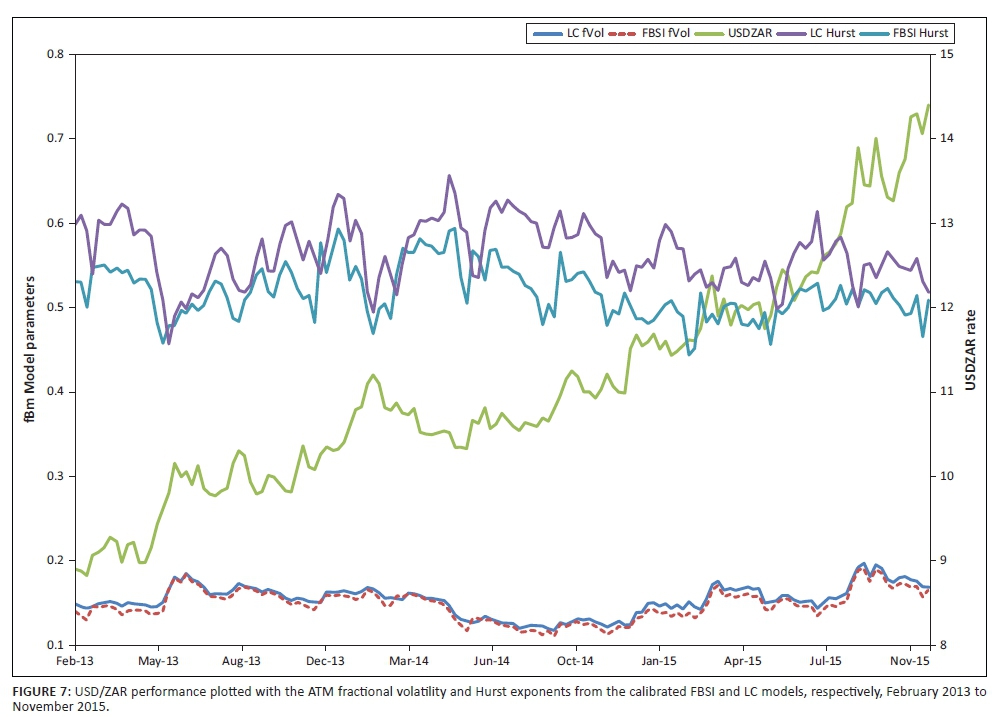
Figure 7 shows the FBSI and LC model parameters from February 2013 in comparison with the underlying USD/ZAR foreign exchange rate. In contrast to the results given in the 'FBSI index volatility surfaces' section, there are significant differences between the FBSI and LC Hurst exponents evident across the full sample period. The FBSI Hurst exponent is almost always lower than its LC counterpart and the positive correlation of 0.36 is much lower than one would expect given that both time series represent the same parameter. Fractional volatility is far more similar across the two models, with a correlation of 0.83. There are still noticeable differences though, with FBSI fractional also generally lower than LC fractional volatility across the period.
Table 1 also shows the expected positive relationship between exchange rate and fractional volatility (ρ = 0.44). Interestingly, a similar but negative relationship is evident between exchange and LC Hurst exponent (ρ − 0.44) but not for the FBSI Hurst parameter (ρ = − 0.16). Furthermore, note that while the USD/ZAR has consistently trended upwards over the sample period, both Hurst exponent and fractional volatility parameters remained largely range-bound for most of the period. Only over the last year has one seen a slight decline in Hurst levels and a concurrent increase in fractional volatility levels as the size of the weekly exchange rate moves has grown. Finally, Table 1 shows that the correlation between LC parameters is weak and negative, while that between the FBSI parameters is instead mildly positive. This again suggests a certain level of independence between the two implied volatility components.
The large differences between the FBSI and LC parameters indicate that, in its current form, the FBSI model is unable to adequately replicate the currency implied volatility surface. Figures 8 and 9 show the problem for an example currency surface as at 28 April 2015. The traded volatility skews are significantly sloped for strikes above the forward level and remain so even for longer terms. In contrast, the surface is less sloped for strikes below the forward level and flattens off a fair degree with term. However, because the short-term implied volatility skew flattens out at lower moneyness levels, so does the curvature of the respective term structures.
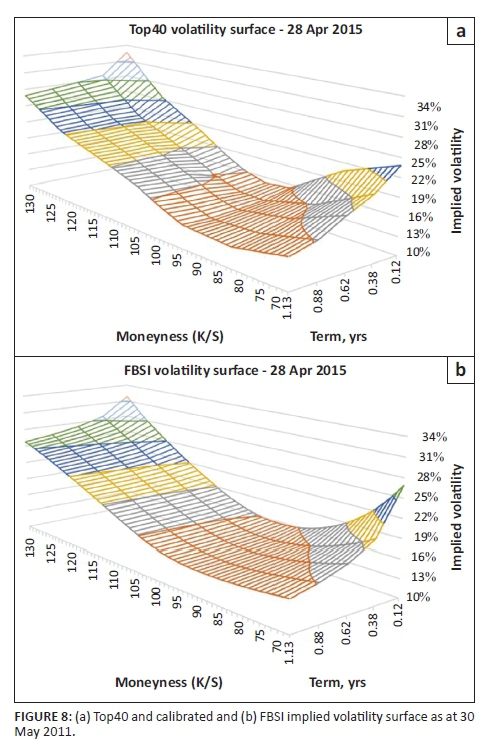
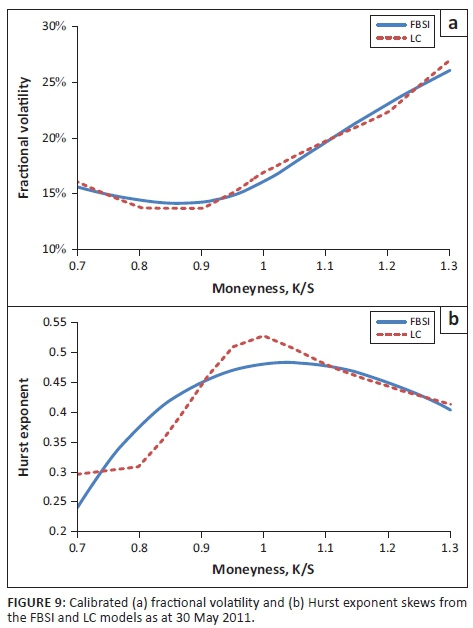
Combining these observations implies that the Hurst exponent would not only need to be convex but also include inflection points at low moneyness levels and possibly also at high moneyness levels, as shown in the lower panel of Figure 9. The assumed quadratic function is not capable of this, and thus the calibrated Hurst function represents a trade-off between matching the required level of ATM convexity and minimising the mismatch for far out of the money volatility points. Therefore, we would suggest using a different functional form for the Hurst exponent in the currency derivatives space. Given the need for an inflection point in the Hurst exponent curve, the most obvious starting point would be a third-order polynomial. For now, we leave this remark as an avenue for future research. The calibrated FBSI volatility surface shown in Figure 8 still manages to capture most of the traded surface's characteristics with the added benefit of being fully analytic; an important consideration when valuing exotic derivatives under local volatility.
Conclusion
This article addresses several theoretical and practical issues in option pricing and implied volatility calibration in a fractional Black-Scholes market. We start off by discussing how options can be priced when the noise component of the underlying risky asset is driven by an fBm. We then describe the links between standard Black-Scholes volatility and fractional Black-Scholes volatility and highlight two important observations. Firstly, the fractional Black-Scholes model admits a non-constant implied volatility term structure when the Hurst exponent is not equal to 0.5. More specifically, this term structure is described by a power function and is up-sloping (down-sloping) when the Hurst exponent is greater (less) than 0.5. Secondly, 1-year implied volatility is independent of the Hurst exponent and equivalent to fractional volatility.
Building on these two observations, we show how one can construct realistic implied volatility surfaces by assuming simple parameterisations for the fractional volatility and Hurst exponent. In particular, we introduce the eight-parameter FBSI model. This novel deterministic volatility surface model is based on the fractional Black-Scholes framework and uses Gatheral's (2004) SVI parameterisation for the fractional volatility skew and a quadratic parameterisation for the Hurst exponent skew. One benefit of this model is that it provides us with a parsimonious decomposition of the implied volatility surface into an independent long memory component and a conditional volatility component. Such a decomposition could be usefully applied in a wide range of financial applications, including derivatives trading, risk management and dynamic asset allocation.
We address the issue of arbitrage-free calibration for the FBSI model in depth and prove in general that any FBSI volatility surface will be free from calendar spread arbitrage. Although one cannot make a similar statement about butterfly spread arbitrage, we show that it is simple to control for this during the calibration process because of the fully analytical form of the surface.
Finally, we test the FBSI model empirically against Li and Chen's (2014) volatility term structure model using implied volatility surfaces on South African listed Top40 index futures options and on listed USD/ZAR currency futures options. We find that the FBSI model fits the equity implied volatility surfaces very well and, furthermore, that the decomposition of implied volatility into its long memory and fractional volatility components provides one with more detailed information on the true uncertainty in the underlying asset price process. The currency implied volatility surfaces provide more of a calibration challenge for the FBSI model because of a flattening in the term structure at far out of the money strikes. The calibrated FBSI volatility surface still manages to capture most of the traded surfaces' characteristics with the added benefit of being fully analytic; an important consideration when valuing exotic derivatives under local volatility.
Acknowledgements
The authors wish to express their gratitude towards the editorial staff as well as the two anonymous referees for their helpful comments and suggestions.
Competing interests
The authors declare that they have no financial or personal relationships that may have inappropriately influenced them in writing this article.
Authors' contributions
Joint research efforts.
References
Alvarez-Ramirez, J., Alvarez, J., Rodriguez, E. & Fernandez-Anaya, G., 2008, 'Time-varying Hurst exponent for US stock markets', Physica A: Statistical Mechanics and its Applications 387(24), 6159-6169. https://doi.org/10.1016/j.physa.2008.06.056 [ Links ]
Alvarez-Ramirez, J., Cisneros, M., Ibarra-Valdez, C. & Soriano, A., 2002, 'Multifractal Hurst analysis of crude oil prices', Physica A: Statistical Mechanics and its Applications 313(3), 651-670. https://doi.org/10.1016/S0378-4371(02)00985-8 [ Links ]
Andersen, T.G. & Bollerslev, T., 1997, 'Heterogeneous information arrivals and return volatility dynamics: Uncovering the long-run in high frequency returns', Journal of Finance 52, 975-1005. https://doi.org/10.3386/w5752 [ Links ]
Baillie, R.T., Bollerslev, T. & Mikkelsen, H.O., 1996, 'Fractionally integrated generalized autoregressive conditional heteroskedasticity', Journal of Econometrics 74(1), 3-30. https://doi.org/10.1016/S0304-4076(95)01749-6 [ Links ]
Biagini, F., Hu, Y., Øksendal, B. & Zhang, T., 2008, Stochastic calculus for fractional Brownian motion and applications, Springer Science & Business Media, Berlin. [ Links ]
Black, F., 1976, 'The pricing of commodity contracts', Journal of Financial Economics 3(1), 167-179. https://doi.org/10.1016/0304-405X(76)90024-6 [ Links ]
Black, F. & Scholes, M., 1973, 'The pricing of options and corporate liabilities', The Journal of Political Economy 1, 637-654. https://doi.org/10.1086/260062 [ Links ]
Britten-Jones, M. & Neuberger, A., 2000, 'Option prices, implied price processes, and stochastic volatility', The Journal of Finance 55(2), 839-866. https://doi.org/10.1111/0022-1082.00228 [ Links ]
Cajueiro, D.O. & Tabak, B.M., 2004, 'The Hurst exponent over time: Testing the assertion that emerging markets are becoming more efficient', Physica A: Statistical Mechanics and its Applications 336(3), 521-537. https://doi.org/10.1016/j.physa.2003.12.031 [ Links ]
Carr, P., Geman, H., Madan, D.B. & Yor, M., 2005, 'Pricing options on realized variance', Finance and Stochastics 9(4), 453-475. https://doi.org/10.1007/s00780-005-0155-x [ Links ]
Carr, P. & Madan, D.B., 2005, 'A note on sufficient conditions for no arbitrage', Finance Research Letters 2(3), 125-130. https://doi.org/10.1016/j.frl.2005.04.005 [ Links ]
Comte, F. & Renault, E., 1996, 'Long memory continuous time models', Journal of Econometrics 73(1), 101-149. https://doi.org/10.1016/0304-4076(95)01735-6 [ Links ]
Comte, F. & Renault, E., 1998, 'Long memory in continuous-time stochastic volatility models', Mathematical Finance 8(4), 291-323. https://doi.org/10.1111/1467-9965.00057 [ Links ]
Cont, R., 2001, 'Empirical properties of asset returns: Stylized facts and statistical issues', Quantitative Finance 1(2), 223-236. https://doi.org/10.1080/713665670 [ Links ]
Cont, R. & Da Fonseca, J., 2002, 'Dynamics of implied volatility surfaces', Quantitative Finance 2(1), 45-60. https://doi.org/10.1088/1469-7688/2/1/304 [ Links ]
Damghani, B.M. & Kos, A., 2013, 'De-arbitraging with a weak smile: Application to skew risk', Wilmott 64, 40-49. https://doi.org/10.1002/wilm.10201 [ Links ]
De Marco, S. & Martini, C., 2009, 'Quasi-explicit calibration of Gatheral's SVI model', Zeliade White Paper, 1-15. [ Links ]
Dumas, B., Fleming, J. & Whaley, R.E., 1998, 'Implied volatility functions: Empirical tests', The Journal of Finance 53(6), 2059-2106. https://doi.org/10.1111/0022-1082.00083 [ Links ]
Dupire, B., 2006, Model free results on volatility derivatives, Working paper, SAMSI, Bloomberg, NY. [ Links ]
Elliott, R.J. & Van der Hoek, J., 2003, 'A general fractional white noise theory and applications to finance', Mathematical Finance 13(2), 301-330. https://doi.org/10.1111/1467-9965.00018 [ Links ]
Gatheral, J., 2004, 'A parsimonious arbitrage-free implied volatility parameterization with application to the valuation of volatility derivatives', Presentation at Global Derivatives & Risk Management, Madrid, 26th May. [ Links ]
Gatheral, J., 2006, The volatility surface: A practitioner's guide, vol. 357, John Wiley & Sons, New York. [ Links ]
Gatheral, J. & Jacquier, A., 2014, 'Arbitrage-free SVI volatility surfaces', Quantitative Finance 14(1), 59-71. https://doi.org/10.1080/14697688.2013.819986 [ Links ]
Heston, S.L., 1993, 'A closed-form solution for options with stochastic volatility with applications to bond and currency options', Review of Financial Studies 6(2), 327-343. https://doi.org/10.1093/rfs/6.2.327 [ Links ]
Hu, Y. & Øksendal, B., 2003, 'Fractional white noise calculus and applications to finance', Infinite Dimensional Analysis, Quantum Probability and Related Topics 6(1), 1-32. https://doi.org/10.1142/S0219025703001110 [ Links ]
Hurst, H.E., 1951, 'Long-term storage capacity of reservoirs', Transactions of the American Society of Civil Engineers 116, 770-808. [ Links ]
Karuppiah, J. & Los, C.A., 2005, 'Wavelet multiresolution analysis of high-frequency Asian FX rates', International Review of Financial Analysis 14(2), 211-246. https://doi.org/10.1016/j.irfa.2004.06.014 [ Links ]
Kotzé, A. & Joseph, A., 2009, 'Constructing a South African Index volatility surface from exchange traded data', Johannesburg Securities Exchange White Paper, 1-37. Available at SSRN 2198357. [ Links ]
Lee, R.W., 2004, 'The moment formula for implied volatility at extreme strikes', Mathematical Finance 14(3), 469-480. https://doi.org/10.1111/j.0960-1627.2004.00200.x [ Links ]
Li, K.Q. & Chen, R., 2014, 'Implied Hurst exponent and fractional implied volatility: A variance term structure model', Social Science Research Network, January, 1-16. https://doi.org/10.2139/ssrn.2383618 [ Links ]
Mandelbrot, B.B., 2013, Fractals and scaling in finance: Discontinuity, concentration, risk, Selecta Volume E, Springer Science & Business Media, Berlin. [ Links ]
Mandelbrot, B.B. & Van Ness, J.W., 1968, 'Fractional Brownian motions, fractional noises and applications', SIAM Review 10(4), 422-437. https://doi.org/10.1137/1010093 [ Links ]
Merton, R.C., 1973, 'An intertemporal capital asset pricing model', Econometrica 1, 867-887. https://doi.org/10.2307/1913811 [ Links ]
Müller, U.A., Dacorogna, M.M. & Pictet, O.V., 1998, 'Heavy tails in high-frequency financial data', in R.J. Adler, R.E. Feldman & M.S. Taqqu (eds.), A practical guide to heavy tails: Statistical techniques and applications, p. 55-77, Birkhäuser, Boston, MA. [ Links ]
Necula, C., 2002, Option pricing in a fractional Brownian motion environment [R/OL], Academy of Economic Studies Bucharest, Romania. [ Links ]
Peters, E.E., 1989, 'Fractal structure in the capital markets', Financial Analysts Journal 45(4), 32-37. https://doi.org/10.2469/faj.v45.n4.32 [ Links ]
Peters, E.E., 1994, Fractal market analysis: Applying chaos theory to investment and economics, vol. 24, John Wiley & Sons, New York. [ Links ]
Rejichi, I.Z. & Aloui, C., 2012, 'Hurst exponent behavior and assessment of the MENA stock markets efficiency', Research in International Business and Finance 26(3), 353-370. https://doi.org/10.1016/j.ribaf.2012.01.005 [ Links ]
Rogers, L.C.G. & Tehranchi, M.R., 2010, 'Can the implied volatility surface move by parallel shifts?', Finance and Stochastics 14(2), 235-248. https://doi.org/10.1007/s00780-008-0081-9 [ Links ]
Roper, M., 2010, Arbitrage free implied volatility surfaces, preprint, School of Mathematics and Statistics, The University of Sydney, Sydney, New South Wales, Australia. [ Links ]
Serinaldi, F., 2010, 'Use and misuse of some Hurst parameter estimators applied to stationary and non-stationary financial time series', Physica A: Statistical Mechanics and its Applications 389(14), 2770-2781. https://doi.org/10.1016/j.physa.2010.02.044 [ Links ]
Simonsen, I., 2003, 'Measuring anti-correlations in the Nordic electricity spot market by wavelets', Physica A: Statistical Mechanics and its applications 322, 597-606. https://doi.org/10.1016/S0378-4371(02)01938-6 [ Links ]
Tzouras, S., Anagnostopoulos, C. & McCoy, E., 2015, 'Financial time series modeling using the Hurst exponent', Physica A: Statistical Mechanics and its Applications 425, 50-68. https://doi.org/10.1016/j.physa.2015.01.031 [ Links ]
 Correspondence:
Eben Maré
eben.mare@up.ac.za
Received: 26 Dec. 2015
Accepted: 21 Sept. 2016
Published: 29 Mar. 2017
1 Even though a quadratic volatility function does not satisfy Lee's moment formula (Roper 2010), it is still widely used in practice (Kotzé & Joseph 2009).
2 At the money, or ATM, refers to when the option strike is equal to the underlying forward price, i.e. k = 0.
3 Although the concept of fractional volatility models has been around since the work of Comte and Renault (1996, 1998) and Baillie, Bollerslev and Mikkelsen (1996), this is essentially a subfield of the much larger stochastic volatility literature - continuous and discrete - where fractional noise rather than Gaussian noise is used within the volatility process. In comparison, this work differs in three aspects. Firstly, the use of fractional noise is restricted to the stock price process. Secondly, this work falls within the deterministic rather than stochastic volatility modelling literature. Thirdly, the Hurst exponent is assumed to be a non-constant function of strike and time rather than a constant parameter in a volatility process.
4 This second benefit stems from the fact that model-free implied volatility is calculated using the complete volatility skew at each term.

