


Services on Demand
Article
 English (pdf)
 Article in xml format
 Article references
Indicators

Related links
-
 Cited by Google
 -
 Similars in Google
Share

 Permalink
South African Journal of Economic and Management Sciences
On-line version ISSN 2222-3436
Print version ISSN 1015-8812
S. Afr. j. econ. manag. sci. vol.19 n.5 Pretoria 2016
http://dx.doi.org/10.17159/2222-343/2016/v19n5a8
ARTICLES
The opportunity cost of not utilising the woody invasive alien plant species in the Kouga, Krom and Baviaans catchments in South Africa
Thulile VundlaI, *; James BlignautII, III; Nonophile NkambuleI, IV; Tshepo MorokongI; Shepherd MudavanhuI, V
IASSET Research, Pretoria
IIDepartment of Economics, University of Pretoria
IIISouth African Environmental Observation Network, Pretoria
IVDepartment of Agricultural Economics and Management, University of Swaziland, Swaziland
VDepartment of Agricultural Economics, University of Stellenbosch
ABSTRACT
This study estimates the opportunity costs of using woody invasive alien plants (lAPs) for value-added products by estimating the net economic return from the value-added industries in South Africa. By 2008, IAPs were estimated at the national level to cover an area of 1 813 million condensed hectares in South Africa. A market has formed around their use for value-added products (VAP) like charcoal, firewood and timber in the Kouga, Kromme and Baviaans River catchments in the Eastern Cape province of South Africa. The net economic return from these value-added industries was estimated for the purpose of several management scenarios, and was then used to estimate the opportunity costs if they were not used. A system dynamics model was used to value and analyse the Net Present Value of clearing in the study area and to estimate the opportunity cost of the non-use of VAP. The study showed that the inclusion of VAPs in the project would yield higher net present values for clearing. The findings from this study suggest that a co-finance option of the total economic returns from VAP for clearing costs is the best management scenario for reducing the costs of clearing and maximising the net economic returns from clearing. The net economic returns of VAPs by 2030 are estimated at R23 million without the co-finance option and R26 million with the option. The cumulative net income from VAPs with co-financing over the period of valuation is estimated to be R609 million.
Key words: opportunity cost, alien invasive plants, direct use value, eradication through utilisation
JEL: Q24, 25, 42
1 Introduction
Biological invasions are a significant threat to land productivity, biodiversity and the ecosystem goods and services provided for society in general (Nellemann & Corcoran, 2010). In South Africa the National Department of Environmental Affairs: Natural Resource Management (DEA:NRM) is tasked with the management and control of invasive alien plants (IAPs). As early as the 1900s, the potentially unfavourable impact of IAPs on South Africa's natural fynbos vegetation was acknowledged (Moran, Hoffman & Zimmermann, 2013). Later, (Cowling, 1992), the DEA:NRM programme was commissioned in 1995 to control IAPs (Van Wilgen, Cowling & Burgers, 1996; Blignaut, Marais & Turpie, 2007; Blignaut, Mander, Schulze, Horan, Dickens, Pringle, Mavundla, Mahlangu, Wilson, McKenzie & McKean, 2010).
Research on resource economics has been instrumental in providing motivation for the expensive DEA:NRM programme, and several South African studies have used a cost-benefit analysis of clearing IAPs to inform decision-making (e.g. Van Wilgen, Cowling & Burgers, 1996; Higgins, Richardson & Cowling, 1996; Hosking & Du Preez, 1999; Hosking & Du Preez, 2004; Turpie & Heydenrych, 2000; De Wit, Crookes & Van Wilgen., 2001; Wise, Van Wilgen & Le Maitre, 2012). This study is intended to contribute to the growing number of studies by investigating the potential benefit of private-sector investment in the DEA:NRM programme.
Potential economic gains from IAPs present an opportunity for government to source co-funding from the private sector for the control and management of IAPs, and, in the process, support rural livelihoods through the sale of products derived from IAPs (Van Wilgen & Richardson, 2012; Shackleton, Le Maitre, Pasiecznik & Richardson, 2014). However, there are challenges, especially when it comes to the extraction of IAPs. Mugido, Blignaut, Joubert, De Wet, Knipe, Joubert, Cobbing, Jansen, Le Maitre & Van Der Vyfer (2014) suggest on-site processing as a possible alternative to addressing the issue with transportation. It is also clear that conflict-of-interest species, such as black wattle, pine trees and Prosopis, require innovative methods of management. Currie, Milton, & Steenkamp (2009) conducted a cost benefit analysis (CBA) of clearing Pinus species and restoring fynbos in the Assegaaibos mountain catchment area in the Western Cape province of South Africa. They found that the NPV of clearing Pinus species and restoring fynbos was always negative, regardless of the discount rate used. However, if the economic value of the IAPs is used to co-finance the operations, this could result in a feasible option. Thus, this study sought to determine the costs and benefits of early restoration in the Kouga-Krom catchment area in the Eastern Cape province of South Africa. As some of the species that are being cleared by the DEA:NRM are of commercial value, this study estimated the opportunity costs of not using IAPs for value-added industries. Further, the study also estimated the Unit Reference Value (URV) for clearing IAPs in the Kouga-Krom study area.
2 Site description
The study area (referred to as Kouga-Krom) falls within the Kromme, Kouga and Baviaans river catchments in the Eastern Cape Province, near Jeffrey's Bay. It spans a total of 5 234.24 km2, with a mean annual rainfall ranging between 500-2 000 mm per annum (SAWS, 2015). It consists of two biome types, fynbos (80 per cent) and Albany thicket (20 per cent) (Mander, Blignaut, Van Niekerk, Cowling, Horan, Knoesen, Mills, Powell & Schulze, 2010), both of which are biodiversity hotspots and areas of high endemism (Global Biodiversity Outlook, 2010; Hoare, Mucina, Rutherford, Vlok, Euston-Brown, Palmer, Powrie, Lechmere-Oertel, Proches, Dold & Ward, 2006; Myers, 1990) because of the geological features of the area. The fynbos biome is one of the most invaded biomes in South Africa (Richardson, MacDonald, Hoffman & Henderson, 1997; Kotzé, Beukes, Van Den Berg & Newby, 2010).
The study area comprises 14 sub-quaternary catchments, L81A-C, L82A-J & L90A-C within the Fish to Tsitsikamma river catchment. The majority of the land is under private land tenure (Mander, Blignaut, Van Niekerk, Cowling, Horan, Knoesen, Mills, Powell & Schulze, 2010), with intensive deciduous fruit, lucerne and citrus production (Jansen, 2008). Protected areas are limited to the upper regions of the study area in the Baviaans catchment and it is recognised internationally as a world heritage site (Jansen, 2008). The study area is largely rural, containing only small communities, while the population density is generally low, with 20-40 people/km2 and unemployment in the area is high, ranging from 30-40 per cent (StatsSA, 2011).
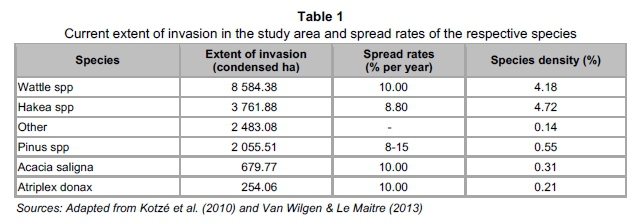
The study area is under additional pressure from extensive farming and other agricultural activities in the area (Mander, Blignaut, van Niekerk, Cowling, Horan, Knoesen, Mills, Powell & Schultze, 2010; Jansen, 2008). IAPs are an increasing problem, particularly in the lower regions, with Acacia baileyana, A. dealbata & A. mearnsii (hereafter referred to as Wattle spp) being one of the greatest threats in the area (Mander, Blignaut, van Niekerk, Cowling, Horan, Knoesen, Mills, Powell & Schultze, 2010). Table 1 outlines the current extent of invasion in the study area. These pressures increase the strain on the availability of water for the catchment
3 Methods and material
3.1 Data collected
Primary data was sourced during a series of site visits and group discussions, with experts, as well as implementing agents for the DEA:NRM programme. The data gathered from experts and implementing agents was supplemented with data from the literature on the indicators required for an economic analysis. The condensed values for the IAPs and related information were extracted from the. (2010) database for Kotzé, Beukes, Van Den Burg & Newby (see Table 1). This study focuses exclusively on the five dominant species found in the areas noted by Kotzé, Beukes, Van Den Berg & Newby (2010).
3.1.1 Value added products
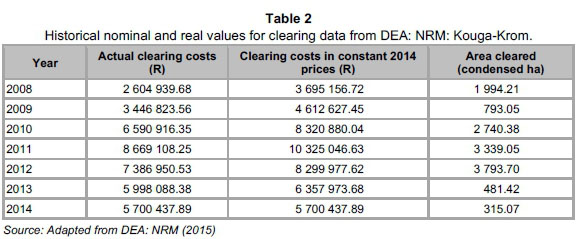
Only the main benefits deriving from Wattle spp. and Acacia saligna and Pinus species were considered in this study, as the benefits of the other IAP species are not considered economically significant (CABI, 2016). Wattle spp., for example, are Australian Acacia species and comprise a combination of Acacia baileyana, A. dealbata and A. mearnsii. These were intentionally introduced into South Africa for the ecological services they provide, such as serving as wind breaks and providing fuel (De Wit, Crookes, Van Wilgen, 2001; Nyoka, 2003). Wattle spp. have become one of South Africa's most widespread IAPs (Nyoka, 2003; Versfeld, Le Maitre & Chapman, 1998; Dye & Jarmain, 2004), and thus became the most targeted IAPs, with almost a third of all the clearing costs attributed to the control of Wattle spp. (Wise, Van Wilgen, & Le Maitre, 2012). The investment in controlling IAPs in the Kouga-Krom catchment for the period 2008-2014 is provided in Table 2.
While it is important to control IAPs with their detrimental effects on a range of ecosystem goods and services, such as water flows, they can be used to generate value through a range of value-added products (VAP), which are listed in Table 3.
3.2 Development of an economic model
The economic model used in this study is a system dynamics model based on the work of Forrester (1961), and will be described below. Vensin® software was used for the conceptualisation and development of the economic model to estimate the opportunity costs of not using IAPs for commercial benefit (Ventana Systems, 2003).
3.2.1 Model description
The model investigated the benefits and cost of early restoration in relation to waiting until an area becomes heavily invaded. The model further investigates the potential benefits of value-added industries to the DEA:NRM programme through recommending a policy variable co-financing to reduce the costs of clearing . The model was run for 22 years (2008-2030) and consisted of six sub-models, which were land use, clearing cost, value-added products, water consumption, carbon sequestration and economic factors.
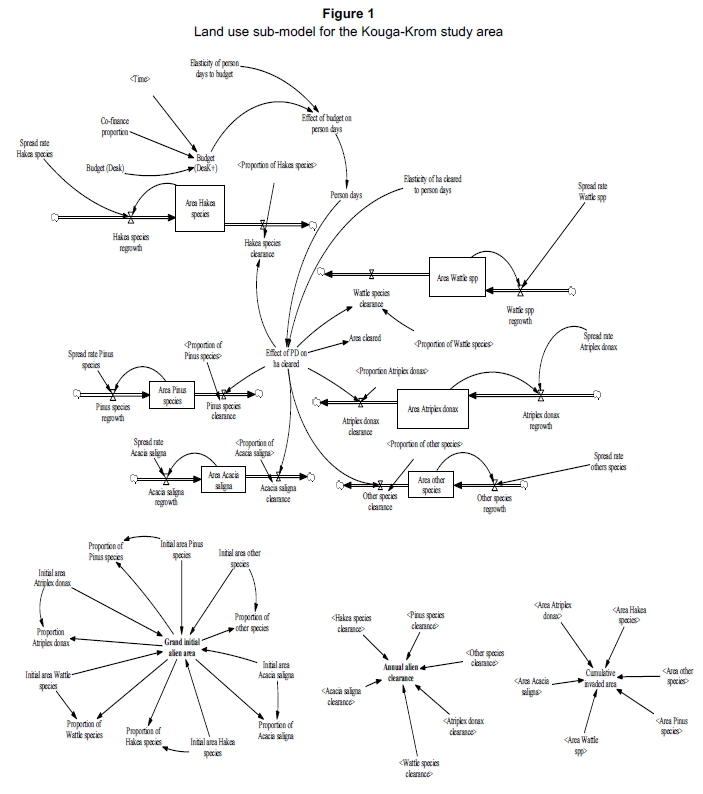
The sub-model for land use focused on the extent of alien invasion and clearance at the study area (see Figure 1). The parameters informing this sub-model are listed in Table 1. The stock variables are areas invaded by Hakea spp., Wattle spp., Pinus spp., Atriplex donax, Acacia silinga and other species. The 'other species' represent the less dominant IAPs found at the study site. Each stock variable in the land-use sub-model depicts the extent of invasion, which is increased by regrowth and reduced by clearance. The IAP regrowth is increased by the spread rate and the area invaded. The IAP clearance is a function of person days which, in turn, are a function of the budget. Regression models were run in the Vensim® modelling software to estimate the functions.
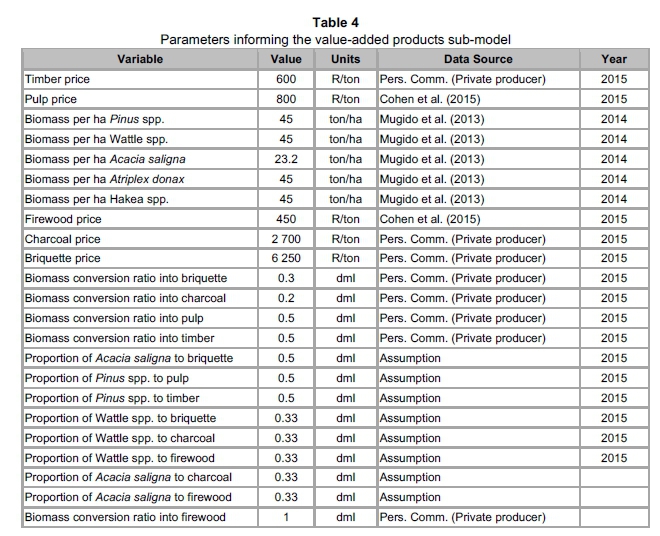
The value-added products sub-model in this study was concerned with estimating the net ecominc returns from VAPs. The biomass values were allocated to a selection of VAPs (see Table 4) . The value-added industries considered were charcoal, firewood, briquette, pulp and timber. The quantities were corrected for losses and then multiplied by the corresponding prices to yield the total revenue from each. The summation of the total revenue multiplied by the profit margin ratio yielded the net income from VAPs. The parameters informing this sub-model are listed in Table 4. Values that inform more than one sub-model are not repeated. To establish confidence in the developed model several validity test were applied in Vensim ®. A short description of the validity test applied in this study in the Appendix.
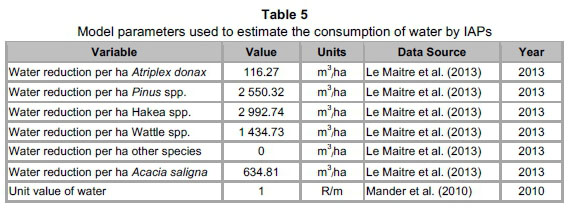
The water consumption sub-model estimates the value of the water lost to IAPs, using the agricultural value of water. The total IAP water consumption is a summation of the water use by the various IAPs which, in turn, is a product of the individual IAPs water reduction per hectare and the area that was cleared. The IAPs water consumption coupled with the unit value of water yields the water value potentially saved. The parameters and equations used are given in Table 5 and Appendix A respectively.
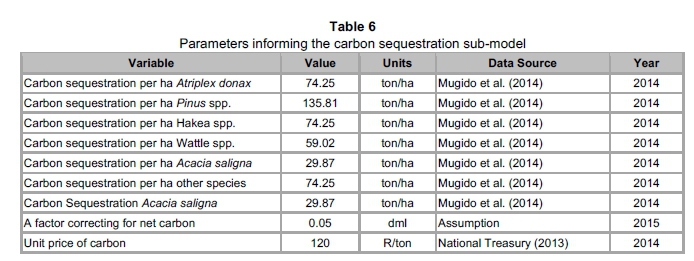
The carbon sequestration sub-model demonstrates the net carbon value that is lost owing to clearing IAPs at the study site. Table 6 shows the parameters set for this sub-model. IAPs use carbon during the photosynthesis process and, in turn, reduce greenhouse gases in the atmosphere. For this reason, the carbon sequestration potential is lost when IAPs are cleared. The sequestrated carbon is a product of the species biomass, clearance, percent carbon (i.e. percent oven dry biomass) and the C:CO2 ratio. The model equations are found in Appendix A.
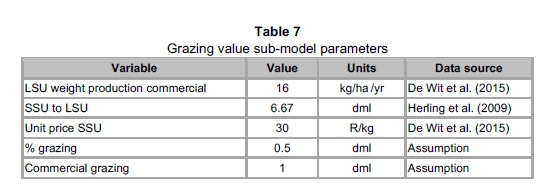
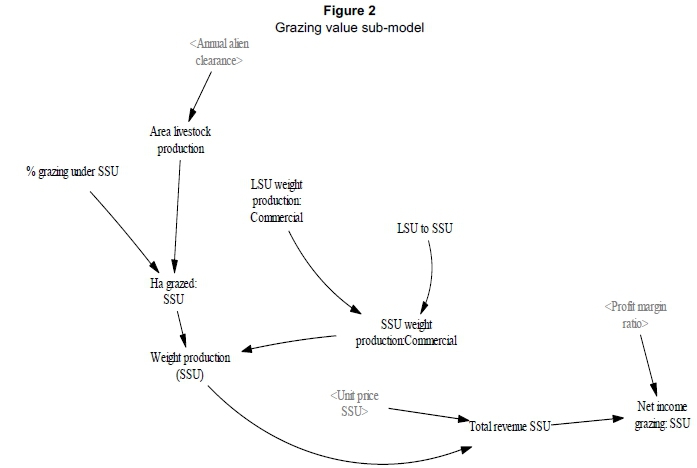
While there are several potential land uses after clearing the IAPs, we focus here on grazing. For this reason, the grazing value sub-model (see Figure 2) models the net income that could be derived from livestock (mainly sheep) production at the study site once the IAPs have been cleared. This sub-model therefore models only small stock units (SSU). The hectares grazed by SSU are given by the area cleared and corrected, as the entire area could not be used for potential grazing (i.e. the factor "% grazing under SSU"). The hectares grazed by SSU multiplied by the SSU weight production (ha/yr) yields the weight production by SSU. The SSU weight production is a product of the LSU weight production and the LSU to SSU conversion factor of 6,67. The weight production together with the unit price of SSU yields the total revenue from SSU. This is then multiplied with the profit-margin ratio to determine the net income from grazing SSU. A list of the parameters that informed this model is given in Table 7.
The clearing cost sub-model demonstrates the total cost of clearing the IAPsfor the study site. The unit clearing cost is calculated by dividing the budget by the annual IAP clearance. The budget denotes either the funds that were invested by DEA to clear IAPs at the study site between 2008 and 2015 and/or an exploration of various budget-related clearing interventions aimed at reducing IAPs between 2015 and 2030. The product of the unit clearing cost and the annual IAP clearance yields the total clearing cost.
The economic sub-model estimates both the net income from clearing IAPs at the study site and the URV. The applied discount rate for this study is 6 per cent, based on a suite of rates used by government. The net income from clearing IAPs is the sum of i) the net income from VAPs, ii) the value of the water saved, iii) net income from grazing, and less i) the net carbon value lost and ii) the cost of cleaing the IAPs. The calculated cumulative PV clearing cost and cumulative PV water volume were used to determine the URV (Unit Reference Value). The URV, which represents the cost of water per cubic metre over the lifetime of a water infrastructure project and is estimated for comparability with other study areas regarding the cost-effectiveness of various clearing operations is therefore calculated as:
URV = PV of costs / PV of quantity of water incrementally assured
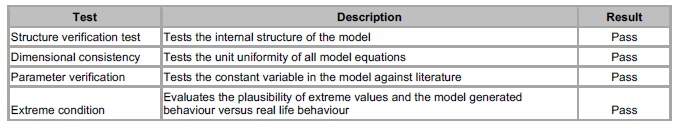
The model validation is performed to test and establish confidence in the model (Forrester & Senge, 1980). Appendix B shows the model validation tests and the outcomes of each validity test.
The study model assumes that the private producers would be willing to co-finance the expense of clearing. Other assumptions in the data in the model include the proportional contribution of each VAP to the net value of value-added industries. It was beyond the scope of this study to quantify the actual proportions of each VAP in the net value of value-added industries. The model assumes that all the grazing value gained in the area is commercial when it comes to the land tenure of the study area, because an insignificant area is under communal land tenure. The model also assumes that only 50 per cent of the area gained from clearing would be suitable for grazing, as not all the cleared area goes to grazing. The final assumption made in the model is the carbon correction factor. This factor (0.05) is applied to cater for the fact that not all the carbon is lost in clearing, as there will be regrowth of some vegetation once the trees have been cleared from the system.
3.2.2 Model scenarios
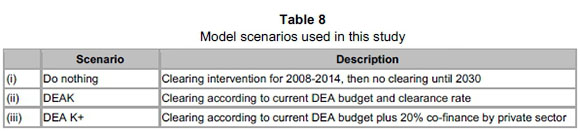
Three scenarios were develop to assess the value of the management options available to DEA:NRM. The Scenarios are described in Table 8 below.
4 Results and findings
4.1 The 'Do nothing' option
The area cleared for the three management scenarios is shown in Figure 3(a). Following 2014 in the "Do nothing' option, no area is cleared. Hence, the costs of clearing shown in Figure 3(b) are zero. Figure 3(c) shows the URV as estimated in this study. Because no additional water is generated in this option, the URV is not considered. Once clearing stops the value of carbon lost to clearing becomes zero, as can be seen in Figure 3 (d).
As there are no clearing operations in this management scenario, no water is saved, as shown in Figure 4(a). The water is essentially lost to invasion. Infestation takes up the grazing areas. Figure 4(b) shows that no grazing value is gained in this option. The total net economic returns from the VAPs is estimated at zero as shown in Figure 4 (c), as in this study we are concerned only with the DEA:NRM cleared biomass. The overall cumulative NPV for this option is R65 million as shown in Figure 4 (d).
4.2 Business as usual option (DEAK)
To clear a total area of 44 400Ha by 2030 a budget of R139 million is required for the business as usual option. The areas cleared and the budget used for each year is shown in Figure 3(a) and (b) respectively. The estimated URV value for this option is shown in Figure 3(c), and is very similar to the DEAK+ option. The estimated average URV value is R1.83/m3 over the duration of the study period. The URV shows an increasing over-time trend. The carbon value lost to clearing in this management option is lower than that in DEAK+ (Figure 3(d))
The benefits of clearing are highlighted in Figure 4. The model finding estimates the net value of water saved at R63 million per annum for this management scenario. The trend in the value of water saved is shown in Figure 4(a). Another benefit of clearing is the grazing area made available following the clearing. The economic returns from grazing following the clearing operations is shown in Figure 4(b) and is estimated at R25 000 per annum in the DEAK scenario. This benefit is lost in the do nothing option. The model output for the VAP are shown in Figure 4(c), the returns are estimated at R23 million per annum and this amount is entirely for private benefit. This management option yields a positive cumulative NPV (Figure 4 (d), because the benefits in the Figure 4 outweigh the cost outlined in Figure 3(a & c).
4.3 DEA Co-financed Option (DEAK+)
The co-financed option seeks to increase the social benefits of clearing by implementing a 20 per cent co-financing from private beneficiaries by means of a policy variable. This management option yields the highest area cleared using the same DEA:NRM budget, with private co-finance. This is shown in Figure 3(a) where about 51 000 Ha over the duration of the simulation. Figure 3 (b) shows the costs of clearing to be R6.8 million per annum (2015 to 2030 and R157 million over the period 2008-2030. This is owing to the increased budget from the co-finance option that is funding the operational costs of clearing. The clearing costs are higher than the business as usual option, owing to the 20 per cent co-finance. The URV value for this option is estimated at R1,81/m3 as shown in Figure 3(c). This value is similar to that of the Business as usual option. The carbon value lost, which is one of the costs of clearing, is illustrated in Figure 3(d).
The value of the water saved was estimated for the co-financed option, and the outputs are illustrated in Figure 4(a). The value of the water saved is estimated at R7.2 million per annum. The grazing value gained through clearing is illustrated by Figure 4(b). The co-financed option has the highest economic returns from grazing gained. Figure 4(c), which illustrates the total economic returns from value-added industries shows that, through the private-public partnership, the net returns are higher than they would be without the co- finance option. This is evident through the value of R26 million per annum for the DEAK+ option compared to the R23 million of DEAK. This option yields a positive cumulative NPV, as illustrated in Figure 4 (d). The NPV of R189 million for DEAK+ is slightly higher than that of R171 million from the business-as-usual scenario.
5 Discussion
The results of this study showed that the current management strategy employed by DEA:NRM (business-as-usual) is not the most economical option. This is mainly owing to the lower clearance rate and reduced benefits of this management option in comparison with other scenarios such as co-financed (DEAK+). NPV of the co-financed scenario (i.e. DEAK+), which explores the feasibility of a public-private partnership through the introduction of a 20 per cent of returns contribution to the costs of the clearing policy variable, suggests that this management option is the best of the three scenarios. By not using the VAPs, as illustrated in the do nothing scenario, the DEA:NRM is running at a negative NPV throughout the duration of the project's lifetime. A positive NPV outcome is seen from the production of the VAP (DEAK scenario). However, the income from the VAP is not invested in the costs of clearing. The results of the study also suggest that investing back into clearing cost increases both the clearance rate and the biomass production of VAP, thus increasing the net economic returns from VAPs.
With the inclusion of VAPs, the DEA:NRM could increase the clearing operations and decrease the public cost of clearing. For all the management options, the URVs are greater than 1, which shows that the Present Value (PV) of the project costs is higher than the PV of the project benefits. The URV value is, however, concerned only with the PV of water, but not the other benefits estimated in this study. The URV in South Africa is an important tool, especially in water production. For instance, the South African National Department of Water Affairs uses the URV to determine the cost-effectiveness of dam construction. Erasmus, Denys, Scherman & Van der Berg (2013) note that the URV for raising the Dam wall of Kouga was estimated at R3.09/m3, which is almost twice the URV estimated for water generation through clearing. This suggest that clearing of invasive alien plants is a cost-effective option in protecting the value of the infrastructure as the opportunity cost of not clearing (R3,09/m3) is higher than the cost of clearing (R1,81/m3).
The DEAK+ scenario yields the highest water value saved, and the VAPs substantially increases the NPV of clearing IAPs, the water value saved, the area cleared and the grazing value gained. This makes it the best management option for achieving the most benefits from clearing. Although, Stubbings (1977) found that most private producers are resistant to the notion of co-financing or paying for clearing IAPs, this option may still be an achievable request. The benefits of early restoration are clearly seen throughout all the sub-models.
A major cost quantified in this study is the loss of carbon stock when clearing the IAPs. Essentially, with greater clearance, more carbon stock is lost. Carbon is valued at R120/ton by the National Treasury. This value is probably an over-estimation because it does not take into account the regrowth of indigenous vegetation. A better estimate of the carbon gains and losses requires a comprehensive study. The 'do nothing' option yields only the carbon stock benefits, but at the expense of the other benefits, which is why its cumulative NPV is negative.
6 Conclusion and recommendations
The main findings of this study suggest that the DEA:NRM could significantly reduce the cost of clearing through partnering with value-added industries in the use of IAPs through a co-finance of 20 per cent of the total revenue. This would also increase the rate of clearing of IAPs while reducing the costs. Both the amount of water saved and the increase in grazing value are benefits that would directly affect the surrounding communities. This study has shown that in projects in which the IAPs are of commercial benefit, there is potential for the DEA:NRM to partner with the industries in order to reduce the costs, and to increase the benefits of early restoration. The total contribution per annum is estimated at R26 million, which is shown to increase the efficiency of the clearing operations. The opportunity costs of not using the IAPs VAPs are high, and the use of IAPs could significantly improve clearing operations and reduce the overall costs of clearing.
Acknowledgements
This study was funded by the DEA:NRM programme, who have supplied the data for this analysis. The authors would also like to extend thanks to all the experts who contributed to the process and the private producers who were involved in the survey. A special thank you is also extended to GIB and Living Lands, which provided data that formed a significant part of this study.
References
BLIGNAUT, J.N., MARAIS, C. & TURPIE, J. 2007. Determining a charge for the clearing of invasive alien plant species to augment water supply in South Africa. Water SA, 33(1):27-34. [ Links ]
BLIGNAUT, J., MANDER, M., SCHULZE, R., HORAN, M., DICKENS, C., PRINGLE, K., MAVUNDLA, K., MAHLANGU, I., WILSON, A., MCKENZIE, M. & MCKEAN, S. 2010. Restoring and managing natural capital towards fostering economic development: Evidence from the Drakensberg, South Africa. Ecological Economics, 69:1313-1323. [ Links ]
CABI. 2016. Invasive Species Compendium. Wallingford: CAB International. [ Links ]
COHEN, B., LOGAN, A., PIETERSE, R. & SWANEPOEL, E. 2015. Casidra: E conomic study on the use of cleared alien biomass for commercial exploitation. The Green House. [ Links ]
COWLING, R.M. 1992. The ecology of fynbos: Nutrients, fire and diversity. Oxford University Press, Cape Town. [ Links ]
CURRIE, B. MILTON, S.J. & STEENKAMP, J.C. 2009. Cost-benefit analysis of alien vegetation clearing for water yield and tourism in a mountain catchment in the Western Cape of South Africa. Ecological Economics, 68:2574-2579 [ Links ]
DE WIT, M.P., CROOKES, D.J. & VAN WILGEN, B.W. 2001. Conflicts of interest in environmental management: estimating the costs and benefits of a tree invasion. Biological Invasions, 3:167-178. [ Links ]
DE WIT, M.P., BLIGNAUT, J.N., KNOT, J., MIDGLEY, S., DRIMIE, S., CROOKES, D.J. & NKAMBULE, N.P. 2015. Sustainable farming as a viable option for enhanced food and nutritional security and a sustainable productive resource base. Synthesis report. Green Economy Research Report, Green Fund, Development Bank of Southern Africa, Midrand. [ Links ]
DYE, P. & JARMAIN, C. 2004. Water use by black wattle (Acacia Mearnsii): Implications for the link between removal of invading trees and catchment streamflow response. South African Journal of Science, 100:40-44. [ Links ]
ERASMUS, D., DENYS, F., SCHERMAN, P. & VAN DER BERG, E. 2013. Evaluation of the raising of Kouga dam. Draft Report Aurecon, Cape Town, South Africa. [ Links ]
FORRESTER, J.W. & SENGE, P.M. 1980. Tests for building confidence in system dynamics models. Time Studies in the Management Science, 14:209-228. [ Links ]
FORRESTER J. W. 1961. Industrial Dynamics. Cambridge, Massachusetts: MIT Press; 1961. [ Links ]
GLOBAL BIODIVERSITY OUTLOOK. 2010. Global biodiversity outlook 3. Montreal, Canada: Secretariat of the Convention on Biological Diversity. (http://gbo3.cbd.int/) [ Links ]
HERLING, M.C., CUPIDO, C.F., O'FARRELL, P.J. & DU PLESSIS, L. 2009. The financial costs of ecologically nonsustainable farming practices in a semiarid system. Restoration Ecology, 17(6):827-836. [ Links ]
HIGGINS, S.I., RICHARDSON, D.M. & COWLING, R.M. 1996. Modelling invasive plant spread: The role of plant environment interactions and model structure. Ecology, 77:2043-2054 [ Links ]
HOARE, D.B., MUCINA, L., RUTHERFORD, M.C., VLOK, J.H.J., EUSTON-BROWN D.I.W., PALMER, A.R., POWRIE, L.W., LECHMERE-OERTEL, R.G., PROCHEŞ, Ş.M., DOLD, A.P. & WARD, R.A. 2006. Albany thicket biome. Strelitzia, 16:541-567. [ Links ]
HOSKING, S.G. & DU PREEZ, M. 1999. A cost benefit analysis of removing alien trees in the Tsitsikamma mountain catchment. South African Journal of Science, 95:442-448. [ Links ]
HOSKING, S.G. & DU PREEZ, M. 2004. Valuation of the freshwater inflows into the Keurbooms estuary by means of a contingent valuation study. South African Journal of Economic and Management Science, 7(2): 280-298. [ Links ]
JANSEN, H.C. 2008. Water for food and ecosystem services in the Baviaanskloof Mega Reserve. Land and water resource assessment in the Baviaanskloof, Eastern Cape, South Africa. Wageningen: Alterra, Alterra Report 1812. [ Links ]
KOTZÉ, I., BEUKES, H., VAN DEN BERG, E. & NEWBY, T. 2010. National invasive alien plant survey, ARC Report No Gw/A/2010/21. Pretoria: Agricultural Research Council. [ Links ]
LE MAITRE, D., FORSYTH, G., DZIKITI, S. & GUSH M. 2013. Estimates of the impacts of alien plants on water flows in South Africa. Water SA, 42(4):659-672. [ Links ]
MANDER, M., BLIGNAUT, J.N., VAN NIEKERK, M., COWLING, R., HORAN, M., KNOESEN, D., MILLS, A., POWELL, M. & SCHULZE, R. 2010. Baviaanskloof-Tsitsikamma PES feasibility: Synthesis report. Everton: Future Works. [ Links ]
MORAN, V.C., HOFFMANN, J.H., ZIMMERMANN, H.G. 2013. 100 years of biological control of invasive alien plants in South Africa: History, practice and achievements. South African Journal of Science, 109:1-6. [ Links ]
MUGIDO, W., BLIGNAUT, J.N., JOUBERT, M., DE WIT, J., KNIPE, A., JOUBERT, S., COBBING, B., JANSEN, J., LE MAITRE, D. & VAN DER VYFER, M. 2013. Determining the quantity and the true cost of harvesting and delivering invasive alien plant species for energy purposes in the Nelson Mandela Metropolitan area. Unpublished Report commissioned by Idc/Ec Biomass. Pretoria: Beatus. [ Links ]
MUGIDO, W., BLIGNAUT, J.N., JOUBERT, M., DE WET, J., KNIPE, A., JOUBERT, S., COBBING, B., JANSEN, J., LE MAITRE, D. & VAN DER VYFER, M. 2014. Determining the feasibility of harvesting invasive alien plant species for energy. South African Journal of Science, 110:1-6. [ Links ]
MYERS, N. 1990. The biodiversity challenge: expended hotspot analysis. The Environmentalist, 10:243-255. [ Links ]
NATIONAL TREASURY. 2013. Carbon tax policy paper: reducing greenhouse gas emissions and facilitating the transition to a green economy. [ Links ]
NELLEMANN, C. & CORCORAN, E. (eds.) 2010. Dead planet, living planet - biodiversity and ecosystem restoration for sustainable development. United Nations Environment Programme. [ Links ]
NYOKA, B.I. 2003. Biosecurity in forestry: a case study on the status of invasive forest trees species in Southern Africa. Forest Biosecurity Working Paper Fbs/1e. Forestry Department, FAO, Rome (Unpublished). [ Links ]
RICHARDSON, D.M., MACDONALD, I.A.W., HOFFMANN, J.H. & HENDERSON, L. 1997. Alien plant invasions. In Cowling, R.M., Richardson, D.M. & Pierce, S.M. (eds.). Vegetation of southern Africa. Cambridge: Cambridge University Press. [ Links ]
STUBBINGS, J.A. 1977. A case against controlling introduced acacias (Acacia). South African Forestry Journal, 102:8-14. [ Links ]
SHACKLETON, R.T., LE MAITRE, D.C. PASIECZNIK, N.M. & RICHARDSON, D.M. 2014. Prosopis: A global assessment of the biogeography, benefits, impacts and management of one of the world's worst woody invasive plant taxa. AoB PLANTS 6: plu027. [ Links ]
SOUTH AFRICAN WEATHER SERVICES. 2015. Historical rain maps. Available at: http://www.weathersa.co.za/climate/historical-rain-maps [accessed September 2015]. [ Links ]
STATISTICS SOUTH AFRICA. 2012. Census 2011. [ Links ]
TURPIE, J. HEYDENRYCH, B. 2000. Economic consequences of alien infestation of the Cape Floral Kingdom's Fynbos vegetation. In PERRINGS, C., WILLIAMSON, M. and DALMAZZONE, S. (eds). The Economics of Biological Invasions. Edward Elgar Publishing Limited. Cheltenham. [ Links ]
VAN WILGEN, B.W., COWLING, R.M. & BURGERS, C.J. 1996. Valuation of ecosystem services: a case study from Fynbos, South Africa. Bioscience, 46:184-189. [ Links ]
VAN WILGEN, B.W. & LE MAITRE, D.C. 2013. Rates of spread in invasive alien plants in South Africa. Council for Scientific and Industrial Research, Stellenbosch. [ Links ]
VAN WILGEN B.W., RICHARDSON D.M. 2012 Three centuries of managing introduced conifers in South Africa: benefits, impacts, changing perceptions and conflict resolution. Journal of Environment Management, 106:56-68. [ Links ]
VENTANA SYSTEM. 2003. Vensim® standard professional DSS tutorial Harvard, USA, 60 Jacob Gates Road. [ Links ]
VERSFELD, D.B., LE MAITRE, D.C. & CHAPMAN, R.A. 1998. Alien invading plants and water resources in South Africa: A preliminary assessment. Report No. Tt 99/98. Pretoria: Water Research Commission. [ Links ]
WISE, R.M., VAN WILGEN, B.W. & LE MAITRE, D.C. 2012. Costs, benefits and management options for an invasive alien tree species: The case of mesquite in the Northern Cape, South Africa. Journal of Arid Environments, 84:80-90. [ Links ]
Accepted: October 2016
* Corresponding author: thuli.vundla@gmail.com

Appendix B: System dynamics validity tests

