


Serviços Personalizados
Artigo
 Inglês (pdf)
 Artigo em XML
 Referências do artigo
Indicadores

Links relacionados
-
 Citado por Google
 -
 Similares em Google
Compartilhar

 Permalink
South African Journal of Economic and Management Sciences
versão On-line ISSN 2222-3436
versão impressa ISSN 1015-8812
S. Afr. j. econ. manag. sci. vol.19 no.5 Pretoria 2016
http://dx.doi.org/10.17159/2222-3436/2016/v19n5a7
ARTICLES
A cost-benefit analysis of using Rooikrans as biomass feedstock for electricity generation: a case study of the De Hoop nature reserve, South Africa
Shepherd MudavanhuI, II, *; James BlignautIII, IV; Nonophile NkambuleI, V; Tshepo MorokongI; Thulile VundlaI
IASSET Research, Pretoria
IIDepartment of Agricultural Economics, University of Stellenbosch
IIIDepartment of Economics, University of Pretoria
IVSouth African Environmental Observation Network, Pretoria
VDepartment of Agricultural Economics and Management, University of Swaziland, Swaziland
ABSTRACT
Invasive alien plants (lAPs) like Rooikrans (Acacia Cyclops) have several undesirable effects on both the natural environment and the social, economic and cultural wellness of society in the De Hoop nature reserve of the Western Cape Province. A few of these negative effects are: the change in coastal sediment dynamics, the change in seed dispersal dynamics, and the fact that it is overtaking native plants. However, Rooikrans can also potentially be used as biomass feedstock for electricity generation. Following a system dynamics modelling approach, the feasibility of using woody biomass from Rooikrans was investigated. The RE-model used data obtained from the Department of Environmental Affairs' (DEA) Natural Resource Management (NRM) division, consulted with experts and conducted literature reviews with respect to the subject matter. Three scenarios were tested and the RE-model results showed that all scenarios have a positive cumulative Net Present Values (NPVs), with the exception of the baseline case scenario. This study shows that the production of electricity using Rooikrans woody biomass is a viable and feasible option in comparison with electricity production by diesel generators.
Key words: invasive alien plants, Rooikrans (Acacia Cyclops), cost-benefit analysis, system dynamics modelling, RE-model, woody biomass, electricity, diesel generators, System Johansen Gasifier
JEL: Q24, 25, 42
1 Introduction
1.1 Background to the study
The De Hoop nature reserve is currently being invaded by invasive alien plants (IAPs), which are known to pose a threat to natural capital stocks. Natural capital plays a major role in the livelihoods and the economic wellbeing of society as a whole (Blignaut & Moolman, 2006; Meyer, Breitenbach. Fényes & Jooste, 2007; Rosegrant, Ringler, Benson, Diao, Resnick, Thurlow, Torero & Orden, 2006). The other forms of capital (i.e. manufactured, financial, human and social) are also dependent on natural capital and, hence, are interlinked. Additionally, the constitution of the Republic of South Africa, 1996 (Act 108 of 1996) [Section 24] states the following:
"Everyone has the right: (a) to an environment that is not harmful to their health or well-being; and (b) to have the environment protected, for the benefit of present and future generations, through reasonable legislative and other measures that- (i) prevent pollution and ecological degradation; (ii) promote conservation; and (iii) secure ecologically sustainable development and use of natural resources while promoting justifiable economic and social development" (RSA, 1996).
If left uncontrolled, Rooikrans (as well as other IAPs) would alter the biodiversity of natural ecosystems owing to the various disruptions that it causes in the De Hoop nature reserve and wherever else it occurs. Rooikrans affects the fynbos, forest and savanna biomes of South Africa (Van Wilgen, Richardson, Le Maitre, Marais & Magadlela, 2001). The undesirable impacts caused by Rooikrans vary, and include the following:
• changes in coastal sediment dynamics (Avis, 1989);
• uses a lot of water (De Beer, 1986; Van Wilgen et al., 2001);
• changes in seed dispersal dynamics (Fraser, 1990; Knight & MacDonald, 1991);
• outcompetes native plants (Higgins, Richardson, Cowling & Trinder-Smith, 1999; Cronk & Fuller, 1995; De Beer, 1986; Working for Water, 2003); and
• increases in litter fall (Milton, 1981; Weber, 2003).
These negative effects put pressure on the economic, social and cultural wellbeing of the De Hoop nature reserve. However, information relating to the detailed economic costs and benefits of clearing Rooikrans is poorly understood. Despite its negative effects, Rooikrans does have certain benefits, such as:
• erosion control and dune stabilisation (National Academy of Sciences, 1980);
• it provides a nesting habitat for rare African penguins (Crawford, n.d. cited in Van Wilgen et al., 2001);
• its use as an ornamental plant (Siverio & Montesdeoca, 1990);
• it causes an increase in biomass (Milton, 1981);
• used to make firewood and charcoal (NAS, 1980; Duke, 1983; Yantasath, Anusontpornperm, Utistham, Soontornrangson & Watanatham, 1993; Azorin, 1995);
• use as fodder for livestock (NAS, 1980);
• a source of medicinal and pharmaceutical properties and tannins (Duke, 1983); and
• potentially used as a feedstock for electricity generation (Mugido et al., 2013).
Currently in the De Hoop nature reserve and its surrounding areas, Rooikrans is being controlled by means of a combination of mechanical and chemical control methods (Impson, 2005; Hall & Boucher, 1977; Dennill, Donnelly, Stewart & Impson, 1999; Pitseng, 2015, pers comm; Van Staden, 2015, pers comm). This is done by cutting the tree trunks at the basal level close to the ground (Weber, 2003) and then applying an effective herbicide to the cut stem to prevent coppice from sprouting (i.e. new shoots) (Impson, 2005; Pitseng, 2015, pers comm; Van Staden, 2015, pers comm). Controlled burning is also used to complement management options in order to reduce the soil seed bank of Rooikrans and to kill the felled stems. Working for Water (2003) states that young Rooikrans plants can be pulled up by hand and medium-sized plants can actually be ring barked to control their spread. The biological control of Rooikrans using seed feeding weevils (Melantarius species) is also being investigated (Dennill, Donnelly, Stewart & Impson, 1999; Impson, 2005; Working for Water, 2003). Both the adults and larvae of the weevils have been shown to destroy as much as 95 per cent of the Rooikrans seeds at the experimentation sites in the fynbos biome of the Western Cape Province (Impson, Moran, Hoffmann, Donnelly & Stewart, 2000).
1.2 Objective of the study
Many studies have demonstrated empirically that IAPs can be managed and that their effects may be circumvented through prevention, eradication via clearing operations, or reduced through integrated control mechanisms (i.e. mechanical, biological and chemical ways), while also attempting to make a cost-benefit analysis (Van Wilgen, Cowling & Burgers,1996; Van Wilgen, Little, Chapman, Gorgens, Willems & Marais, 1997; Higgins, Azorin, Cowling & Morris, 1997; Heydrenrych, 1999; Hosking & Du Preez, 1999; Turpie & Heydenrych, 2000; Le Maitre, Van Wilgen, Gelderblom, Bailey, Chapman & Nel, 2002; Van Wilgen, Van Der Heyden, Zimmerman, Magadlela, & Willems, 2000, Van Wilgen et al., 2004; De Wit, Crookes & Van Wilgen, 2001, McConachie, De Wit, Hill & Byrne, 2003; De Lange & Van Wilgen, 2010; Mugido et al., 2013). However, this study is the first system dynamics attempt to investigate the use of Rooikrans as biomass feedstock for electricity generation. The De Hoop area has encountered electricity supply problems due to ESKOM's load-shedding schedules. Using Rooikrans biomass as a feedstock for electricity generation and power generation via diesel generators could potentially serve as alternative options to augment ESKOM's power supply grid in order to sustain electricity provisioning on the grid. The purpose of this study is therefore to assess the economic feasibility of using woody biomass from Rooikrans for electricity generation by means of biomass gasification technology using the System Johansen gasifier. This would be rather than creating electricity generation by using diesel generators. It is important to note that this study does not seek to replace grid-based electricity but rather shows the potential economic feasibility of alternative ways in which grid-based electricity could be augmented. Thus, for the purpose of this study, the generation of electricity via biomass gasification using Rooikrans biomass and electricity generation using diesel generators were identified as the some of the possible ways in which electrical energy could be generated. As a result it is imperative to compare these two alternative options of electricity generations in order to identify the best and most economically feasible option of the two.
2 Study site
2.1 Site description
This study was conducted at the quaternary catchment (G50J&K) of the De Hoop nature reserve, Western Cape, South Africa (see Figure 1). The De Hoop nature reserve is a coastal reserve situated in the Overberg region approximately 50 km from Cape Agulhas, the southern tip of Africa. The climate for the De Hoop nature reserve is Mediterranean, characterised by winter rainfall with a mean annual rainfall of 500-2000 mm (South African Weather Services, 2015). The vegetation types resemble those found in the fynbos biome (Mucina & Rutherford, 2006). In terms of its geological characteristics, the coastline is generally concave and the coastal plains are upward sloping, developing into the limestone hills on the western side, with the Potberg Mountain range on the north-east side. De Hoop is characterised mainly by coastal limestone and sand, sandstone and quartzites of the Table Mountain Group, with the rolling plains of Bokkeveld shales lying further inland in the nature reserve. The diversity of plant species in the nature reserve is ascribed to the heterogeneous geological patterns. The municipal areas covering the De Hoop area have a population size of 9 225 people, with a population density of nine people per km2, an average population growth rate of 1.96 per cent and a total workforce of 6 213 people (StatsSA, 2011). The settlement type is two-pronged, with 18.40 per cent farm settlements and 81.60 per cent urban settlements. In terms of human capital development, 3.60 per cent of the population has had no schooling, 95 per cent have had some primary school education or have completed their primary education, and 1.40 per cent have reached a higher education level (StatsSA, 2011). According to Kotzé, Beukes, Van Den Berg and Newby, (2010), the major of IAPS in the studied De Hoop nature reserve catchments are Rooikrans (Acacia cyclops), Pinus species, Acacia Saligna and Eucalyptus species, with Rooikrans being the major IAP under control in the De Hoop nature reserve.
2.2 Ecology and biology of the Rooikrans invasive tree
Rooikrans is thought to have been introduced into South Africa in the 1830s (Cronk & Fuller, 1995; Henderson, 2001; ILDIS, 2002). It is native to the Oceania sub-continent, mainly in South and Western Australia (Jaensch, Vervest, & Hewish, 1988; ILDIS, 2002) and is also reported to be invasive in the USA. It is an alien invader in three European countries (i.e. Cyprus, Malta and Portugal) (ILDIS, 2002), two Asian countries (Pakistan and Thailand) and various African countries. Rooikrans is thought to have been introduced into Baron von Ludwig's private garden and the Cape Flats in the 1830s as an ornamental plant (Cronk & Fuller, 1995). According to Weber (2003), in its native country it grows in open scrub and seldom forms any dense canopy stands. However, Rooikrans has become a successful coloniser in South Africa, affecting three biomes (i.e. Fynbos, Forest and Savanna) (Van Wilgen et al., 2001), and is classified as a weed (Moll & Trinder-Smith, 1992; Henderson, 1998; Higgins et al., 1999).
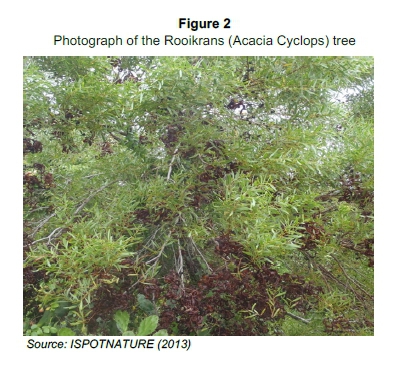
Rooikrans is a dense, bushy shrub that does not shed leaves and is predominantly multi-stemmed (see Figure 2). It has the potential to grow into a small tree, reaching an average height of 3-8m, complemented by a stem-width of 20 cm in diameter and a rounded crown (NAS, 1980; Little, 1983; De Beer, 1986). Rooikrans reproduces from seed (NAS, 1980) and does not usually produce shoots or coppice after the stem has been cut. The germination of the Rooikrans seed is enhanced by fire outbreaks. This IAP grows well in arid and semi-arid, subtropical areas with an average mean annual temperature of 14-19°C and an annual rainfall of 200-1 400 mm; it is also highly resilient in long, dry seasons and drought conditions. Rooikrans is slightly resistant to frost (Little, 1983; NAS, 1980; Yantasath et al., 1993) and is highly sensitive to waterlogging. In its native environment, Rooikrans thrives on calcareous sand or limestone and grows well in coarse-textured, sandy soil. Furthermore, it is able to sustain populations on both drier land like sand dune peaks (NAS, 1980) and soils characterised by extreme ph, as well as those with poor drainage, as long as they are not waterlogged. The geological characteristics of the De Hoop nature reserve are consistent with the soil characteristics that favour the growth of Rooikrans, and for this reason it is a major IAP in the catchment sites considered in this study.
2.3 Rationale for clearing IAPs in the De Hoop nature reserve
IAPs are a major disturbing factor affecting the De Hoop nature reserve, with Rooikrans being the main species. Controlling these plants is expensive, requiring funding from both the government and the private sector. Transforming the biomass of IAPs into value-added products (VAPs) could potentially help co-finance the clearing operations in De Hoop, as the revenue generated is reinvested into IAP clearing operations.
This study evaluates the economic costs and benefits of using Rooikrans woody biomass from the De Hoop nature reserve for electricity generation by means of biomass gasification technology, using the System Johansen gasifier (compared with electricity generation by diesel generators). Further, it explores the potential economic feasibility of this process and its implications for policy by providing a framework which policy-makers could use to promulgate and craft effective and feasible policies. These could help both private and public stakeholders meet the statute contained in the Constitution of the Republic of South Africa as well as to mitigate the negative effects posed by Rooikrans (and other IAPs). This study also seeks to show empirically that the costs of using woody biomass from Rooikrans for electricity generation (via the System Johansen Gasifier) is price-competitive when in comparison with electricity generation using diesel generators.
3 Materials and methods 3.1 Data
Data was obtained from the Department of Environmental Affairs' Natural Resource Management (DEA:NRM) database (2015), Cape Nature, personal site visits, focus group discussions, formal and informal telephonic interviews, consultation with experts, Statistics South Africa, the catchment management plan for the De Hoop nature reserve, and extensive literature reviews (both local and international). GIS shape files from the Department of Water and Sanitation (2015) were also used. These were processed using QGIS software to demarcate the quaternary catchment areas and the land-use cover of the respective areas under study.
3.1.1 Clearing costs of major IAPs
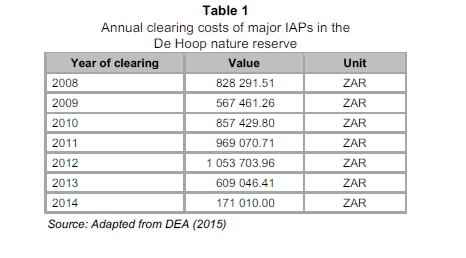
The annual clearing costs of major IAPs, which consist of the initial and follow-up clearing costs, incurred by the DEA's Working for Water programme were extracted from the 2015 DEA:NRM database and are shown in Table 1. In the base year (2008), the clearing costs amounted to approximately ZAR828 291 and decreased by approximately 31.49 per cent in 2009. From 2010 to 2013, the clearing costs increased gradually from approximately ZAR857 430 to ZAR1 053 704, with a much lower figure (approximately ZAR609 046) incurred in 2014.
3.1.2 Biomass from major IAPs in the De Hoop nature reserve
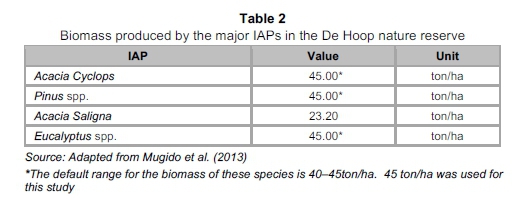
The potential biomass that can be produced per hectare of the condensed invaded areas in the De Hoop catchment areas under study is shown in Table 2. The baseline values for the RE-model are adapted from a report compiled for the biomass electricity production in the Nelson Mandela Metropolitan Bay (Mugido et al., 2013). The biomass data is essential to this study, as it would enable the calculation for the amount of electricity that could be produced from Rooikrans woody biomass using the System Johansen gasifier. This would help determine how much electricity could actually be produced over the period 2016-2030. For the purposes of this study, only Rooikrans is of interest for electricity generation, so the biomass from other IAPs shown in Table 2 is not considered in either the cost-benefit analysis or the power generation model. Further, Rooikrans was chosen as the IAP species of interest because it is the most dominant IAP in the De Hoop area. Moreover, most of the clearing efforts currently being undertaken in De Hoop are for the most part dedicated to Rooikrans. Additionally, amongst all the IAP species invading the De Hoop area, Rooikrans is the most suitable alien plant species when it comes to bio-energy. Other uses of IAPs include the production of timber, for example, for which pines and eucalyptus are more suitable. Bio-energy is at the bottom of the IAP value hierarchy, so it would not be economically feasible to use high-value species for low-value uses. Since the debate on how much of the higher-value IAP species should be used for higher-value uses has not been resolved, it would not be advisable to allocate high-value IAP species biomass to bio-energy when it could potentially be used to make other high-value VAPs. This would in turn inflate the electricity generation potential unrealistically. Accordingly, Rooikrans was selected for this study.
3.1.3 Rooikrans biomass power generation costs
The costs incurred in the production of electricity from the Rooikrans woody biomass consist of the capital cost of the System Johansen gasifier units installed and the respective variable costs associated with the bio-electricity plant. There are four units (with a capacity of 0.8 MW) in the RE-model, each at a cost of ZAR33 765 700, thus the total capital cost of ZAR135 062 800 (Stafford, Blignaut, Forsyth & Le Maitre, 2016). These units are equivalent to six diesel generators. The variable costs incurred by each System Johansen gasifier unit per year amounts to ZAR5 866 330, thus the gross total of ZAR23 465 320 (Stafford et al., 2016). The power generation costs are important to the RE-model in determining the net value of the electricity sales for the purposes of this study.
3.1.4 Carbon sequestration losses
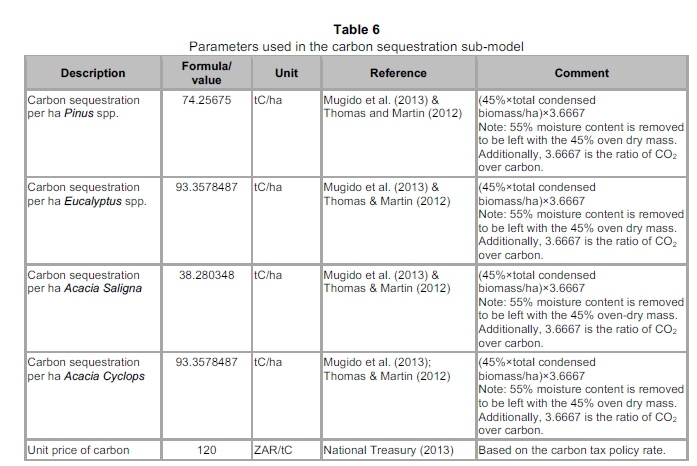
The value of carbon sequestrated by the major IAPs in the De Hoop Nature Reserve is shown in Table 3. Although major IAPs have negative effects on the De Hoop catchment areas under study, these can also be beneficial, including carbon sequestration. Plants use carbon from the atmosphere through the process of photosynthesis, thereby acting as a carbon sink. As a result of clearing the IAPs, the carbon sequestration potential by these plants is lost. The value of the carbon sequestration potential losses is ZAR8 910 per hectare for each plant species (i.e. ZAR120*74.25), with the exception of Acacia Saligna, which amounts to ZAR4 593.60 per hectare (i.e. ZAR120*38.28). The total carbon sequestration potential loss as a result of clearing the IAPs amounts to approximately ZAR31 323.60 per hectare.
3.1.5 Total power generation potential from Rooikrans biomass
The total power generation potential from Rooikrans in the RE-model is 3 045.62 kW. This is influenced by the amount of biomass converted into electricity (i.e. 14 ton/kW) and the total biomass harvested (i.e. 42 638.7 tonnes). The System Johansen gasifier units operate for 8 760 hours per year, with a capacity use of 80 per cent. This results in the total amount of electricity of 21 343 704 kWh per year. Hence, the total value of electricity produced is ZAR34 150 000, at the cost of ZAR1.60 per kWh. The net value of the electricity sales is -ZAR116,7 million in the year 2016 owing to the capital cost incurred (i.e. total value of electricity sales - the total capital costs and total variable costs). As from 2017, however, this value will become positive, with a value of ZAR11,8 million.
3.1.6 Carbon emissions avoided owing to the use of Rooikrans for electricity
The generation of electricity using diesel generators is associated with high greenhouse gas emissions. Thus, generating electricity with biomass from Rooikrans using the System Johansen gasifier units is an alternative low carbon footprint. Given the total electricity generation of 21 343 704 kWh per year from Rooikrans biomass, 12 806.2 tonnes of carbon per year could be avoided if the System Johansen gasifier units were used instead of the diesel generators.
3.2 Method
The Rooikrans electricity model (RE-model), a system dynamics model, was developed to analyse the potential of using Rooikrans woody biomass for electricity generation in the De Hoop nature reserve. IAPs (especially Rooikrans) are responsible for major disturbances affecting the De Hoop nature reserve. However, the biomass from these IAPs could potentially be used for producing renewable energy through biomass gasification technology to produce electricity with a low carbon footprint.
The System Dynamics modelling approach enables researchers to model changes in complex systems over time while capturing realistic dynamic behaviour between variables. It includes feedback loops, lag times and non-linearities (Crookes, 2012). Smith and Van Ackere (2002) point out that system dynamics modelling does not contradict the traditional economics methods of modelling dynamic phenomena. However, system dynamics modelling enables researchers to model disequilibrium circumstances while providing a realistic, real-time portrayal of the processes involved in decision-making (Sterman, 1987). System dynamics modelling is a powerful tool when the problem under analysis is too complex to understand by using our mental models. It allows for qualitative analysis of the problem under consideration, using causal loop diagrams which show the causal effect relationships between the various interlinked components of the complex system and their feedback actions. Further this technique enables one to undertake a quantitative analysis by means of a simulation run. The problem of IAPs invading the De Hoop nature reserve is caused by various factors and also has many effects on the environment and on society as a whole. A system dynamics modelling approach is therefore important in understanding the dynamics associated with invasion by IAPs into the De Hoop and its respective environmental, social and financial implications. It is important to note that, when running the simulation, it is important not to include too many variables as this would give rise to poor and often incorrect results.
Brown and Daigneault (2014) state that, although multi-decision criterion analysis has recently been advocated for studies investigating the control of IAPs, few studies have employed this methodology. The cost-benefit analysis approach is more common owing to its tractability, methodological transparency and wide adoption among governments and environmental policymakers, as noted by Pearce, Atkinson & Mourato, (2006) and Brown and Daigneault (2014).
3.3 Model boundary chart
The model boundary chart for the system dynamics model (i.e. RE-model) built for the purposes of this study is shown in Table 4 below. The endogenous variables are those that are determined endogenously in the RE-model with the use of equations. The exogenous variables refer to those data parameters considered in the model that are derived from external sources and are usually expressed as constants within the model simulation. The excluded variables are those that are considered for qualitative system dynamics modelling purposes (i.e. the causal-effect relationship usually expressed in the form of a causal loop diagram) but that have not been utilised in the model simulation for the purposes of the study. In short, the model boundary chart serves the purpose of setting out the delimitations to the study in order to portray which data parameters have been considered and what has been excluded for the purposes of the research. In this case, some variables considered within the qualitative system dynamics modelling were excluded because they were beyond the scope of the study.

3.4 Model description
The RE-model models the potential electricity generation from Rooikrans woody biomass compared with electricity produced by diesel generators. The base year for the model is 2014 and it is assumed that the biomass gasification plant will be constructed and will become fully-operational in the year 2016. The RE-model runs from 2014 to 2030. It consists of five submodels: a land-use sub-model, a clearing cost sub-model, a carbon sequestration sub-model, an economic sub-model and the power generation sub-model.
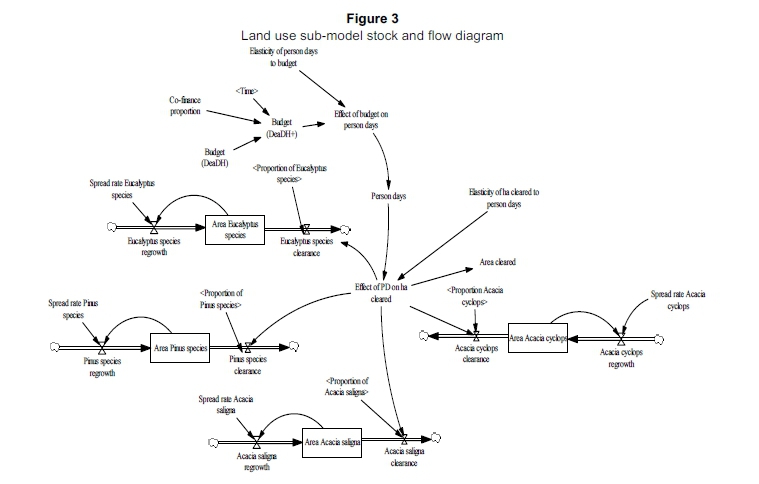
The land-use sub-model models the land-use patterns by the major IAPs in the De Hoop area.
The structure of this sub-model is shown in Figure 3.
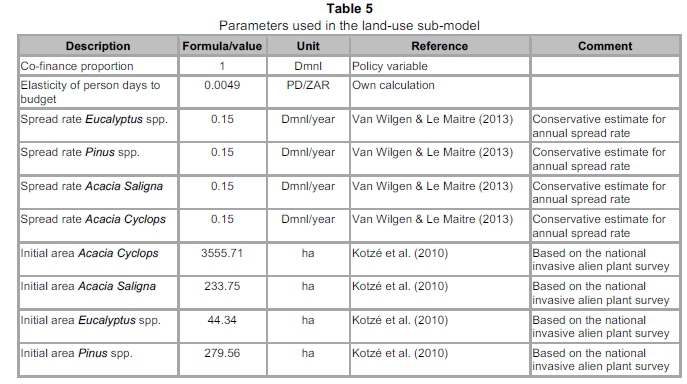
This sub-model consists of four stock variables. That is, the area invaded by Acacia Cyclops (Rooikrans), the area invaded by Acacia Saligna, the area invaded by Eucalyptus spp. and the area invaded by Pinus spp. The parameters used in this sub-model are shown in Table 5. The area invaded by Acacia Cyclops (AIAC, ha) is increased by regrowth (ACR, ha/year) which is reduced by clearing (ACC, ha/year) undertaken by WfW. This clearing (ACC, ha/year) is influenced by the effect on person days for hectares cleared (EPDHC, ha/year) minus the constant (K, ha) and then divided by the proportion of Acacia Cyclops (PAC, Dmnl). The proportion of Acacia Cyclops and the effect on person days on hectares cleared are shadow variables in this sub-model. These variables link with the Acacia Cyclops clearing variable and the land-use sub-model in a different way. The same scenario happens for all the other stock variables. This study is concerned with Rooikrans, so the biomass from Rooikrans will be used for power generation. The uses of the other stock variables are beyond the scope of this paper. Additionally, the respective complete equations used in the land-use sub-model are shown in the Appendix.
The clearing cost sub-model models the total cost of clearing the major IAPs (i.e. Acacia Cyclops, Acacia Saligna, Pinus spp. and Eucalyptus spp.) in the De Hoop nature reserve. This sub-model is illustrated in Figure 4.
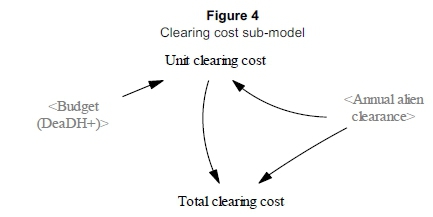
The total clearing cost is the product of the unit clearing costs and the total annual clearance of all the major IAPs in the De Hoop area. The unit clearing cost is derived by dividing the total budgeted amount (DEADH+) by the total annual IAP clearance for all the IAPs in the De Hoop nature reserve. The budgeted amount is influenced by the co-finance proportion, DEADH budget and the time factor. The annual IAP clearance and the budgeted amount (DEADH+) are shadow variables affecting the total clearing cost in a way that differs from the other variables.
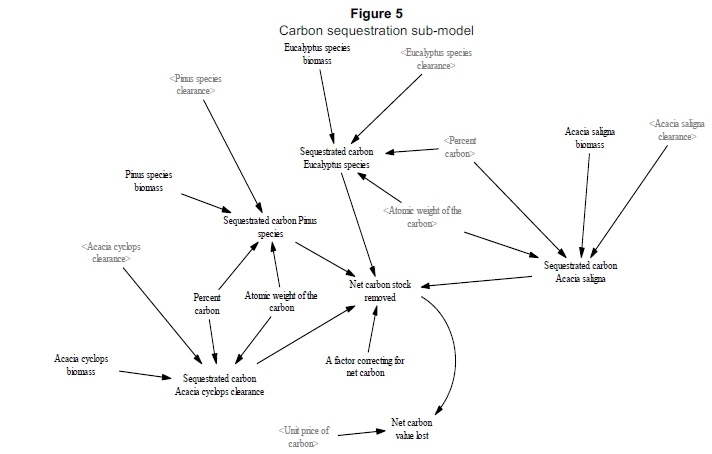
The carbon sequestration sub-model models the externality benefit of IAPs using carbon during the photosynthesis process and reducing greenhouse gases in the atmosphere. This sub-model is depicted in Figure 5.
There are five parameters used in this sub-model (see Table 6) showing the value of carbon sequestration per hectare cleared of all the major IAPs. These parameters are given in greater detail in the Appendix. Each hectare cleared (of the major IAPs) decreases the quantity of the sequestered carbon by the respective IAPs. The unit price of carbon is also one of these parameters and is an exogenous policy variable derived from the Carbon Tax policy of South Africa which is then multiplied by the net carbon loss to give a monetary value of the negative externality incurred as a result of clearing the respective IAPs in the De Hoop nature reserve.
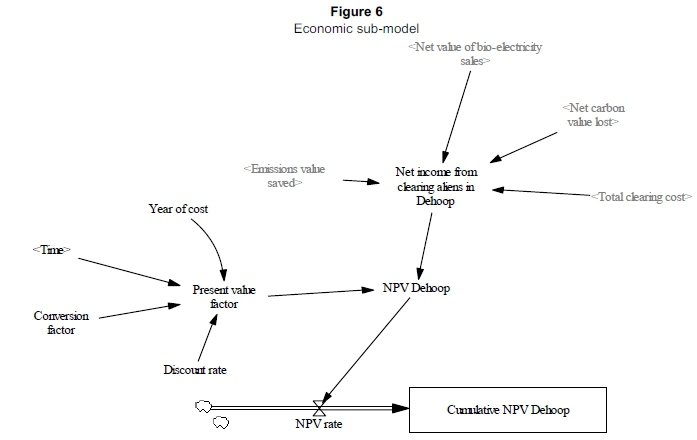
The economic sub-model is shown in Figure 6 and gives the modelled cost-benefit analysis criterion adopted in this study, which is the net present value (NPV).
There are two parameter variables in this sub-model, that is, the conversion factor and the discount rate (see Table 7). The NPV is influenced by these model parameters as well as by the time factor and the year of the cost variables. The NPV factor is derived by summing the conversion factor and the discount rate, and then to the power of the year of cost. The discount rate is a policy variable adopted from the framework used by the National Treasury. The year of cost shows the time period of the model, which runs for 22 years (2008-2030).
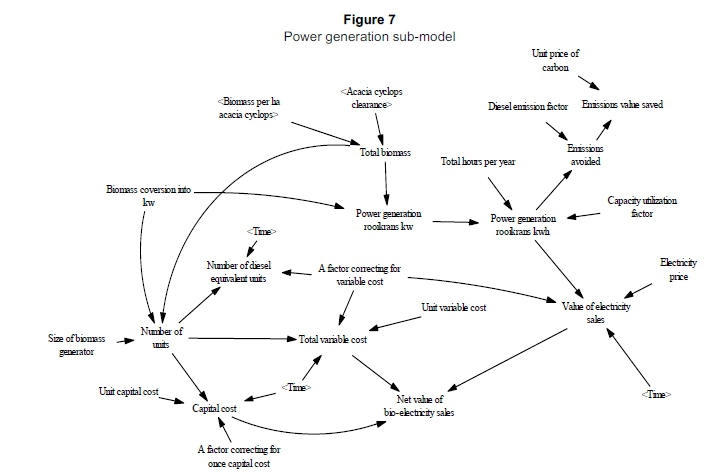
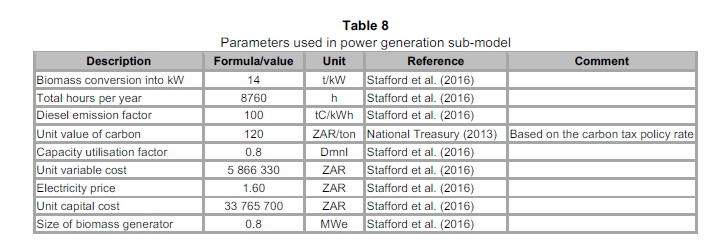
The power generation sub-model (see Figure 7) models the electricity production from Rooikrans woody biomass compared with that produced by diesel GenSets. There are nine model parameters in this sub-model (see Table 8): biomass conversion into electrical energy (kW), total hours per year, the diesel emission factor, the unit value of carbon, the capacity utilisation factor, the unit variable cost, the electricity price, the size of the biomass electricity generator (i.e. the System Johansen gasifier), and the unit capital cost.
The biomass conversion into kilowatt (kW) energy influences the number of units required to produce electricity from Rooikrans woody biomass (i.e. the number of System Johansen Gasifier units required = ((Total biomass/Biomass conversion into kW)/1000)/Size of biomass generator) and also the power generation from Rooikrans (i.e. power generation kW= (Total biomass/Biomass conversion into kW). The number of units required to produce electricity from Rooikrans biomass is influenced by total woody biomass (which is a function of Rooikrans biomass per hectare and the Rooikrans clearance) in conjunction with the biomass conversion into electricity.
In addition, the number of units required for electricity generation influences the number of equivalent diesel units, the total variable cost and the capital cost. The capital cost and the total variable cost (together with the value of electricity sales) affect the net value of electricity sales, which is derived by subtracting the total costs (i.e. capital costs and the variable costs) from the value of electricity sales. The power generation from Rooikrans biomass per hour produced by the units is then calculated by the power generation of Rooikrans, the annual time during which the electricity plant runs and the capacity utilisation factor. The power generation from Rooikrans biomass per hour together with the diesel emission factor then influences the diesel emissions avoided. This affects the emission value, which is derived from the product of diesel emissions avoided and the unit value of carbon.
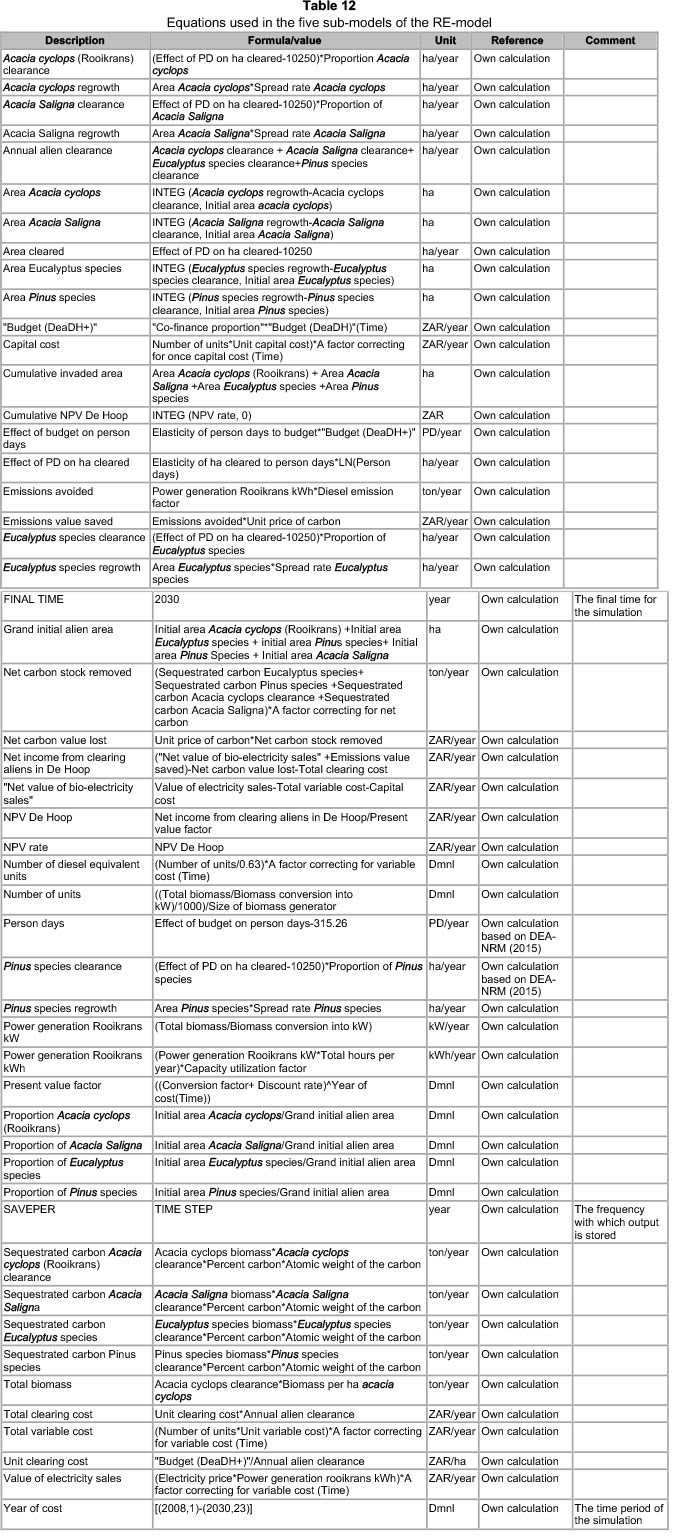
The comprehensive model equations used in the five sub-models of the RE-model are presented in Table 12 in the Appendix.
4 Results
4.1 Model scenarios and sensitivity analysis
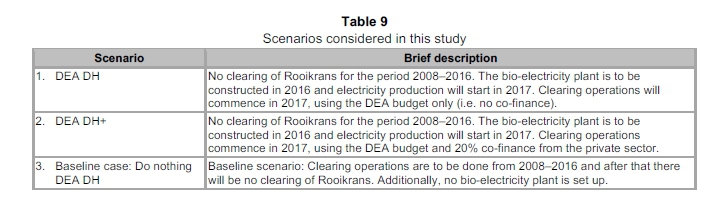
The RE-model was run for three scenarios to test for uncertainties about the anticipated outcomes of the system dynamics model and its implications for policy- and decision-makers. In the first scenario (DEA DH), the clearing operations were funded by the Department of Environmental Affairs budget alone, the second scenario (DEA DH+) involved funding for clearing operations by the DEA and a co-finance option of 20 per cent from the private sector. The third scenario was the baseline case, which is the do nothing scenario. The three scenarios considered in this study are shown in Table 9.
4.2 Clearing Rooikrans
The RE-model results show that the areas cleared per annum for the scenarios remained constant at 753.6006 hectares (Scenario 1) and 965.2275 hectares (Scenario 2). Additionally, the same annual clearing figures for the baseline scenario (Scenario 3) were observed per annum. The outcomes of clearing Rooikrans produced by the RE-model are shown in Figure 8. Basically, clearing Rooikrans is a function of person days worked by the clearing teams, which, in turn, is a function of the DEA DH and DEA DH+ budgets.
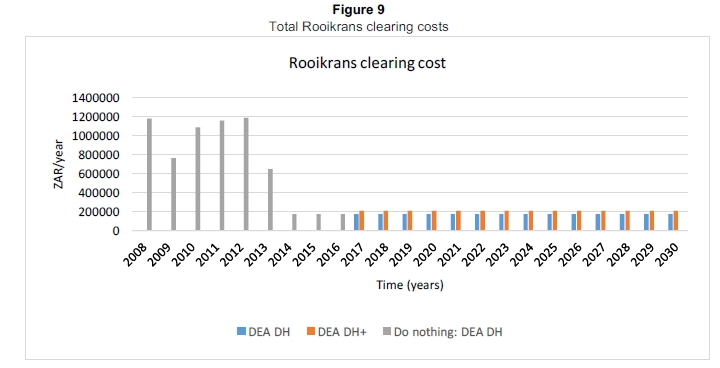
4.3 Total Rooikrans clearing cost
The clearing costs for the DEA DH and DEA DH+ scenarios (Scenarios 1 and 2) were assumed to be zero for the period 2008-2016, as the Systems Johansen Gasifier units (i.e. the bio-electricity power plant) was set up only in 2016 to be operational in 2017. The annual clearing cost values for these scenarios are the same and will be constant from 2017-2030, as illustrated in Figure 9. The clearing costs for the baseline scenario (Scenario 3) are zero for 2017-2030 because it is assumed that no bio-electricity plant will have been set up and therefore, no clearing will be done.
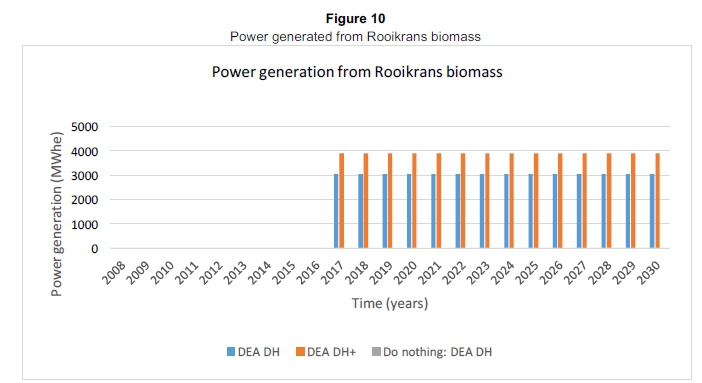
4.4 Rooikrans electricity generation
The results from the RE-model show that the electricity generated per annum remains constant from the beginning of the electricity production, using the Systems Johansen Gasifier units to the end of the model simulation (2017-2030). The total electricity generated from Rooikrans is approximately 3 045.623 MWhe per annum for the DEA DH scenario (Scenario 1). The total generation from both the DEA DH+ scenario (Scenario 2) is the same at 3 900.898 MWhe per year. As for the base case scenario (Scenario 3), no electricity will be produced because it is assumed that no bio-electricity plant will be set up. The general output for the Rooikrans electricity generation for all three scenarios is shown in Figure 10.
4.5 Emissions avoided and saved owing to Rooikrans bio-electricity production
The RE-model shows that, as a result of using Rooikrans biomass to produce electricity, greenhouse gas emissions avoided and saved unlike with the use of electricity generation by diesel generators. The bio-electricity plant emits fewer greenhouse gases in comparison with diesel generators, thus leading to a low carbon footprint. If diesel generators were used rather than the Systems Johansen Gasifier units, 12 806.24 tonnes of carbon would be emitted per annum under the DEA DH scenario (Scenario 1). Additionally, following the DEA DH+ scenario, 16 402.5 tonnes of carbon would be emitted per annum by diesel generators. However, in the base line scenario, there are no greenhouse gas emissions. The RE-model further shows that the bio-electricity generation would lead to saving greenhouse gas emissions. Under the DEA DH scenario (Scenario 1), ZAR4 763 531 worth of carbon per annum could be saved, while ZAR6 108 950 per annum could be saved in the DEA DH+ scenario (Scenario 2). In the case of the baseline scenario, there are no greenhouse gas emissions.
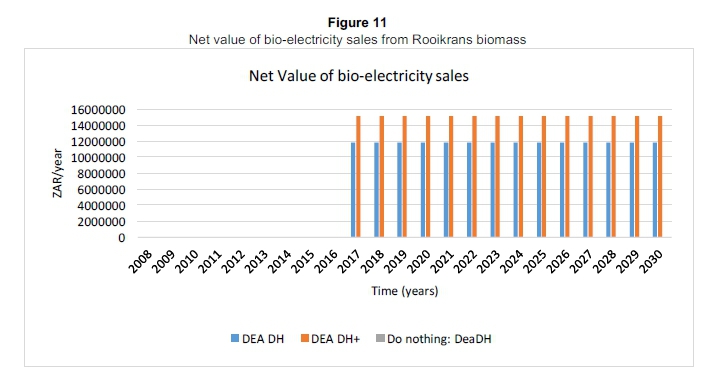
4.6 Net value of Rooikrans bio-electricity sales
The RE-model shows that the net value of electricity sales produced using the Systems Johansen Gasifier units is worth ZAR1 1,8 million per annum for the DEA DH scenario (Scenario 1) for 2017-2030. The net value of electricity sales in the DEA DH+ scenario (Scenario 2) is ZAR15, lmillion per annum for 2017-2030. The value under the base case scenario (Scenario 3) is zero for the entire simulation period owing to the absence of a bio-electricity plant. Additionally, the net value of electricity sales under all scenarios remains constant over the entire study period. The output for the net value of electricity sales is illustrated in Figure 11.
4.8 Net carbon stock removed and value lost owing to clearing Rooikrans
The clearing of Rooikrans in the De Hoop nature reserve results in the loss of standing carbon stock. Further, a carbon value is also lost as result of the loss in carbon sequestration which was performed by the Rooikrans trees before clearing. The RE-model shows that under the DEA DH scenario (Scenario 1), approximately 38 763.84 tonnes of carbon stock will be lost per annum for 2017-2030, while approximately 49 649.54 tonnes of carbon stock per annum are removed under the DEA DH+ scenario for the study period (Scenario 2). As for the base case scenarios (Scenario 3), the net carbon stock is zero as no bio-electricity plant is set up. In monetary terms, approximately ZAR4 651 661 is lost per annum as a result of clearing Rooikrans in the De Hoop nature reserve under the DEA DH scenario (Scenario 1). Under the DEA DH+ scenario (Scenario 2) approximately ZAR5,9million is lost per annum owing to clearing Rooikrans in the De Hoop nature reserve. As for the base case (Scenario 3), no carbon stock is removed and no value is lost for the study period.
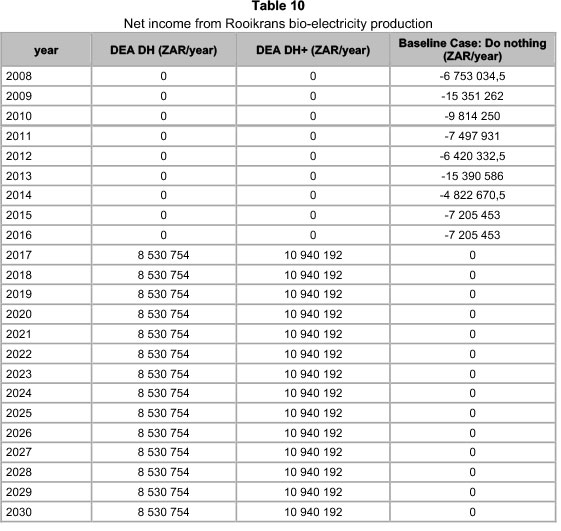
4.9 Net income from Rooikrans bio-electricity production
The RE-model shows that the net income realised from the Rooikrans bio-electricity production is approximately ZAR8,5 million per annum for DEA DH scenario (Scenario 1) for 2017-2030. Under the DEA DH+ scenario (Scenario 2), the net income is roughly ZAR10,9 million per annum within the same period. The opportunity cost of income forgone because electricity is not produced in the base case scenario varies between 2008 and 2016 (see Table 9). However, for 2017-2030, this opportunity cost becomes zero for the base case scenario, as no bio-electricity plant was set up. The output from the RE-model on net income from bio-electricity production is presented in Table 10.
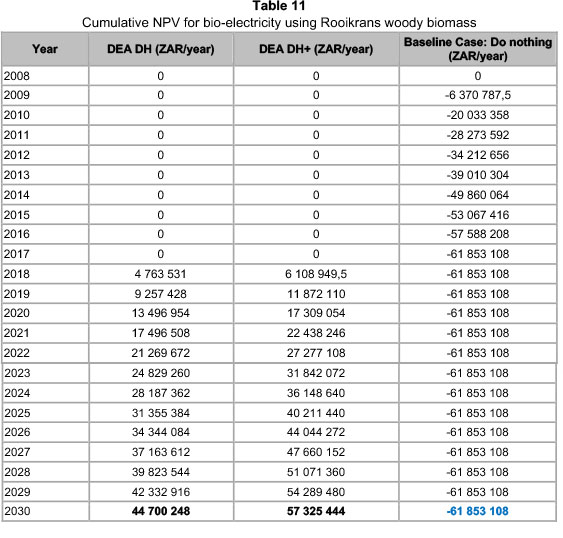
4.10 Cumulative net present value for the Rooikrans bio-electricity power plant
The RE-model results show a positive NPV value for all the scenarios except for the base case scenario, which is negative. The cumulative NPV for the DEA DH scenario (Scenario 1) is approximately ZAR44,7 million for 2017-2030 while the cumulative NPV for the DEA DH+ scenario (Scenario 2) is approximately ZAR57,3 million. For the base case scenario (Scenario 3), the cumulative NPV is approximately -ZAR61,8 million. The output of the RE-model regarding the cumulative NPV for bio-electricity production is presented in Table 11.
5 Discussion
Given the results produced by the RE-model (as presented in Section 4), the evidence suggests that the production of electricity using Rooikrans woody biomass with the Systems Johansen gasifier units is economically viable. In comparison with the electricity generated by diesel generators, the greenhouse gas emissions emanating from the System Johansen gasifier units are much lower. Approximately 12 806.24 and 16 402.5 tonnes of carbon are emitted by diesel generators per annum in the simulated Scenarios 1 and 2, respectively, and as a result of switching from diesel generators to a bio-electricity plant, approximately ZAR4,7million and ZAR6,1million of carbon dioxide emissions will be saved per annum. This money could then be used to fund programmes or projects that aim to reduce the carbon footprint of activities like electricity generation, as well as other pro-conservation initiatives.
The results produced by the RE-model regarding clearing the Rooikrans shows that the areas cleared are similar and constant over the entire simulation. This is because the spread rates did not affect the RE-model as it is concerned only with the clearing and electricity generation from the cleared Rooikrans biomass. The spread rates, however, do have an influence on the re-growth of Rooikrans, but this was beyond the scope of this study. The same can be seen in all the other results in the various scenarios (Section 4), which can be for the same reason.
Having discounted the net income flows with a discount rate of 6 per cent, the cumulative NPV for generating electricity from Rooikrans biomass using the Systems Johansen gasifier units was positive for all the scenarios, except for the base case scenario, which resulted in a negative value. The rule of thumb in a cost-benefit analysis is that projects yielding a positive NPV are preferable, and those with a negative NPV should be avoided. The DEA DH+ scenario (Scenario 2) shows the highest positive cumulative NPV of ZAR57,3 million, followed by the DEA DH scenario (Scenarios 1) with a positive cumulative NPV of ZAR44,7 million. Lastly, the base case scenario has a negative cumulative NPV of -ZAR61,8 million. Given this situation, Scenarios 1 and 2 are favourable, while Scenario 3 is the worst-case scenario. Decision-makers should pay exclusive attention to Scenarios 1 and 2, giving Scenario 2 the highest priority. The 'do nothing' scenario has a negative NPV and poses an opportunity cost to the De Hoop society, as there is no bio-electricity plant. Decision-makers should therefore not consider this scenario at all.
6 Conclusion
The results of this study show that there is great potential for using Rooikrans biomass as feedstock for electricity generation rather than electricity generation by diesel generators. Despite IAPs like Rooikrans being a major disturbance in the De Hoop nature reserve, there are benefits that accrue as a result of transforming the IAP biomass into value-added products. This study showed empirically that, if Rooikrans biomass is used to produce electricity, various benefits will be realised by the De Hoop community, such as power generation, that is, price competitive, reduced carbon emissions, net carbon value savings, a low carbon footprint, and income generation from bio-electricity sales. Furthermore, the construction of the bio-electricity plant could potentially create more employment in the De Hoop area, as people would be needed to work in the power plant. This would, in turn, have multiple effects on the economy, leading to more electricity and less pressure on the national ESKOM grid, thereby positively affecting other electricity users owing to reduced load-shedding risks. Policy-makers should view the generation of electricity using IAP biomass (such as Rooikrans) as an option that would help solve the South African electricity crisis and reduce the carbon footprint caused by electricity generation from fossil fuels like coal and diesel. It is important to note that the cost-benefit analysis results presented in this study are not a one-size-fits-all, so other methods should be used to evaluate and test the various options faced by the decision-makers. Further study is required to investigate the feasibility of Rooikrans in comparison with other IAPs.
Acknowledgements
We are grateful to the Department of Environmental Affairs (DEA) and the Working for Water programme for funding this research and for the provision of the necessary IAP data. We would also like to thank Dr David Le Maitre and Dr William Stafford from the CSIR for the provision of other data and their insights into the process of this research; Mrs Aadiela Moerat and Mr Godigeretse Pitseng from the DEA, and Mr Ben Van Staden from the Cape Nature for their assistance with the site visits and other necessary data requirements; and also Prof Dave Richardson, Prof Brian Van Wilgen and Dr Mirijam Gartner (Centre for Invasion Biology, Stellenbosch University) for their unwavering support and assistance. Last but not least, our special thanks go to Dr Farai Tererai from DEA for his support and linking us with the various academic and scientific researchers.
References
AVIS, A.M. 1989. A review of coastal dune stabilization in the Cape province of South Africa. Landscape and Urban Planning, 18:55-68. [ Links ]
AZORIN, E. 1995. Invasive Acacias and the firewood industry. Aliens, 9-10. [ Links ]
BARLAS, Y. 1994. Model validation in system dynamics. In Wolstenholme, E. & Monaghan, C. (eds.) Proceedings of the 1994 International System Dynamics Conference. System dynamics society, Sterling, Scotland. [ Links ]
BLIGNAUT, J.N. & MOOLMAN, C. 2006. Quantifying the potential of restored natural capital to alleviate poverty and help conserve nature: A case study from South Africa. Journal for Nature Conservation, 14: 237-248. [ Links ]
BROWN, P. & DAIGNEAULT, A. 2014. Cost-benefit analysis of managing the invasive African tulip tree (spathodea campanulata) in the pacific. Environmental Science and Policy, 39:65-76. [ Links ]
CRONK, C.B. & FULLER, J.L. 1995. Plant invaders. London: Chapman & Hall. [ Links ]
CROOKES, D.J. 2012. Modelling the ecological-economic impacts of restoring natural capital, with a special focus on water and agriculture, at eight sites in South Africa. Phd thesis, University of Stellenbosch. [ Links ]
DE BEER, H. 1986. Rooikrans. Farming in South Africa. Available at: http://www.arc.agric.za/arc-ppri/leaflets%20library/rooikranseng.pdf (accessed April 2016). [ Links ]
DE LANGE, W.J. & VAN WILGEN, B.W. 2010. An economic assessment of the contribution of biological control to the management of invasive alien plants and to the protection of ecosystem services in South Africa. Biological Invasions, 12:4113-4124. [ Links ]
DE WIT, M.P., CROOKES, D.J. & VAN WILGEN, B.W. 2001. Conflicts of interest in environmental management: Estimating the costs and benefits of a tree invasion. Biological Invasions, 3:167-178. [ Links ]
DENNILL, G.B., DONNELLY, D., STEWART, K. & IMPSON, F.A.C. 1999. Insect agents used for the biological control of Australian Acacia species and Paraserianthes Lophantha (willd.) Nielsen (fabaceae) in South Africa. African entomology, 1:45-54. [ Links ]
DEPARTMENT OF WATER AND SANITATION (DWS). 2015. Quaternary drainage regions. Available at: https://www.dwaf.gov.za/iwqs/gis_data/river/rivs500k.aspx [accessed September 2015]. [ Links ]
DEPARTMENT OF ENVIRONMENTAL AFFAIRS. 2015. Natural resources management database on invasive alien plants in South Africa. [ Links ]
DUKE, J.A. 1983. Handbook of energy crops. Unpublished. Purdue University, West Lafayette, Indiana: Centre for new crops and plant products. [ Links ]
FRASER, M.W. 1990. Foods of Redwinged starlings and the potential for avian dispersal of Acacia Cyclops at the Cape of Good Hope Nature Reserve. South African Journal of Ecology, 1:73-76. [ Links ]
FORRESTER, J.W. 1961. Industrial dynamics. Cambridge, Massachusetts: MIT Press. [ Links ]
FORRESTER, J.W. & SENGE, P.M. 1980. Tests for building confidence in system dynamics models. Time Studies in Management Science, 14:209-228. [ Links ]
HALL, A.V. & BOUCHER, C. 1977. The threat posed by alien weeds to the Cape flora. In Proceedings of the second national weeds conference of South Africa. Cape Town: Balkema. [ Links ]
HENDERSON, L. 2001. Alien weeds and invasive plants. Plant protection research institute handbook no. 12. Cape Town: Paarl Printers. [ Links ]
HENDERSON, L. 1998. Invasive alien woody plants of the southern and southwestern Cape region, South Africa. Bothalia, 28(1):91-112. [ Links ]
HEYDENRYCH, B. 1999. An investigation of land-use practices on the Agulhas plain (South Africa), with emphasis on socio-economic and conservation issues. MSc dissertation, University of Cape Town, Cape Town. [ Links ]
HIGGINS, S.I., AZORIN, E.J., COWLING, R.M. & MORRIS, M.J. 1997. A dynamic ecological-economic model as a tool for conflict resolution in an invasive alien, biological control and native-plant scenario. Ecological Economics, 22:141-154. [ Links ]
HIGGINS, S.I., RICHARDSON, D.M., COWLING, R.M. & TRINDER-SMITH, T.H. 1999. Predicting the landscape-scale distribution of alien plants and their threat to plant diversity. Conservation Biology, 13(2):303-313. [ Links ]
HOSKING, S.G. & DU PREEZ, M. 1999. A cost-benefit analysis of removing alien trees in the Tsitsikamma mountain catchment. South African Journal of Science, 95:442-448. [ Links ]
ILDIS. 2002. International legume database and information service. University of Southampton. Available at: http://www.ildis.org/database [accessed September 2015]. [ Links ]
IMPSON, F.A.C., MORAN, V.C., HOFFMANN, J.H., DONNELLY, D. & STEWART, K. 2000. Recent developments in the biological control of invasive Acacias in South Africa: Melanterius Servulus (Coleoptera: Curculionidae) against Acacia Cyclops. In Spencer, N.R. (ed.) Proceedings of the X International Symposium on Biological Control of Weeds, 4-14 July 1999, Montana State University, Bozeman, Montana:729-734. [ Links ]
IMPSON, F.A.C. 2005. Biological control of Acacia Cyclops in South Africa: The role of an introduced seed- feeding weevil, Melanterius Servllills (Coleoptera: Curculionidae), together with indigenous seed-sucking bugs and birds. MSc thesis, University of Cape Town, Cape Town. [ Links ]
ISPOTNATURE. 2013. Acacia Cyclops (Rooikrans). Available at: http://www.ispotnature.org/node/505145 [accessed April 2016]. [ Links ]
JAENSCH, R.P., VERVEST, R.M. & HEWISH, M.J. 1988. Waterbids in nature reserves of South-Western Australia, 1981-1985: Reserve accounts. Royal Australian Ornithologists Union Report, 30:1-290. [ Links ]
KNIGHT, R.S. & MACDONALD, I.A.W. 1991. Acacias and Korhaans: An artificially assembled seed dispersal system. South African Journal of Botany, 57:220-225. [ Links ]
KOTZÉ, I., BEUKES, H., VAN DEN BERG, E. & NEWBY, T. 2010. National invasive alien plant survey. Available at: http://bgis.sanbi.org/edrr/niaps.asp? [accessed September 2015]. [ Links ]
LE MAITRE, D.C., VAN WILGEN, B.W., GELDERBLOM, C.M., BAILEY, C., CHAPMAN, R.A. & NEL, J.A. 2002. Invasive alien trees and water resources in South Africa: Case studies of the costs and benefits of management. Forest Ecology and Management, 160:143-159. [ Links ]
LITTLE, E.L. Jr. 1983. Common fuelwood crop: A handbook for their identification. Morgantown, WV: Commune-Tech Associates. [ Links ]
McCONNACHIE, A.J., DE WIT, M.P., HILL, M.P. & BYRNE, M.J. 2003. Economic evaluation of the successful biological control of Azolla Filiculoides in South Africa. Biological Control, 28:25-32. [ Links ]
MEYER, N.G., BREITENBACH, M.C., FÉNYES, T.I. & JOOSTE, A. 2007. The economic rationale for agricultural regeneration and rural infrastructure investment in South Africa. Journal of Development Perspectives, 3(1):73-104. [ Links ]
MILTON, S.J. 1981. Litterfall of the exotic Acacias in the southeastern Cape. Journal of South African Botany, 47(2):147-155. [ Links ]
MOLL, E.J. & TRINDER-SMITH, T. 1992. Invasion and control of alien woody plants on the Cape Peninsula mountains: South Africa 30 years on. Biological Conservation, 60(2):135-143. [ Links ]
MUCINA, L. & RUTHERFORD, M.C. 2006. The vegetation of South Africa, Lesotho and Swaziland. Strelitzia, 19. [ Links ]
MUGIDO, W., BLIGNAUT, J.N., JOUBERT, M., DE WET, J., KNIPE, A., JOUBERT, S., COBBING, B., JANSEN, J., LE MAITRE, D. & VAN DER VYFER, M. 2013. Determining the quantity and the true cost of harvesting and delivering invasive alien plant species for energy purposes in the Nelson Mandela Metropolitan Area. Unpublished report commissioned by IDC/EC Biomass. Pretoria: Beatus. [ Links ]
NATIONAL ACADEMY OF SCIENCES. 1980. Firewood crops: Shrub and tree species for energy production. Washington DC: National Academy of Sciences. [ Links ]
PEARCE, D.W., ATKINSON, G. & MOURATO, S. 2006. In cost-benefit analysis and the environment: Recent developments. Paris: Organization for Economic Cooperation and Development. [ Links ]
PITSENG, G. 2015. Personal communication. November, Cape Town. [ Links ]
NATIONAL TREASURY. 2013. Carbon tax policy paper: Reducing greenhouse gas emissions and facilitating the transition to a green economy. Pretoria: Government Printer. [ Links ]
REPUBLIC OF SOUTH AFRICA (RSA). 1996. Constitution of the Republic of South Africa, Act 108 of 1996. Pretoria: Government Printer. [ Links ]
ROSEGRANT, M.W., RINGLER, C., BENSON, T., DIAO, X., RESNICK, D., THURLOW, J., TORERO, M. & ORDEN, D. 2006. Agriculture and achieving the millennium development goals. Washington: Agriculture and Rural Development Department, World Bank. [ Links ]
SIVERIO, A. & MONTESDEOCA, M. 1990. Presence in Tenerife of a new pest, Psylla Uncatoides Ferris Et Kyver, on Acacia Cyclops link. 'Acacia Majorera' and other ornamentals. Boletin de sanidad vegetal, 16(1):19-23. [ Links ]
SMITH, P.C. & VAN ACKERE, A. 2002. A note on the integration of system dynamics and economic models. Journal of Economic Dynamics & Control, 26:1-10. [ Links ]
SOUTH AFRICAN WEATHER SERVICES. 2015. Historical rain maps. Available at: http://www.weathersa.co.za/climate/historical-rain-maps [accessed September 2015]. [ Links ]
STATISTICS SOUTH AFRICA. 2011. Census 2011. Pretoria StatsSA. Available at: http://www.statssa.gov.za [accessed September 2015]. [ Links ]
STAFFORD, W., BLIGNAUT, J.N., FORSYTH, G. & LE MAITRE, D. 2016. Value added industries on the Agulhas plains: Techno-economic feasibility study for the production of wood-fuels, heat, electricity and biochar from invasive alien plant biomass. Unpublished report. Pretoria: CSIR. [ Links ]
STERMAN, J.D. 1987. Testing behavioral simulation models by direct experiment. Management Science, 33(12):1572-1592. [ Links ]
STERMAN, J.D. 2000. Business dynamics: Systems thinking and modelling for a complex world. New York: McGraw-Hill/Irwin. [ Links ]
THOMAS, S.C. & MARTIN, A.R. 2012. Carbon content of tree tissues: A synthesis. Forests, 3:332-352. [ Links ]
TURPIE, J. & HEYDENRYCH, B. 2000. Economic consequences of alien infestation of the Cape floral kingdom's fynbos vegetation. In Perrins, C., Williamson, M. & Dalmazzone, S. (eds.) The economics of biological invasions. Cheltenham: Edward Elgar. [ Links ]
VAN STADEN, B. 2015. Personal communication. November, Cape Town. [ Links ]
VAN WILGEN, B.W., COWLING, R.M. & BURGERS, C.J. 1996. Valuation of ecosystem services - A case study from South African fynbos ecosystems. Bioscience, 46:184-189. [ Links ]
VAN WILGEN, B.W., LITTLE, P.R., CHAPMAN, R.A., GORGENS, A.H.M., WILLEMS, T. & MARAIS, C. 1997. The sustainable development of water resources: History, financial costs, and benefits of alien plant control programmes. South African Journal of Science, 93:404-411. [ Links ]
VAN WILGEN, B.W., VAN DER HEYDEN, F., ZIMMERMANN, H.G., MAGADLELA, D. & WILLEMS, T. 2000. Big returns from small organisms: Developing a strategy for the biological control of invasive alien plants in South Africa. South African Journal of Science, 96:148-152. [ Links ]
VAN WILGEN, B.W., RICHARDSON, D.M., LE MAITRE, D.C., MARAIS, C. & MAGADLELA, D. 2001. The economic consequences of alien plant invasions: Examples of impacts and approaches for sustainable management in South Africa. Environment, Development and Sustainability, 3:145-168. [ Links ]
VAN WILGEN, B.W., DE WIT, M.P., ANDERSON, H.J., LE MAITRE, D.C., KOTZE, I.M. & NDALA, S. 2004. Costs and benefits of biological control of invasive alien plants: Case studies from South Africa. South African Journal of Science, 100:113-122. [ Links ]
VAN WILGEN, B.W. & LE MAITRE, D.C. 2013. Rates of spread in invasive alien plants in South Africa. Stellenbosch: CSIR. [ Links ]
WEBER, E. 2003. Invasive plant species of the world: A reference guide to environmental weeds. Wallingford: CAB International. [ Links ]
WORKING FOR WATER. 2003. Working for water programme. Pretoria: Department of Water Affairs and Forestry. Available at: http://www-dwaf.pwv.gov.za/wfw/ [accessed September 2015]. [ Links ]
YANTASATH, K., ANUSONTPORNPERM, S., UTISTHAM, T., SOONTORNRANGSON, W. & WATANATHAM, S. 1993. Acacias for fuelwood and charcoal. In Awang, K. & Taylor, D.A. (eds.) Acacias for rural, industrial and environmental development. Proceedings of the Second Meeting of Consultative Group for Research and Development of Acacias (Cogreda). Udorn Thani: Winrock International and FAO. [ Links ]
ZEBDA, A. 2002. Using cost-benefit analysis for evaluating decision models in operational research. Journal of American Academy of Business, 2(1):106-114. [ Links ]
Accepted: October 2016
* Corresponding Author: shepimudaz@gmail.com
Appendix
A1. Equations used in the RE-model
A2. RE-model validation
a) Model validation
Model validation is a continuous series of actions of checking and instituting confidence in a system dynamics model and this happens throughout the entire process of model building (Forrester & Senge, 1980). Since models are simple in nature showing presentations of real life situations, it is not possible to completely validate them (Sterman, 2000). Furthermore, no particular test can verify a model in totality, however the confidence in a model improves as the model passes a range of tests (Forrester & Senge, 1980). Forrester (1961) mentions that model validation needs to be judged with reference to a particular purpose. This is imperative for system dynamics models, since they are built to achieve a specific objective. The validation of the internal structure of the model comes first in system dynamics modelling, followed by behaviour validity, since the accuracy of model behaviour is meaningful only once adequate confidence on model structure has been established in advance (Barlas, 1994)
b) Structural validity
Structural validity establishes the validity of the internal structure of the model through comparing model structure with either knowledge of the real system or general knowledge about the system as evidenced by literature (Barlas, 1994). Four direct structure validation tests, as introduced by Forrester and Senge (1980) for system dynamics, were conducted in this paper.
(i) Structure verification test
This test seeks to build model structure that imitates the real world situation reported in literature. It checks whether the model structure does not contradict with the available data of the real system being modelled (Forrester & Senge, 1980). In this case, the structure verification was two pronged. Firstly, South Africa specific data was used to construct the causal loop diagram, inter alia available knowledge about the real system in the literature. The causal relationships of the model were set up according to available data and information of the real world system being modelled to serve as a form of empirical structure validation (Zebda, 2002). Secondly, the validity of each of the model equations against available information and data was determined through the direct comparison of the respective model equations used to imitate the real world system and with general knowledge of the system described in literature (see Table 13).
(ii) Dimensional consistency test
The dimensional consistency test seeks to establish the unit uniformity of all model equations. This means that, for each model equation, the unit of measure used for all the variables in the REModel, must be dimensionally consistent whilst excluding the scaling parameters that have no meaning in the context of the real world system (Sterman, 2000). The measurement units of input variables of all model equations used in the RE-Model, were inspected and found to be dimensionally consistent.
(iii) Parameter verification test
The parameter verification test consists of the conceptual and numerical evaluation of constant parameters of the model contrary to information pertaining the real system. The reason for conducting this type of test in system dynamics modelling is to check and ensure the consistency of the model parameters counter to the system's descriptive and numerical data (Forrester & Senge, 1980). The values allocated to the RE-model parameters were obtained from existing data of the system, coupled with available numerical data on IAPs in South Africa. The parameters used in the RE-model are shown in Section 3.1.
(iv) Extreme condition test
This test seeks to assign extreme values to selected parameters, inter alia, the plausibility of the model generated behaviour against the envisaged scenarios of what may happen in comparable conditions in real life situations. In order for the systems dynamic model to pass this test, it must explicitly show the logical behaviour under extreme conditions (Forrester & Senge, 1980). An extreme condition test called Extreme condition test 1 was conducted. In extreme condition test 1, the budget was set to zero, which in reality means no investment into clearing activities, thus the total clearing cost becomes zero, invasive alien plant clearance (e.g. Acacia cyclops (Rooikrans) clearance) becomes zero and hence power generation from Rooikrans and the NPV becomes zero. The model outcomes for this condition are presented in Figure 12 and are in agreement with this extreme condition.

