


Services on Demand
Article
 English (pdf)
 Article in xml format
 Article references
Indicators

Related links
-
 Cited by Google
 -
 Similars in Google
Share

 Permalink
South African Journal of Economic and Management Sciences
On-line version ISSN 2222-3436
Print version ISSN 1015-8812
S. Afr. j. econ. manag. sci. vol.19 n.5 Pretoria 2016
http://dx.doi.org/10.17159/2222-3436/2016/v19n5a6
ARTICLES
Clearing invasive alien plants as a cost-effective strategy for water catchment management: The case of the Olifants river catchment, South Africa
Tshepo MorokongI, *; James BlignautII, III; Nonophile Promise NkambuleI, IV; Shepherd MudhavanhuI, V; Thulile VundlaI
IASSET Research, Pretoria
IIDepartment of Economics, University of Pretoria
IIISouth African Environmental Observation Network, Pretoria
IVDepartment of Agricultural Economics and Management, University of Swaziland, Swaziland
VDepartment of Agricultural Economics, University of Stellenbosch
ABSTRACT
Invasive alien plants have a negative impact on ecosystem goods and services derived from ecosystems. Consequently, the aggressive spread of invasive alien plants (lAPs) in the river catchments of South Africa is a major threat to, inter alia, water security. The Olifants River catchment is one such a catchment that is under pressure because of the high demand for water from mainly industrial sources and unsustainable land-use, which includes IAPs. This study considered the cost-effectiveness of clearing IAPs and compared these with the cost of a recently constructed dam. The methods used for data collection were semi-structured interviews, site observation, desktop data analysis, and a literature review to assess the impact of IAPs on the catchments water supply. The outcomes of this study indicate that clearing invasive alien plants is a cost-effective intervention with a Unit Reference Value (URV) of R1.44/m3, which compares very favourably with that of the De Hoop dam, the URV for which is R2.93/m3. These results suggest that clearing invasive alien plants is a cost-effective way of catchment management, as the opportunity cost of not doing so (forfeiting water to the value of R2.93/m3) is higher than that of protecting the investment in the dam.
Key words: invasive alien plants, catchment management, cost-effectiveness, Unit Reference Value
JEL: Q570
1 Introduction
Invasive alien plants (IAPs), as biological invaders, negatively affect water sources (Ghahramanzadeh, 2013). IAPs in South Africa cover an estimated 10 million uncondensed hectares of the land surface, and continue to spread (Versfeld, Le Maitre & Chapman, 1998; Le Maitre, Versveld & Chapman 2000, Le Maitre, Gaertner, Marchante, Ens, Holmes, Pauchard, O'Farrell, Rogers, Blanchard & Blignaut, 2011). Woody IAPs negatively affect water sources, biodiversity, and land productivity (Mugido et al., 2014). These include Acacia mearnsii, Acacia saligna, Eucalyptus, Hakea and Pinus IAPs, which had a total evaporation (ET) of 895 mm in the Western Cape. Native vegetation, in contrast, had an ET of 575 mm (for thicket) and an ET of 520 mm (for fynbos), indicating that IAPs use more water than native vegetation does (Meijninger & Jarmain, 2014; Blignaut, Mander, Schulze, Horan, Dickens, Pringle, Mavundla, Mahlangu, Wilson, McKemzie & McLean, 2010). As a result, Van Wilgen, Cowling and Burgers (1996) estimate a 30 per cent loss of water supply in the City of Cape Town unless something is done to control the IAPs. This poses a serious threat not only to the sustainability of agricultural production systems, which are water intensive, but also to other industries using water as one of their key inputs.
The spread of IAPs has both environmental and economic implications (Lenda, 2014). Le Maitre et al. (2000) estimate that 3 300 million m3 of water is used by IAPs each year, with the Western Cape and the Mpumalanga provinces being the most-invaded provinces. To combat the invasions, the South African government initiated the Working for Water (WfW) programme, which is the key component in the overall programme called Natural Resource Management (DEA: NRM). This includes Working on Fire, Working for Wetlands, Working for Forests, Working for Ecosystems, Working for the Coast, Working for Water, Working for Land, Working on Waste and the Youth Environmental Services Programme (Department of Water Affairs and Forestry, 1997; www.environment.gov.za). A study by Van Wilgen, Cowling & Burgers (1996) emphasises the issue of water loss due to IAPs and the consequent impact on the economy, cities and agriculture when loss is not controlled. This influences the government's response to the negative impact of IAPs on water sources. The WfW programme, currently known as the Department of Environmental Affairs' Natural Resource Management programme (DEA: NRM), is mandated to manage or control the spread of IAPs nationally. This programme, benefits local people by generating employment clearing IAPs in invaded areas. Le Maitre et al. (2000) argue that the programmes aimed at controlling the spread of IAPs are more cost-effective than the alternative water supply schemes. Clearing IAPs following the DEA: NRM programme therefore contributes positively to water generation in South Africa. A study by Marais & Wannenburgh (2008) investigated the cost-effectiveness of natural capital in generating extra water as result of clearing IAPs from riparian areas at different water catchments in South Africa. The outcome indicated that clearing IAPs recovered significant volumes of water. Here we wish to consider these assertions in the context of the Olifants River.
2 Description of the study area
2.1 Introduction
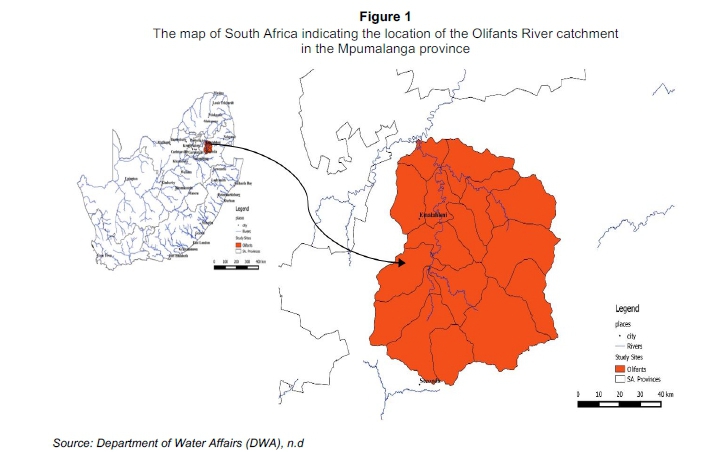
The Olifants River catchment (see Figure 1) covers an estimated area of 570 km2, and is subdivided into nine sub-catchments (http://www.ewisa.co.za). This study is limited to the sub-quaternary (Bn-i2), an area with a mean annual runoff of 2 400 million/m3. The Olifants River catchment includes hard rock formations, with Bushveld igneous complex being the most dominant (Water Institute of Southern Africa, 2013); "[t]he soils are erodible due to intensive cultivation and grazing" (www.csir.co.za). Surface water and groundwater are the main water resources, with a total mean runoff estimated at 2 400m3 per annum (www.csir.co.za). One activity making a negative impact on this catchment is coal mining, which is reported to alter the natural hydrological systems by disturbing the overlying rock and soil strata, resulting in increased filtration and release of groundwater (Water Institute of Southern Africa, 2013). The acid released into water sources owing to extensive mining activities, has contributed to the compromised quality of the water at the Olifants River catchment (Basson, Van Niekerk & Van Rooyen, 1997; Hodgson & Krantz, 1998). Moreover, the availability of groundwater is 'associated with weathered pockets in the hard rock which are underneath the area and with dolomites. Most of the groundwater is used for supplying the rural area and for stock watering.
Owing to the pressures, the Olifants River catchment is one of the most stressed catchments in South Africa, in terms of both water quantity and quality (DWA, 2011; Hodgson & Krantz, 1998). In other studies it is classified as one of the most polluted rivers in the country (Kemp, De Kock, Wepener, Roets, Quinn & Wolmarans, 2014; Rashleigh, Hardwick & Roux, 2009). The vegetation type commonly found in the Olifants River catchment is tropical bush and savanna. The annual rainfall in the south of the Mpumalanga Highveld region is 700 mm. According to Statistics South Africa (2012), an estimated total of 389 918 people reside in the Olifants River catchment. Approximately 28 per cent reside in the farm areas, 49 per cent in the urban areas and 22 per cent in the tribal/traditional areas. Activities like mining, power generation, urban development, improved service delivery to rural communities and agricultural irrigation have exerted pressure on this catchment. The De Hoop dam was built in anticipation of the growing demand for water at the Olifants River catchment (DWA, 2011), even though the development of the dam was not fully supported by the South African National Parks (SANParks), because of its potentially negative impact on SANParks' water share or ecological reserves (Wray, 2006).
2.2 Water allocations
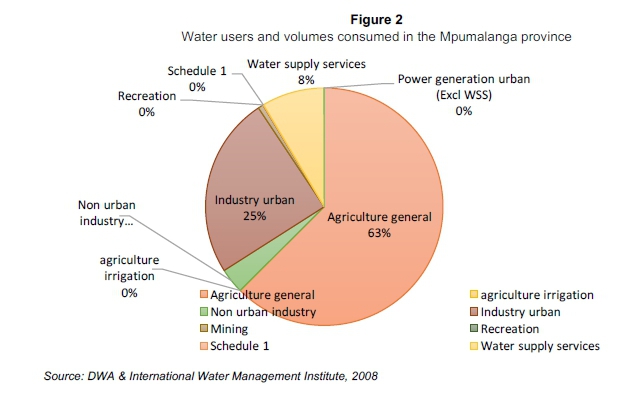
The registered water users in the Mpumalanga province indicate the two main leading water users as the agricultural sector (63 per cent) and the industry (25 per cent) (see Figure 2). Water supply services constitute only 8 per cent, non-urban industry only 3 per cent, and schedule one only 1 per cent. Other sectors, such as recreation, irrigation and power generation urban, constitute less than 1 per cent each.
3 Material and methods
3.1 The current extent of invasive alien plants
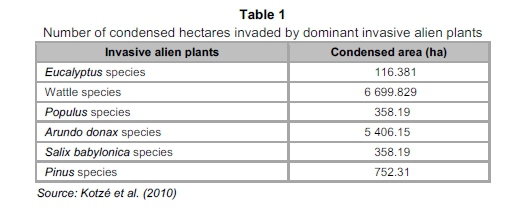
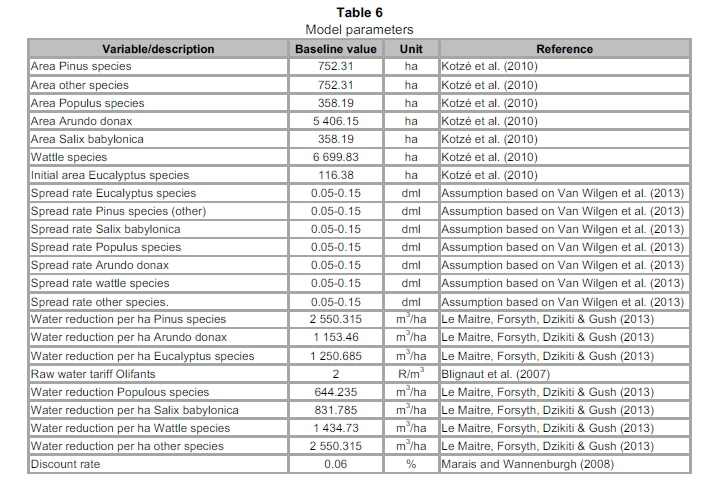
According to Kotzé, Beukes, Van den Berg & Newby (2010), the 2008-invasion status at the Olifants River catchment is as follows: the Wattle species cover 6 699.829 condensed ha, followed by Arundox donax (5 406.15 ha), Pinus (752.31 ha), Populus (358.19 ha) and Eucalyptus (116.381 ha) (see Table 1). (A condensed hectare implies a theoretical 100 per cent cover by the IAPs).
3.2 Water consumption by invasive alien plants
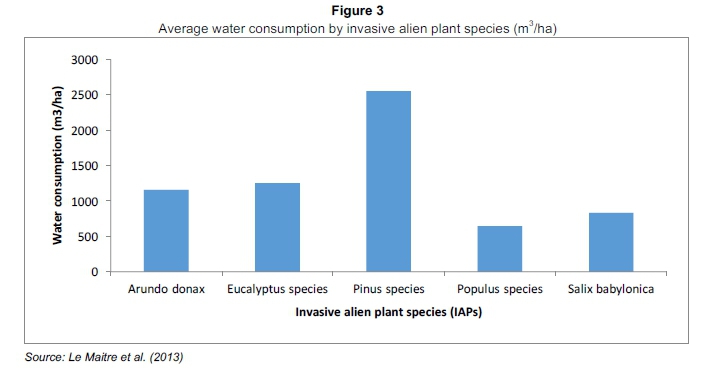
The average water consumption by IAPs at the Olifants River catchment is as follows: Pinus consumes 2 550.32 m3/ha, Eucalyptus (1 250.69 m3/ha), Arundo donax (1 153.46 m3/ha), Salix babylonica (831.79 m3/ha) and Populus (644.24 m3/ha) (Le Maitre, Forsyth, Dzikiti & Gush, 2013) (see Figure 3). These species make a negative impact on the water flow because of their high water consumption (Le Maitre, Mgidi, Schonegevel, Nel, Rouget, Richardson & Midgley, 2004).
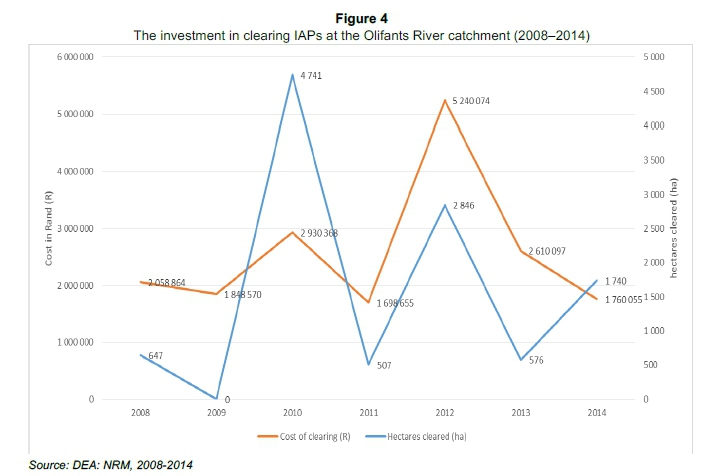
3.3 Clearing costs of IAPs (2008-2014)
The data indicating the cost and hectares cleared between 2008-2014 were extracted from the DEA: NRM's WIMS data management system. As Figure 4 indicates, the investment in clearing IAPs has been fluctuating, affecting the hectares cleared.
3.4 Method
A system dynamics modelling approach was adopted in this study in order to investigate how well water catchment management by means of clearing IAPS compares in securing water in comparison with the development of a new dam in the Olifants River catchment. The Vensim software® (Ventana Systems, 2003) was used to conceptualise, construct, simulate and analyse the biophysical and financial accounting models using causal loops, stocks-and-flow diagrams, and simulation models. These models were designed to run for a period of 22 years, from 2008 until 2030. Three sub-models were developed, a land-use model, a water-saved model, and an economic model, including the estimation of the Unit Reference Value (URV). These will be discussed in more detail below.
3.5 Model description
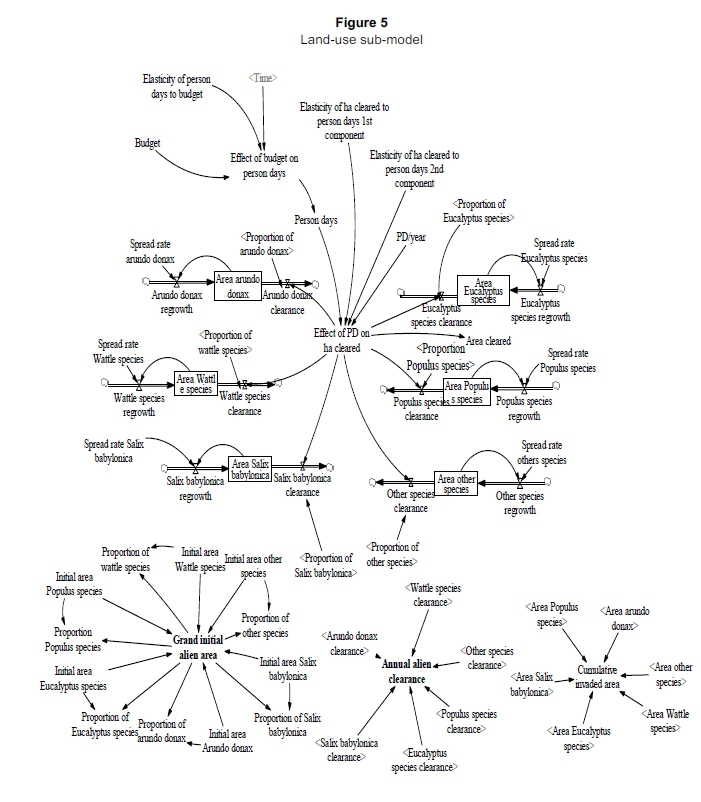
3.5.1 Land-use sub-model
The land-use sub-model models the extent of both the alien invasion and the clearance at the study site. The structure of the land-use sub-model is shown in Figure 5. This sub-model consists of six stock variables, that is, Wattle species, Arundox donax species, Pinus species, Populus species, Eucalyptus and other species. The 'other species' stock represents less dominant IAPs found at the study site. Each stock in this sub-model depicts the extent of invasion, which is increased by regrowth and reduced by clearance. Regrowth is increased by both the spread rate of and the area invaded by the species. Clearance is essentially a function of person days, which, in turn, are a function of the budget. The functions were estimated by using regression models.
The parameters used in the land-use sub-model are presented in Annexure A1. Input variables taken from other sub-models are indicated.
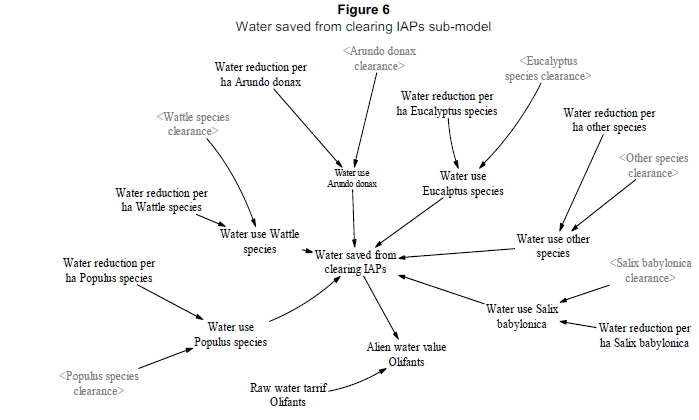
3.5.2 Water saved sub-model
The water-saved sub-model estimates the water that could be yielded by clearing IAPs (see Figure 6). The water saved from clearing IAPs is the sum of the water used by the various alien species which, in turn, is a product of the individual IAPs water reduction per hectare and the area that was cleared. The water saved, coupled with the unit value of water, yields the value of the water saved.
The parameters used in the water-saved sub-model are presented in Annexure A1. Input variables taken from other sub-models are indicated.
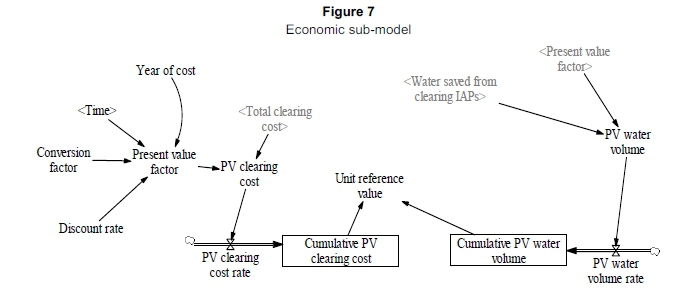
3.5.4 Economic sub-model
The Unit Reference Value (URV) is calculated to analyse the cost-effectiveness of water generation by clearing IAPs. The URV was developed by the Department of Water Affairs and Sanitation (Van Niekerk, 2012) and is the cost per cubic metre of water over the lifetime of a water infrastructure (Van Niekerk, 2013; Preston, 2015), presented as follows:
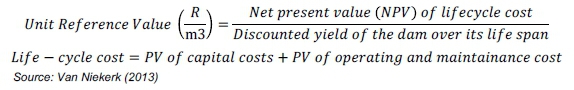
As given by Marais and Wannenburg (2008), the following aspects were taken into consideration to calculate the URV in this study:
a) The economic life-cycle of water development projects generally ranges from 30 to 50 years. The assumption of the project life-cycle is based on the construction of dams. However, for this study; the water project is alien clearing, not the construction of a dam. The project economic life-cycle is only 22 years (2008 to 2030). This means that the economic life cycle of the alien clearing project ends in year 22. After that, no costs will be incurred. Even though the project benefits (water yield) will accrue beyond that period. The URV is the summation of project-discounted costs over the summation of project-discounted benefits (water yield). Therefore, in accordance with the definition, a conservative URV is obtained in year 22. Running an alien clearing project model for 30 years when the project ends in the 22nd year, will give the impression that costs were incurred for 30 years.
b) The cost component is inclusive of capital cost (up-front costs of the initial clearing of IAP and the cost of the subsequent follow-up plus annual operations, and maintenance costs, which include labour, land, or the resource management cost).
c) Discount is at a rate of 6 per cent, an approximate average of the range of discount rates used by government.
The overall cost of clearing IAPs includes overheads and the actual clearing costs. The clearing cost for the IAPs is a product of dividing the budget by the annual alien clearance. The budget indicates funds invested by the DEA for clearing IAPs between 2008 and 2014. This data served as baseline. The product of the unit clearing cost and the annual alien clearance yields the total clearing cost. According to Marais and Wannenburg (2008), the clearing costs obtained from the WIMS database reflect only the contracting costs and not management overheads and chemicals. The following adjustment concerning clearing and maintenance costs therefore had to be conducted to take overheads into consideration:
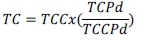
Where:
TC = Total cost of clearing of the selected IAPs from the riparian area in a given water management area.
TCC = Total direct contracting cost of clearing selected IAP from the given management area.
TCPd = Weighted average person day cost in DEA:NRM for the period 2008 to 2014 (the average over the period 2008 to 2014 of the total annual expenditure of DEA:NRM over the total number of person days of employment).
TCCPd = Average contracting cost per person day for all polygons cleared in each area and recorded in the DEA:NRM database between 2008 and 2014.
The economic sub-model estimates the net income from clearing the IAP at the study site as well as the URV (see Figure 7). For the URV, the present value (PV) of the clearing cost and the PV of the water volumes were estimated and then summed to yield the cumulative PV clearing cost and cumulative PV water volume. Dividing the cumulative PV clearing cost by the cumulative PV water volume yields the URV.
The parameters used in the economic sub-model are presented in Annexure A1. The input variables taken from other sub-models are indicated.
3.5.5 Model validation
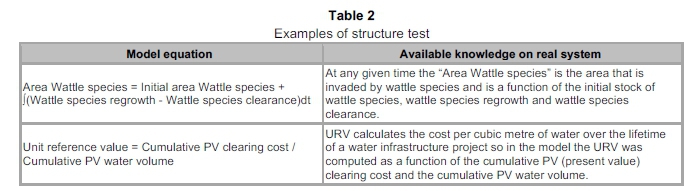
Model validation is a continuous series of actions for testing and establishing confidence in the model and is run throughout the entire process of model building (Forrester & Senge, 1980). However, as models are simple, even reductive representations of actual-world situations, they can never be fully validated (Sterman, 2000). No particular test can completely verify a model, but the confidence in a model is improved as the model passes a range of tests (Forrester & Senge, 1980). The Olifants model was tested for internal structure validity, and behaviour validity, the dimension consistency test, the parameter verification test and the extreme conditions test. Forrester (1961) further emphasises that model validation ought to be judged with reference to a particular purpose. This is important for system dynamics models, because they are built to fulfil a specific purpose. The validation of the internal structure of the model and behaviour validity is important, because the accuracy of model behaviour is meaningful only once adequate confidence in the model structure has been established beforehand (Barlas, 1994). The structure verification test assesses the model structure against the real system structure/knowledge of the structure found in literature. It assesses whether the model structure is consistent with the descriptive knowledge of the real system being modelled (Forrester & Senge, 1980). For structural verification, two approaches were used. First, in developing the causal relationships in the model, data specific to South Africa was used, supplemented by available knowledge of the real system, also in the literature. The causal relationships of the model were founded on the available knowledge of the real system and for that reason they served as a form of empirical structure validation (Zebda, 2002). Second, the validity of each of the model equations was determined by directly comparing each equation to the real system and with general knowledge of the system as described in literature. Table 2 is an example of how model equations were evaluated. In the light of these tests, the Olifants model was found to be a reasonable, simplified match of the real-world system.
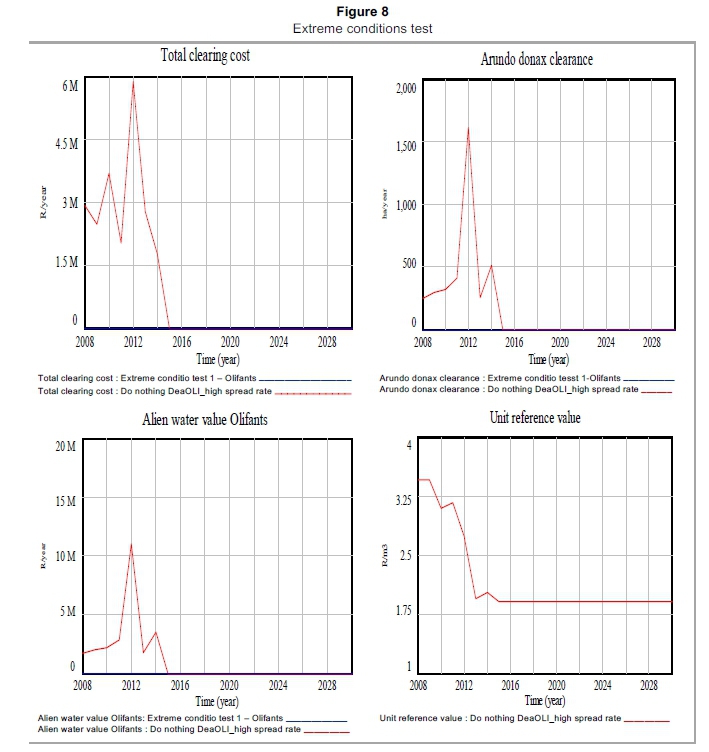
The dimensional consistency test seeks to establish the unit uniformity of all the model equations. That is, the measurement units of all the variables in each model equation must be dimensionally consistent without including scaling parameters that have no meaning in the real world (Sterman, 2000). The measurement units of input variables of all the model equations were examined and were found to be dimensionally consistent. The parameter verification test concerns the conceptual and numerical evaluation of constant parameters of the model against knowledge of the real system. It assesses the consistency of the model parameters against the system's descriptive and numerical knowledge (Forrester & Senge, 1980). The values allocated to the model parameters were obtained from the existing knowledge of the system, coupled with the available numerical data on IAP in South Africa. (As an illustration, see the comprehensive list of parameters used in the model in Annexure A1.). The extreme condition test assigns extreme values to selected parameters and evaluates the plausibility of the model-generated behaviour in comparison with the knowledge/anticipation of what may take place in comparable conditions in real life. For the model to pass this test, it must demonstrate logical behaviour under extreme conditions (Forrester & Senge, 1980). When conducting the extreme condition test, the budget was set to zero, which, in reality, means no investment in clearing activities. The total clearing cost thus becomes zero, and invasive alien plant clearance (e.g. Arundo donax clearance) becomes zero. The URV becomes undefined, because it is impossible to divide by zero, so the model does not simulate the extreme scenario, seeing that the numerator and denominator in the URV equation are zero. The model outcomes for this condition are presented in Figure 8 and are in agreement with this extreme condition.
The outcome of the above model validation tests are positive, i.e. the model outcomes are according to a priori expectations, so the model can be used for further analysis in this study.
4 Results
4.1 Description of scenarios
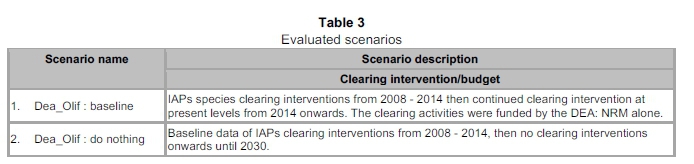
System dynamics modelling is used to evaluate the impact of clearing IAP early rather than waiting until the area is heavily degraded. The system dynamics model was used to (i) estimate the extent of IAPs clearance at the study site, (ii) simulate potential water value by clearing IAPs at the study site, and (iii) estimate the URV from clearing IAPs at the study site. These three specific objectives were assessed, using two scenarios characterised by various investments in clearing IAPs (i.e. budgets), as indicated in Table 3.
4.2 Clearing IAPs
The number of hectares cleared is a function of person days, which is, in turn, a function of the budget. The relationship between these functions indicates that an increase in person days results in an increase in the number of hectares cleared. In addition, the clearing of invaded hectares reduces the extent of invasion.
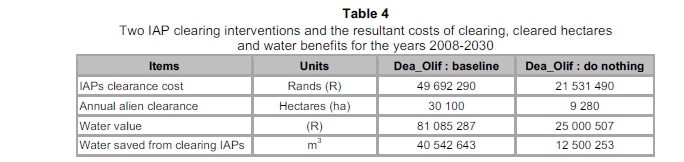
Table 4 presents the following scenarios: Dea_Olif: baseline scenario indicates a business as usual case, in which a total of R49 692 290 was spent to clear 30 100 ha of invaded area. The clearing activities occurred from 2008 to 2014 and then from 2015 to 2030 at the same rate of clearing and with a constant budget. The second scenario (Dea_Olif: do nothing) indicates a case in which IAP clearing occurs from 2008 until 2014, after which there will be no clearing from 2015-2030. The cost incurred for clearing 9 280 ha is R21 531 490.
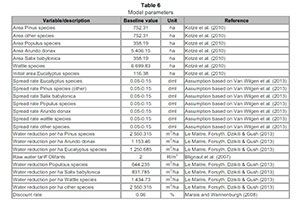
In addition, Table 4 also indicates the monetary value of water and the quantities of water realised from the two interventions. The fluctuation in water saved from clearing the IAPs can be ascribed to two processes: (i) invasive alien clearing activities and (ii) absence of clearing activities. The former increases water saved and the latter allows for more invasive alien plant species to spread, which would consequently lower the amount of water saved. The alien water value, which is the product of multiplying the litres of water saved by a raw water tariff of R2.00 (see Table 6, Annexure A1) expresses the monetary value of the water. The Dea_Olif: baseline scenario indicates that 40 542 643m3 of water is saved from clearing IAPs, and the water value is R81 085 287. In the case of the Dea_Olif: do nothing scenario, a minimum of 12 500 253m3 of water is saved, and the water value is R25 000 507.
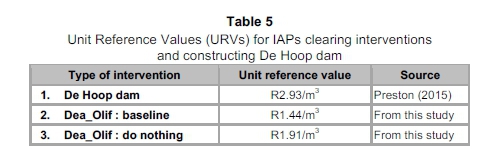
Using the Unit Reference Value (URV) formula, the cost effectiveness of water generation through IAPs clearing internventions was computed (Table 5). In a study conducted by Preston (2015), a Unit Reference Value of building the De Hoop dam is estimated at R2.93/m3. This is considerably higher than that of clearing IAPs.
5 Discussion
The spread of invasive alien plants is a dynamic phenomenon and requires investment in both ensuring that their spread is controlled and in managing the hectares invaded. Through the scenarios presented in section (4), the Dea_Olif: baseline data indicates that the interventions to clear alien invasive plant species from 2008 to 2030 were effective in clearing 30 100 ha with a budget of about R50 million. In in the event of no clearing activities occurring from 2015 to 2030 (Dea_Olif: do nothing), only 9 280 ha would have been cleared, with a budget of R21 million. The two IAPs clearing interventions also indicate that the higher the number of hectares cleared, the higher the quantities of water and water value saved. Hence, with Dea_Olif: baseline scenario, 40 542 643 m3 of water valued at R81 085 287 are saved. In the case of Dea_Olif: do nothing scenario, 12 500 253m3 of water valued at R25 000 507 are also saved. No clearing from 2015 to 2030 would translate to a water value of more than R56 million should the entire area be invaded. Returning to the assertions made earlier, Le Maitre et al. (2000) state that controlling the spread of IAPs is economical in comparison with alternative water-supply schemes. The outcomes of this study accord with this statement, because the URV of clearing invasive alien plant species by means of Dea_Olif: baseline and Dea_Olif: do nothing are R1.44/m3 and R1.91/m3. Whereas, that of constructing a new dam (e.g. the De Hoop dam) is R2.93/m3.
6 Conclusion
The impact of IAPs on water sources is a threat to water security and the sustainability of water bodies. The outcomes of this study indicate that clearing IAPs is a very cost-effective strategy. The URV of clearing IAPs is estimated at R1.44/m3 as opposed to that of R2.93/m3 of the De Hoop dam. This implies that the cost of clearing IAPs as a water infrastructure protection option is less than the cost of the infrastructure. Cost measures of less than R2.93m3 should therefore be considered an effective means of protecting the infrastructure, allowing it to yield the water. Forfeiting the water because of IAPs implies a societal loss of R2.93/m3. Stated differently, the opportunity cost of not clearing the IAPs (R2.93/m3) is higher than that of clearing (R1.44/m3). This makes IAP clearing a socially desirable investment. Water consumed by IAPs is quite significant, so clearing the IAPs is an essential measure to ensure that less water is lost and is instead made available to support desirable economic activities like agricultural production and to support natural ecosystems, and the conservation of the water reserve.
Acknowledgements
The authors would like to acknowledge the following organisations for their support and valuable input: the Department of Environmental Affairs (DEA: Natural Resource Management), and the South African Environmental Observation Network (SAEON).
References
BASSON, M.S., VAN NIEKERK, P.H. & VAN ROOYEN, J.A. 1997. Overview of water resources availability and utilisation in South Africa. Pretoria: Department of Water Affairs and Forestry. Report P RSA/00/0197. [ Links ]
BARLAS, Y. 1994. Model validation in system dynamics. In Wolstenholme, E. & Monaghan, C. (eds.) Proceedings of the 1994 international system dynamics conference. System Dynamics Society, Sterling, Scotland. [ Links ]
BLIGNAUT, J.N., MARAIS, C. & TURPIE, J.K. 2007. Determining a charge for clearing of invasive alien plant species to augment water supply in South Africa. Water South Africa, 33:27-34. [ Links ]
BLIGNAUT, J., MANDER, M., SCHULZE, R., HORAN, M., DICKENS, C., PRINGLE, K., MAVUNDLA, K., MAHLANGU, I., WILSON, A., McKENZIE, M. & McKEAN, S. 2010. Restoring and managing natural capital towards fostering economic development: Evidence from the Drakensberg, South Africa. Ecological Economics, 69:1313-1323. [ Links ]
DEPARTMENT OF WATER AFFAIRS AND FORESTRY. 1997. The working for water programme: Annual report 1996/97. Department of Water Affairs and Forestry, Pretoria. [ Links ]
DEPARTMENT OF WATER AFFAIRS. 2011. Development of a reconciliation strategy for the Olifants river water supply system. [ Links ]
DEPARTMENT OF WATER AFFAIRS. Not dated. The location of Olifants river catchment in Mpumalanga Province, South Africa. [ Links ]
DEPARTMENT OF ENVIRONMENTAL AFFAIRS. Not dated. Project programmes. Available at: https://www.environment.gov.za/projectsprogrammes [accessed October 2016]. [ Links ]
FORRESTER J,W. 1961. Industrial dynamics. Cambridge, Massachusetts: MIT Press. [ Links ]
FORRESTER, J.W. & SENGE, P.M. 1980. Tests for building confidence in system dynamics models. Time Studies in the Management Science, 14:209-228. [ Links ]
GHAHRAMANZADEH, R. 2013. Efficient distinction of invasive aquatic plant species from non-invasive related species using DNA barcoding. Molecular Ecology Resources, 13(1):21-31. [ Links ]
HODGSON, F.D.I. & KRANTZ, R.M. 1998. Groundwater quality deterioration in the Olifants river catchment above the Loskop dam with specialised investigations in the Witbank dam sub-catchment. Pretoria: Water Research Commission. Report 291/1/98. [ Links ]
KEMP, M., DE KOCK, K., WEPENER, V., ROETS, W., QUINN, L. & WOLMARANS, C.T. 2014. Influence of selected abiotic factors on aquatic macroinvertebrate assemblages in the Olifants river catchment, Mpumalanga, South Africa. African Journal of Aquatic Science, 39(2):141-149. [ Links ]
KOTZÉ, I., BEUKES, H., VAN DE BERG., E. & NEWBU. T. 2010. National invasive alien plans survey. Report number: gw/a/2010/21. [ Links ]
LE MAITRE, D.C., GAERTNER, M., MARCHANTE, E., ENS, E.J., HOLMES, P.M., PAUCHARD, A., O'FARRELL, P.J., ROGERS, A.M., BLANCHARD, R. & BLIGNAUT, J. 2011. Impacts of invasive Australian acacias: Implications for management and restoration. Diversity and Distributions, 17:1015-1029. [ Links ]
LE MAITRE, D., FORSYTH, G., DZIKITI, S. & GUSH, M. 2013. Estimates of the impacts of alien plants on water flows in South Africa. Water SA, 42(4):659-672. [ Links ]
LE MAITRE, D.C., MAGIDI, T.N., SCHONEGEVEL, L., NEL, J., ROUGET, M., RICHARDSON, D. & MIDGLEY, C. 2004. Plant species in South Africa, Lesotho and Swaziland: Assessing the potential impacts of major and emerging plant invaders. [ Links ]
LE MAITRE, D.C., VERSFELD, D.B. & CHAPMAN, R.A. 2000. The impact of invading alien plants of surface water resources in South Africa: A preliminary assessment. Water SA Pretoria, 26(3):397-408. [ Links ]
LENDA, M. 2014. Effect of the internet commerce on dispersal modes of invasive alien species. Plos One, 9(6):1-7. [ Links ]
MARAIS, C. & WANNENBURG, A.M. 2008. Restoration of water resources (natural capital) through the clearing of invasive alien plants from riparian areas in South Africa - Cost and water benefits. [ Links ]
MEIJNINGER, W.M.L. & JARMAIN, C. 2014. Satellite-based annual evaporation estimates of invasive alien plant species and native vegetation in South Africa. Water SA, 40(1):95-107. [ Links ]
MUGIDO, W., BLIGNAUT, N., JOUBERT, M., DE WET, J., JOUBERT, S., COBBING, B., LE MAITRE, D & VAN DER VYFER, M. 2014. Determining the feasibility of harvesting invasive alien plant species for energy. South African Journal of Science, 110(11):45-50. [ Links ]
PRESTON, I.R. 2015. Water supply development decision-making in South Africa. Masters' Thesis. Rhodes University. [ Links ]
RASHLEIGH, B., HARDWICK, D. & ROUX, D. 2009. Fish assemblage patterns as a tool to aid conservation in the Olifants River catchment (East), South Africa. Water SA, 35(4):517-524. [ Links ]
STATISTICS SOUTH AFRICA. 2012. Census 2011. [ Links ]
STERMAN, J.D. 2000. Business dynamics: System thinking and modelling for a complex world. New York: McGraw-Hill/Irwin. [ Links ]
VAN NIEKERK, J. 2012. Technological innovation in the design and construction of De Hoop dam. Paper Presented at the Test and Measurement Conference, Durban, 3-5 September. Available at: http://www.nla.org.za/webfiles/conferences/2012/papers/tuesday,%204%20september/T1 12%20%20technological%20innovation%20in %20the%20design%20and%20Construction%20of%20de%20hoop%20dam.Pdf [accessed April 2016]. [ Links ]
VAN NIEKERK, P.H. 2013. Hydrologic-economic appraisal of inter-basin water transfer projects. Phd Thesis, Stellenbosch University. Available at: http://hdl.handle.net/10019.1/79887 [accessed April 2016]. [ Links ]
VAN WILGEN, B.W., COWLING, R.M. & BURGERS, C.J. 1996. Valuation of ecosystem services: A case study from fynbos, South Africa. Bioscience, 46:184-189. [ Links ]
Van Wilgen, B.W & Le Maitre, D.C. 2013. Rates of spread in invasive alien plants in South Africa. Council for Scientific and Industrial Research, Stellenbosch. [ Links ]
VENTANA SYSTEM. 2003. Vensim® standard professional DSS tutorial Harvard, USA, 60 Jacob Gates Road. [ Links ]
VERSFELD, D.B., LE MAITRE, D.C. & CHAPMAN, R.A. 1998. Alien invading plants and water resources in South Africa: A preliminary assessment. The commission. [ Links ]
WATER FOR GROWTH AND DEVELOPMENT DEPARTMENT OF WATER AFFAIRS AND FORESTRY AND INTERNATIONAL WATER MANAGEMENT INSTITUTE. 2008. Applying the Gini coefficient to measure the distribution of water use and benefits of water use in South Africa's province. [ Links ]
WATER INSTITUTE OF SOUTHERN AFRICA. 2013. The Olifants river Limpopo/Mpumalanga Province. Available at: http://www.ewisa.co.za/misc/School/oLIFANTS%20COVER.pdf [accessed April 2016]. [ Links ]
WRAY, M. 2006. Is the department of water affairs killing the Olifants River? Biodiversity Conservation. Endangered Wildlife, 11(55):24-25. [ Links ]
ZEBDA, A. 2002. Using cost-benefit analysis for evaluating decision models in operational research. Journal of American Academy of Business, 2(1):106-114 [ Links ]
Accepted: October 2016
* Corresponding author: morokons.t@gmail.com

