


Services on Demand
Article
 English (pdf)
 Article in xml format
 Article references
Indicators

Related links
-
 Cited by Google
 -
 Similars in Google
Share

 Permalink
South African Journal of Economic and Management Sciences
On-line version ISSN 2222-3436
Print version ISSN 1015-8812
S. Afr. j. econ. manag. sci. vol.19 n.4 Pretoria 2016
http://dx.doi.org/10.17159/2222-3436/2016/v19n4a13
ARTICLES
Analysis of the South African input-output table to determine sector specific economic impacts: a study on real estate
Douw BoshoffI; Reyno SeymoreII
IConstruction Economics, University of Pretoria
IISchool of Economics, University of Pretoria
ABSTRACT
Input-output analysis is a well known method of analysing specific economic activity and the influence of different sectors on the economy and on one another. This study investigates the ability of input-output analysis to consider the importance of commercial real estate on the economy. It analyses the economic activity, contribution to GDP, employment created and taxes generated with reference to direct, indirect and induced impacts. The research shows the contribution of the specific sector on the economy and highlights the ability of input-output analysis to determine the impact of different types of property and locational analysis. The interaction of property with the economy is discussed, which also enables the use of the analysis reported here for short term future forecasting, whereby expected real estate activity is used to forecast the direct, indirect and induced effects on the economy.
Key words: South Africa, input-output analysis, real estate economics, economic impact, property activity, short-term economic forecasting
JEL: A120, C670, R110, 150
1 Introduction
Real Estate is considered globally as a very important contributor to economic activity. Not only does it provide the space needs for virtually all other economic activities to take place, including manufacturing, retail activities, business services etc., but itself also contributes directly and indirectly to economic activity and job creation. Altogether the real estate sub-sector is reported by the South African Reserve Bank within the financial intermediation, insurance, real estate and business services sector. During 2013 the sector contributed a total of R1 320 billion to the fixed capital stock of the country, while the gross fixed capital formation for the sector added R97 856 million to this figure for the same period, which represents 20.9 per cent and 14.95 per cent respectively of the whole economy. Of the abovementioned capital formation, R69 697 million, or 71.2 per cent of the sector, is attributable to non-residential buildings. Apart from the capital investment of the sector in the economy, non-residential real estate also contributed R81 billion to the gross domestic product of South Africa during 2013, before the effects of taxes and subsidies are taken into consideration, which resulted in approximately 212 000 jobs, 1.5 per cent of all jobs in the economy. The objective of the study is to analyse the property sector by making use of input-output (I-O) analysis in order to determine the influence of this sector on the economy. The originality of the paper is vested in the multi-disciplinary view it uses to show the total impact of the sector on the economy, including its direct, indirect and induced impacts.
The paper is structured as follows: Section 2 provides the theoretical framework consisting of basic principles and previous literature. Section 3 provides an overview of historical economic as well as sector-specific activity while the impact of such activity is measured and documented in Section 4. The theory and interrelatedness of concepts are discussed and validated in Section 5, whereafter a short-term forecasting of impact is provided in Section 6.
2 Theoretical framework
The South African National Income and Production Accounts (NIPA) provides a good overview of the South African economic system. In addition, there are various models and literature that explain the relationships within the property sector, collectively referred to as space and capital markets (Archer & Ling, 1997; Archour-Fischer, 1999; Dipasquale & Wheaton, 1992; Du Toit, 2002; Fisher, 1992; Fisher, Hudson-Wilson & Wurtzebach, 1993; Viezer, 1998; and Viezer, 1999). Boshoff (2013) performed a case study on the applicability of these models to the South African economy. The explanation of space and capital markets by various authors highlights the interrelatedness of real estate and certain economic applications. It is important to note that real estate forms a critical part of the economic system and that it is equally influenced by economic variables. Boshoff (2013) shows that a long term relationship exists between the demand for space and construction activity that forms the supply of real estate and thus dictates the equilibrium point of real estate activity.
The South African NIPA accounts provide an overview of the general economic system and how the property sector fits into this system. The more specific property activities could then be explained by theories on space and capital markets so that these variables and their interrelated impact could be measured by way of I-O analysis.
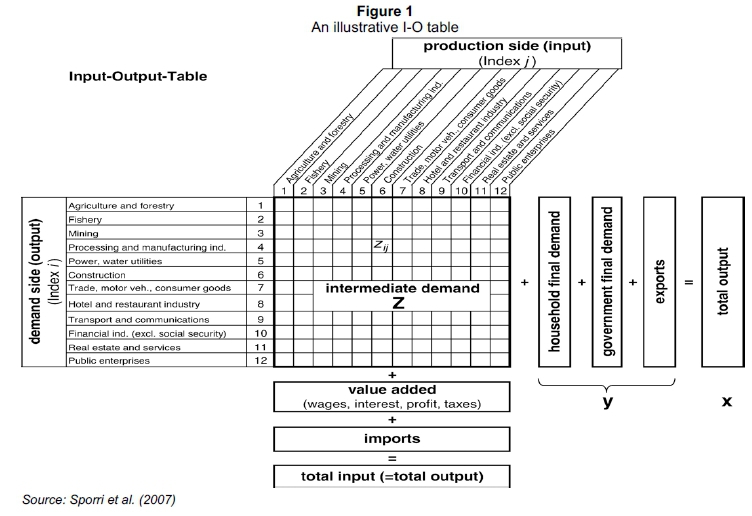
An input-output (I-O) matrix is a representation of national or regional economic accounting that records the way industries trade with one another and produce (in other words; the flow of goods and services). Flows are registered in a matrix, simultaneously by origin and by destination (OECD, 2006). The input-output analysis is the standard method for measuring the spread effects of changes in the final demand for a product of an industry or sector (Surugiu, 2009).
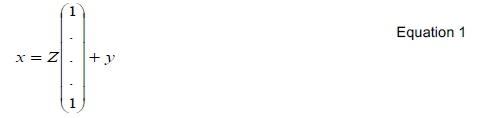
A standard I-O table is shown in Figure 1. Input flows are recorded in the columns of the table, and outputs are recorded in the rows (Sporri, Morsuk, Peters & Reichert, 2007). Intermediate demand (Z) represents the inter-industry transactions table, a matrix of transactions between the producing sectors. Final demand (y) consists of the household, government and rest of the world sectors. Value added to the producing sector consists of capital and labour, and receives interest and wages.
An I-O analysis is typically used to calculate the economic effects of exogenous changes in y; for example, the economic impact (in terms of industry output, employment and income) of a new harbour development, in both the short and longterm, on a specific economy.
If x represents the vector of industry outputs, y the vector of final demand and Z the matrix of inter-industry transactions, then the relationship between these is (Sporri et al., 2007):
A matrix of technical coefficients (A) is then derived by dividing inter-industry transactions by output:
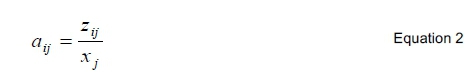
The elements of A describe the direct, first round impact of any change in final demand. In other words, how much input from sector i is used per monetary output of sector j. When this is solved for production as a function of final demand, the Leontief inverse matrix (L = (I - A)-1) is calculated.
The Leontief inverse matrix can then be used to calculate the output multiplier, the income multiplier and income effects (D'Hernoncourt, Cordier & Hadley, 2011).
The output multiplier for a particular industry can be defined as the total of all outputs from each domestic industry required in order to produce one additional unit of output.

The income multiplier indicates the increase in income from employment as result of a change of R1 of income from employment in each industry.
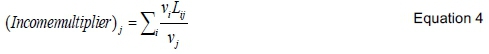
Where:
viz the ratio of employment to output for each industry.
Lastly, the income effects show the impact on income from employment throughout the economy arising from a unit increase in final demand for industry j's output.

The following assumptions underlie any I-O analysis:
• The production functions of industries do not change.
• The economy can be described with linear production functions.
• The region is large enough to make imports by individuals insignificant.
It is important to note that I-O tables assume linear relations between inputs and outputs from different sectors as well as linear relations between outputs and final demand (D'Hernoncourt, Cordier & Hadley, 2011).
Employment impact
The Leontief inverse matrix together with employment data can be used to calculate the employment multiplier and employment effects (D'Hernoncourt, Cordier & Hadley, 2011).
The employment multiplier shows the total increases in employment throughout the economy resulting from an increase in final demand.

Where:
w is equal to one full-time job per rand of total output for each industry.
Employment effects calculate the impact on employment throughout the economy arising from a change in final demand for industry j's output of one unit.

Depth of impact estimation
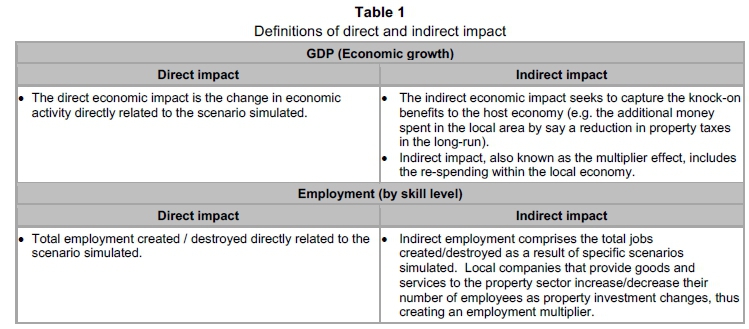
The analysis will estimate direct, indirect and induced impacts. Table 1 provides definitions of the direct and indirect impacts. They distinguish between GDP (economic growth) and employment (by skill level).
The induced impact measures the next round of impacts which are the results from a change in household spending in the general economy.
3 Economic activity within the real estate sub-sector
This section will provide some statistics on the activities within the real estate sector. This is in order to understand the extent of the sector in the economy, as well as to indicate the trends of activity. It is important to note that the relationship between the real estate sector within the wider economy, as well as the activity in the construction is typically explained under FDW and REEFM models (Boshoff, 2013).
a) General economic activity
i Economic activity
The economic activity for South Africa over the past ten years, up to the end of 2013, is displayed in Figure 2. In the context of input-output analysis, total economic activity is calculated as the sum of the value of all inputs on the production side (intermediate demand), as well as the value of final demand (final demand from households, government and exports). It is evident that there was a gradual increase with a stable growth in activity, with the actual figures in R million indicated by the bars and the year-to-year growth displayed in figures next to each bar. The period between 2004 and 2008 was characterised by large increases in economic prosperity which were felt throughout the economy, with growth of up to 14.4 per cent per year during the 2007/2008 period.
During the 2009 recessionary period, economic activity slowed down to just above 7 per cent and has remained below 8 per cent ever since, with economic activity growing to just below R1O trillion by the end of 2013.
Although economic activity showed stable increases, it is considered to be a weak indicator of the real state of economic growth in the country since it partly reflects price increases. It is nevertheless important to note this as it indicates the sum of all activity in the different sectors of the economy.
ii Gross domestic product
The real GDP (at constant 2005 prices), defined as the market value of final goods and services newly produced within South Africa during one year, at constant 2005 market prices, shows a 10-year average growth of 3.40 per cent. It is also indicated in Figure 4 that during the 2009 recessionary period a negative growth of -1.53 per cent was experienced and although increasing again to 3.14 per cent and 3.60 per cent in 2010 and 2011 respectively, the growth slowed down to 2.47 per cent and 1.89 per cent during 2012 and 2013 respectively. This caused the average growth for the past five years, or the period since the start of the 2009 recession, to slow to 1.9 per cent.
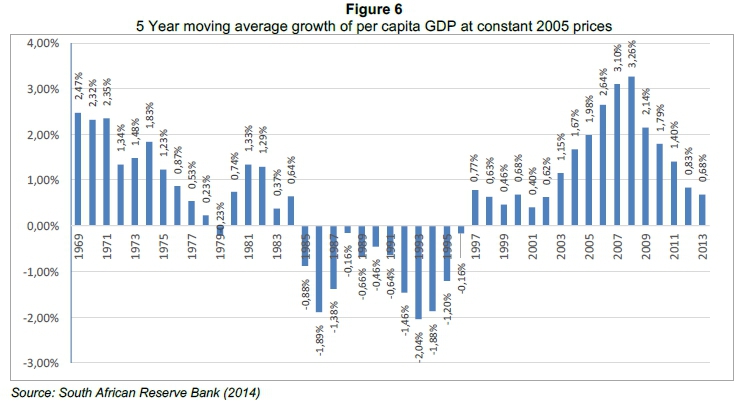
The GDP should, however, be considered also taking into consideration the number of people that contributes to this. In this regard the per capita GDP, or GDP divided by the population of the country, provides another insight into the economic situation. Still remaining on the real GDP, the y-o-y per capita GDP at constant 2005 prices is indicated by Figure 5. From this it is evident that the growth started to slow down from 2008, turning negative in 2009 and although positive again in 2010 and 2011, it slowed down again in 2012 and 2013. If a five-year moving average growth is considered, as indicated by Figure 6, it can also be seen that the period immediately prior to the 2009 recession was a particularly prosperous one, with five-year average growth for three consecutive years being the highest in the history of South Africa, or at least for the period that data is available. This, however, slowed down significantly in the subsequent years and, if this trend continues, might turn negative soon.
iii Employment
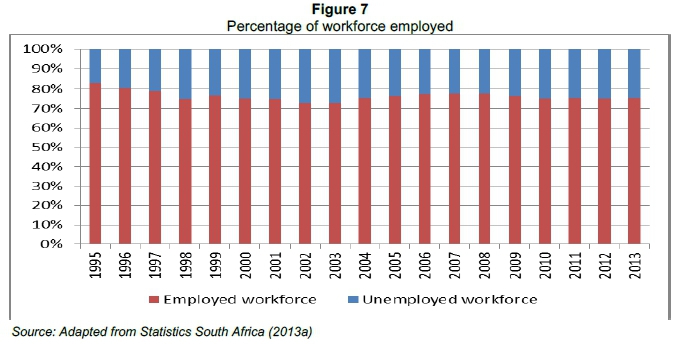
It was mentioned in the previous section that the population size should be taken into consideration when looking at the GDP figures. In addition to this, the official employment and unemployment figures should also be considered in order to comprehend the influence of real estate on the economy. According to the 2011 census, the total population of South Africa is approximately 51,77 million people. For the past 20 years the average annual population growth was approximately 1.7 per cent, slowing down to an average of 1.34 per cent for the past ten years and 1.18 per cent for the past five years. This gives an estimated current population of approximately 53,01 million people.
Statistics South Africa (2015a) defines unemployed persons as those, aged 15-64 years, who:
a) were not employed in the reference week; and
b) actively looked for work or tried to start a business in the four weeks preceding the survey interview; and
c) were available for work, i.e. would have been able to start work or a business in the reference week; or
d) had not actively looked for work in the past four weeks but had a job or business to start at a definite date in the future and were available.
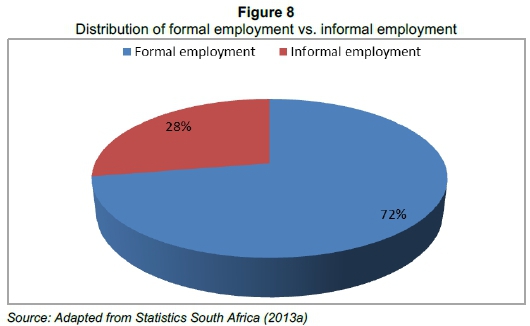
The total employed workforce was approximately 14,07 million people in 2011, with a total unemployment of 24.8 per cent (narrow definition) during that year, indicating a total workforce of approximately 18,70 million people. The distribution of employment vs. unemployment is displayed in Figure 7.
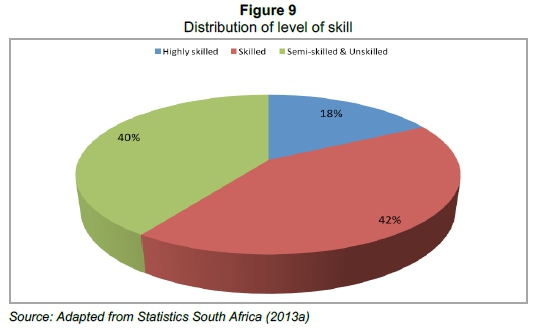
Of the total employed workforce, approximately 72.4 per cent is formally employed and 27.6 per cent informally employed as indicated by Figure 8, while the former is divided into 17.4 per cent highly skilled, 42.2 per cent skilled and 40.4 per cent semi-skilled and unskilled, shown in Figure 9.
iv Tax generated
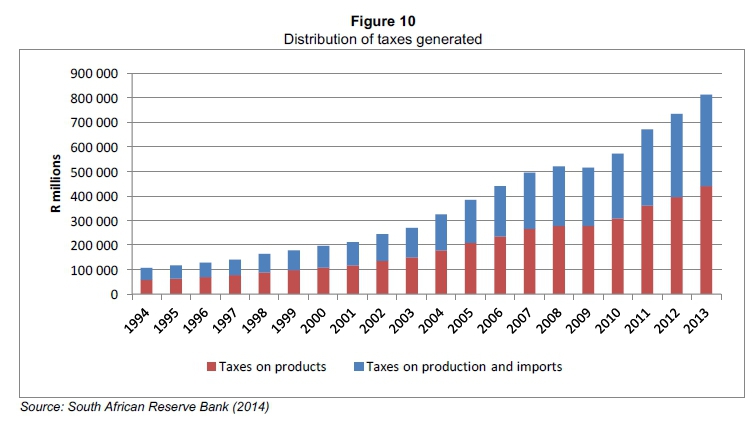
Total taxes generated in the economy could be viewed from the total taxes on products and production in order to compare the amount of taxes on products and production generated by the real estate sector to that of the rest of the economy. In the context of input-output analysis, "net taxes on products" and "other taxes less subsidies", are captured in the value- added matrix. This total is indicated in Figure 10. The total nominal tax generated is approximately R439 billion for taxes on products and R374 billion in taxes on production and imports as at the end of 2013. This amounts to a total increase of approximately 11.45 per cent and 11.61 per cent per annum respectively over the past 20 years.
Another two sets of taxes that are recorded by the SARB are the national government tax revenue from property and the local government cash receipts from taxes. These are displayed in Figure 11 and provide an indication of property-specific taxes. They are not the same as taxes in products and production in the property sector, but should be viewed separately.
b) Industry-specific economic activity
In this section, the past economic activity within the construction sector and real estate sub-sector will be provided. The link between construction and real estate needs to be re-affirmed, as the real estate sub-sector creates the opportunities for the construction sector, while the latter provides additional stock to the former, which changes the general equilibrium levels, as per space and capital market theory. The emphasis of this section will be to indicate the activity specifically with regard to building plans passed and buildings completed. This makes it possible to distinguish between the relative size of the economic activity within different geographical areas as well as different types of buildings. Lastly, by considering the amount spent on buildings completed in relation to the total square meter size of buildings completed, it is possible to provide an indication of the cost per square meter spent on these buildings, which provides an indication of cost changes over time, but more importantly, also provides an indication of the quality of buildings being built in different geographical areas and for different purposes.
i Building plans passed
The total building plans passed in all larger municipal areas as indicated in Figure 12 increased gradually from 2001 through to a peak in May 2007, after which a reduction could be seen during the recessionary period before a gradual increase since the first half of 2010. It is, however, evident that the total number of building plans passed is approximately at the same level as in 2007 before the decline, although the economy has strengthened a fair amount since then. This leaves the total number in real terms still behind 2008, with a total value of just over R85 billion at the end of 2013, or a monthly average of approximately R7.1 billion, compared to approximately R86.5 billion during 2007, with a monthly average of R7.2 billion.
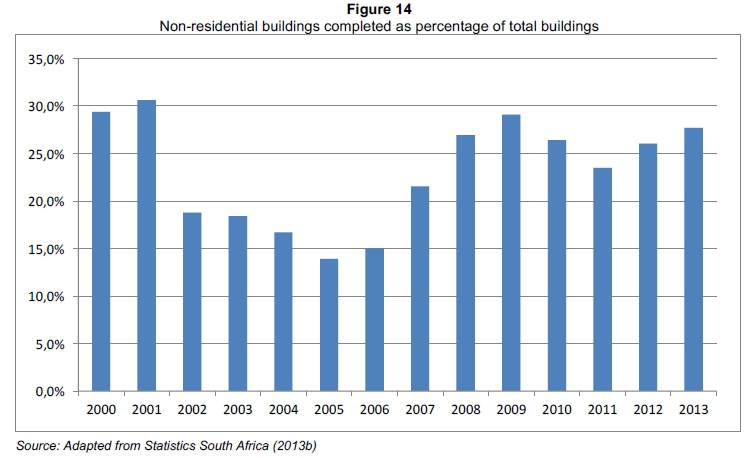
This total figure, R7.2 billion, includes all property, and the contribution of non-residential property as a percentage of all property can be seen in Figure 12. From this it is evident that commercial property remains between approximately 15 per cent and 30 per cent of total property, with a gradual increase since early 2004 up to 2010 and after a short steep decline, another increase since early 2011. Although not empirically tested, this seems to follow a similar trend to the economic activity, suggesting a relationship between economic activity and real estate demand. This is in line with the a priori expectation due to property being required for all commercial activity, i.e. offices for business services, shopping centres for retail and industrial buildings for manufacturing and other industrial activity. It furthermore suggests that residential property is less sensitive to economic activity, but more to affordability (refer Boshoff, 2010).
ii Buildings completed
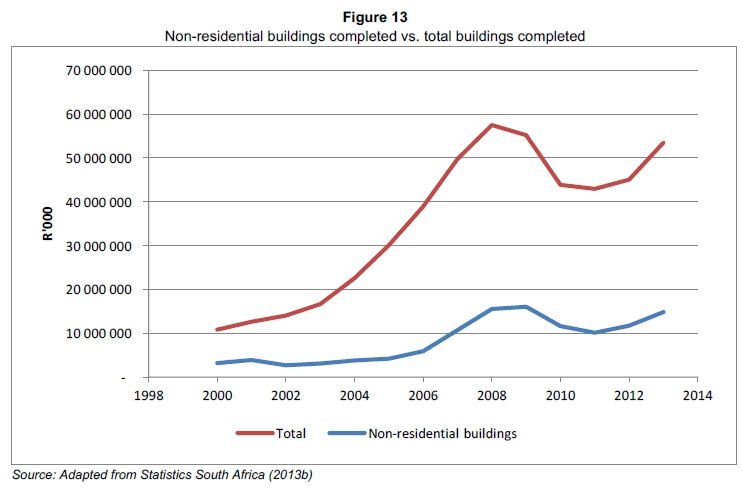
The statistics for buildings completed provide a view on the addition of stock to the property market and are useful in determining the economic activity between different types of buildings and in different geographical locations. Furthermore, by considering the economic cycle in both building plans passed and buildings completed, it is possible to see how long it takes for the value of buildings completed to react to a change in building plans passed. This provides an economic lag which could then be used to forecast the value of buildings to be undertaken, by considering the current level of building plans being passed and also to evaluate the percentage of buildings that are actually built after the plans are passed.
In Figure 13 the total annual value of buildings completed nationally is shown alongside the value of non-residential buildings completed. Figure 14 then shows the total value of nonresidential buildings as a percentage of the total.
iii Construction costs per m2
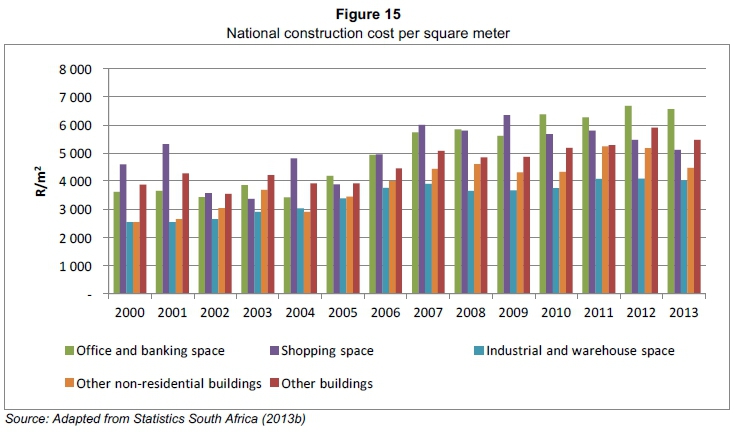
Figure 15 provides the information with regard to the cost of construction of different building types at constant 2010 prices. This provides a view on the change in cost due to specification level changes. It can be seen that office and banking space is lately being provided at the highest cost of construction, although there are a number of periods where shopping space is very similar. This is then followed by other non-residential buildings and additions and alterations while industrial and warehouse space is being added at the lowest cost of construction. Of importance in these figures is also the fluctuations in costs over time, caused by specification levels and geographical areas.
4 Contribution to the South African economy
This section will specifically consider the results of the I-0 analysis and discusses the influence that different property types in different geographical areas has on the South African economy. The first set of results provides the economic activity that is created within the real estate sub-sector, followed by the influence on the GDP, employment opportunities created and lastly tax generated. It should be noted that the following figures are based on the economic relationships between real estate and other sectors only. They exclude the physical aspect of properly being used for any economic activity and the influence of that on the economy.
a) Economic activity
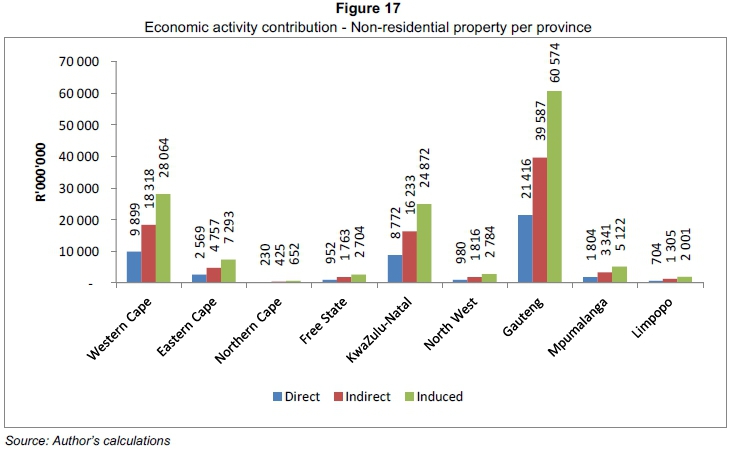
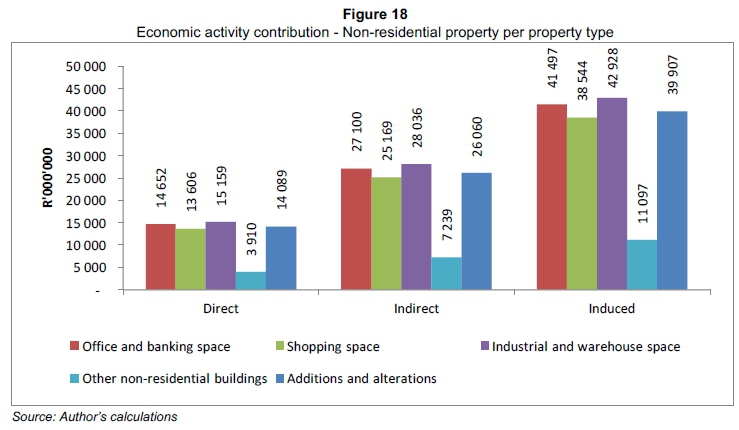
As mentioned in Section 3, the total economic activity in South Africa amounted to R9,316,400 million. Of this, the contribution of non-residential real-estate is calculated by the I-0 analysis to be approximately 0.66 per cent through direct impact, 1.22 per cent through indirect impact and 1.87 per cent by including induced impact. This comes to a total contribution of R61,416 million direct impact, Rl13,604 million indirect impact and R173,973 million induced impact. This impact on economic activity by non-residential real estate as attributed to the different provinces is provided as per Figures 16 and 17. It is evident that the greatest economic activity occurs in Gauteng, followed by the Western Cape and then KwaZulu-Natal.
The direct impact is measured using the technical coefficients as derived by equation 2. The direct impact considers the value of the real estate necessary to enable the current level of economic activity or GDP. The tax generated by the real estate sector, associated with this level, is also reported. The indirect impact applies equations 3-9 and considers the indirect impact of the real estate sector, by including the knock-on benefits of the real estate industry. This is also known as type 1 multipliers. Lastly, the induced impact is measured using type 2 multipliers, taking into account changes in household spending. Household spending is effectively endogenized in the transaction matrix. This could be seen as the broadest measure of economic impact. Type 2 multipliers are used as published by Statistics South Africa (2015b).
b) Gross domestic product (GDP)
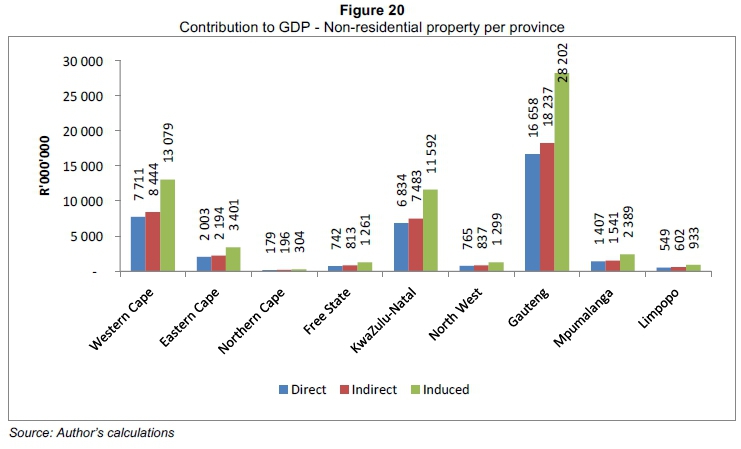
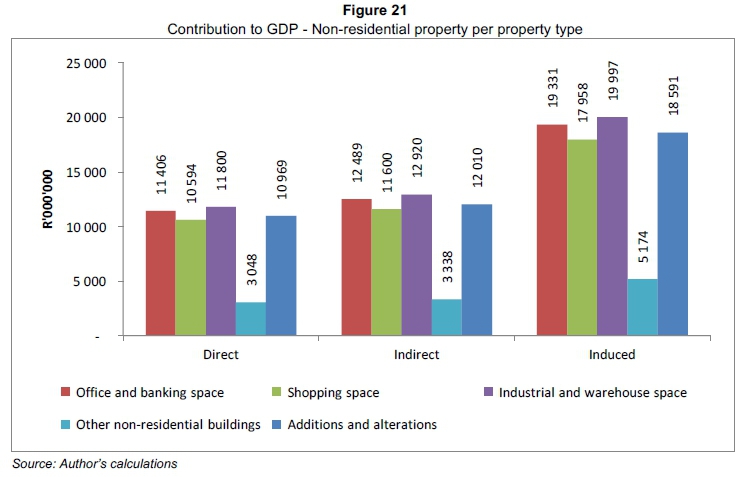
The total GDP for South Africa in 2013 was approximately R3,385,369 million. Of this, 1.41 per cent was created by non-residential real estate through direct activity, while the indirect impact was 1.55 per cent and the induced impact 2.39 per cent. This amounts to a total contribution of approximately R47,817 million added to the GDP by the real estate subsector directly, R52,357 million indirectly and R81,051million through induced impact, and is distributed in the different provinces as per Figure 19. The contribution of non-residential real estate to the GDP in the different provinces is shown in Figure 20, while the contribution by different property types nationally is shown in Figure 21.
a) Employment created
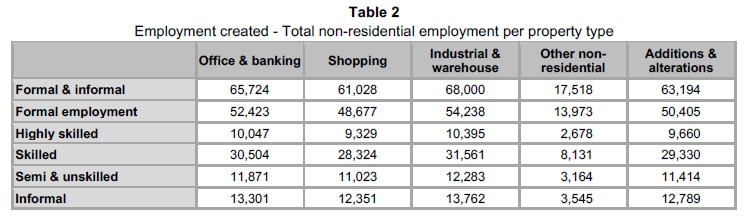
Employment opportunities are an important aspect to take into account when determining the influence of any aspect of the economy on the economy as a whole in order to assess the level to which the economic wealth is distributed to all people in the economy and the level of possible prosperity within the country. It is estimated that non-residential real estate created 212,270 jobs in total, which could be divided into 169,311 formal jobs and 42,960 informal ones as displayed in Figure 22.
Within the total numbers, the distribution of jobs between the different types of property nationally is estimated as per Table 2.
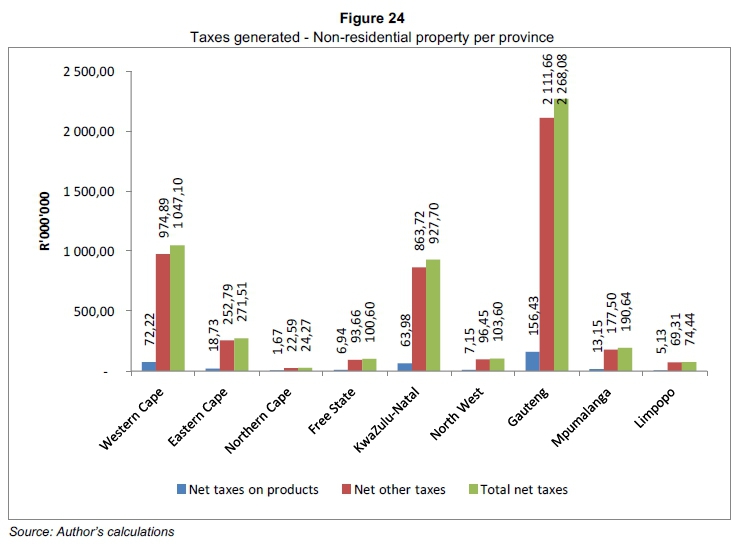
b) Taxes generated
The estimation of taxes generated within the real estate sub-sector is limited to net taxes on products as well as net taxes on production and other taxes. Net taxes include all taxes paid less subsidies received and are therefore an indication of the level of taxes generated, which could be applied to other functions in the economy. However, it excludes an indication of taxes and subsidies that cause structural changes within the sector, i.e. subsidies received by households for residential property and which are funded by taxes from non-residential real estate. This would cause the net taxes for residential property to be lower than indicated here, while net taxes for nonresidential real estate would actually be higher. It would, however, require a further, more in-depth study to obtain details of this.
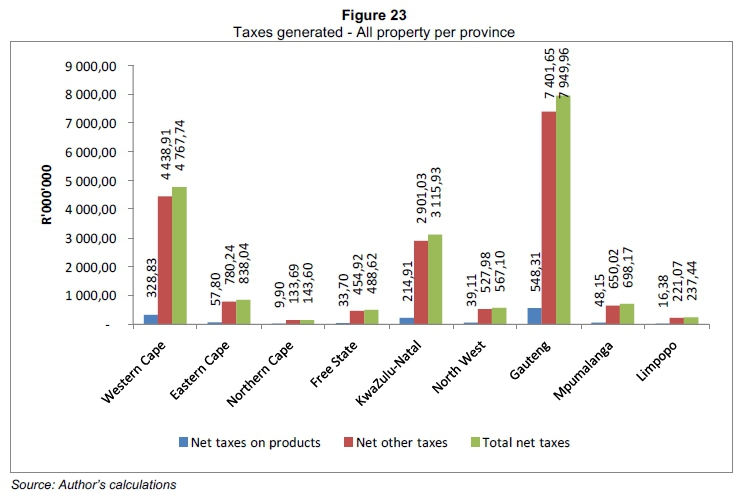
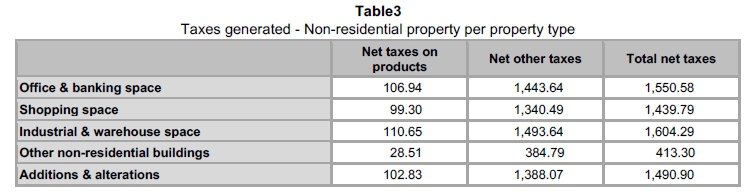
The estimated net taxes generated by all property activity are shown in Figure 23 while the estimated taxes generated by non-residential property are shown in Figure 24, both shown per province. Table 3 provides the national net taxes as estimated per property type.
5 Validation of theory
In Section 2, the basic principles of the I-0 analysis were provided. Section 3 then gave the details of economic activity in general as well as in the real estate sector specifically, while Section 4 provided a view of the impact of the real estate sector on the economy.
In order to validate this theory, it is necessary to make reference to the FDW-model or other similar space- and capital-market models, as well as the South African NIPA accounts. The FDW-model is provided in Figure 25 and its applicability to the South African commercial property market is previously explained by Boshoff (2013).
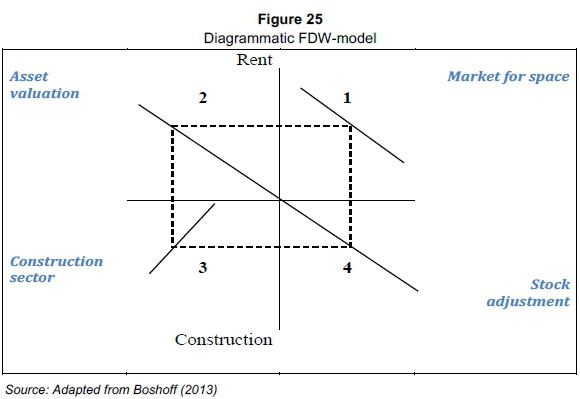
The circular flow of activities in the FDW-model is initiated by a demand for space in Quadrant 1 in the form of rent per square meter. The value of rent as carried forward to asset valuation Quadrant 2, whereby the rent is capitalised into a market value, represented by the slope of the asset value line and the subsequent intersection of the capitalised value on the x-axis. If this intersecting point is higher than the entry level cost of construction, represented by the construction sector line's intersecting point with the x-axis in Quadrant 3, new construction will take place at a rate represented by the slope of the construction line. With new construction, stock is created which adjusts the total stock, or supply of space, in Quadrant 4. This creates a new equilibrium level of supply and demand for rental to be paid in Quadrant 1.
With reference to the NIPA accounts, four accounts are differentiated, each consisting of two balancing computations as follows:
• Account 1: GDP and Expenditure
- Gross domestic product at market prices
- Expenditure on gross domestic product at market prices
• Account 2: National disposable income and appropriation
- Gross national disposable income
- Appropriation of disposable income
• Account 3: Gross capital formation and financing thereof
- Gross capital formation
- Financing of gross fixed capital formation
• Account 4: Transactions with the rest of the world
- Receipts
- Disbursements
The FDW-model and NIPA accounts can be integrated by considering the flow of funds through the NIPA accounts. Economic activity is captured under Account 1 on the income or production method as well as the expenditure method. On the expenditure side is included the consumption expenditure of households and general government. Consumption expenditure also includes expenditure on housing or other property, which is funded from compensation received as accounted for in the income or production method for calculating the GDP. On the other hand, the income or production method also includes the net operating surplus of business organisations, which is the profits made after accounting for operational expenses, such as rental of business premises, usually in the form of real property. This consumption of space as accounted for in Account 1 of the NIPA accounts, is thus reflected in Quadrant 1 of the FDW model as the demand for space i.e. rent paid.
Included in the calculation of GDP is compensation of employees, which is carried over to Account 2, ultimately leading to the calculation of gross national disposable income and the appropriation thereof. All income that is not consumed by households or general government is saved, and carried over as gross savings to the financing of gross fixed capital formation in Account 3. Gross saving includes personal savings, corporate saving, saving of general government and the consumption of fixed capital. These savings, together with net capital movements from the rest of the world and changes in gold and foreign reserves, account for the financing of gross capital formation. The availability of funds in this regard would affect interest rates and other returns on investment, which ultimately affects the rate at which rent is capitalised in Quadrant 2 of the FDW model.
Depending on the cost of construction, as indicated in Quadrant 3 of the FDW model and the interaction between demand and supply of space as per Account 1 of NIPA and Quadrants 1 and 4 of the FDW, new stock will be added in the form of construction, which forms part of gross fixed capital formation in Accounts 3 and 1 of NIPA.
From the above, it is evident that general economic activity creates demand for space and subsequently also the expansion thereof by way of construction or fixed capital formation. It is, however, also the case that these properties that form part of the gross fixed capital stock within the economy, need to be managed, financed, developed, etc., which is usually done by professional service companies within the financial and real estate sector. The income earned in this way is also included in total income that makes up the calculation of GDP or Gross National Disposable Income and used as consumption expenditure or savings. The property activity is thus based on demand for property due to other economic activity, but at the same time it also generates income that is spent in the economy, forming part of total economic activity. This latter income earned from direct property activity creates further economic activity, indicated previously as indirect impact on the economy, and also stimulates further entrance into the economy, indicated as induced impact. Of importance is the two-way interaction between property and the economy: firstly, through the services provided by property to the economy; but also through new economic activity that is created within the property sector itself.
This principle forms the basis for this research and the calculation of the impact of commercial real estate on the total economy by considering the economic activity that is generated within the real estate sector and how this is then generating further economic activity due to indirect and induced impact. To validate this, a two-way causality test is performed on the gross fixed capital formation and gross value added at basic prices, both within the finance, insurance, real estate and business services sectors, using time-series data from 1994 to 2014 at current as well as at constant 2010 prices. The data is transformed by taking the first difference in order to avoid coincidental correlation. The three years between 2009 and 2011, however, were removed due to an outlier effect caused by the global financial crises and further research would be required in order to explain data movement in this period of time.
The results indicated for current prices that a one- year lag is evident based on stronger correlation with a lag applied, but interestingly, is evident in both ways, i.e. there is evidence of two way causality between economic activity and property activity, but both ways of causality have a one-year lag. The correlation for gross value added leading and gross fixed capital formation lagging by one year is stronger (0.745) than when the lead and lag relationship is reversed (0.650). Both ways , however, indicate a stronger correlation than for a correlation without any lag (0.570). With gross fixed-capital formation leading and gross value-added lagging, the correlation reduces for lags longer than one year, but remains stronger than without any lag for up to a four- year lag. With the relationship reversed and gross value added leading and gross capital formation lagging, the correlation reduces to a lower level than the no-lag correlation immediately after year one.
For the constant 2010 prices, results indicated a stronger correlation (0.656) when a one- year lag is applied to gross value-added behind gross fixed capital formation than the correlation of the two variables with no lag (0.430). The correlation remains stronger (0.516) with a two-year lag, but falls significantly for longer lags. With the reversed lead-lag relationship, the correlations are lower than no-lag for any lag applied.
To summarise the above, current prices indicate that there is a one-year lag of gross fixed-capital formation behind gross value added in the financial intermediation, insurance, real estate and business services sectors. There is, however, also evidence of a one-year lag in the opposite direction, although not to the same level of confidence. It is furthermore also indicated that this reversed lag is evident when constant 2010 prices are applied. This indicates strong evidence of two-way causality between capital formation and value added, a relationship which is obscured in the latter when current prices are investigated, which might be due to the sensitivity of the two variables to economic changes as well as their magnitude. In the case of gross value added, the total volume has varied between three and six times that of gross capital formation. The fact that positive two-way causality is evident indicates that capital formation in the property sector has an influence on other economic activity in the sector which is up to six times more than the capital formation itself. This confirms the interaction between the space and capital markets as discussed, as well as the variables explained in the NIPA accounts.
With these relationships confirmed, it is possible to perform short-term future forecasting by considering the number of building plans approved, the expected buildings to be completed based on that and the impact that such capital formation would then have on the wider economy. This will be performed in Section 6.
6 Short-term future forecasting
In order to do some short-term forecasting, a view is taken on the average percentage of plans that are approved, are actually completed, as well as the lag between plan approval and completion. This provides the opportunity to forecast the total value of building activity, which would add stock to the real estate sector and provide a view of the expansion of the sector and the associated addition to economic activity, contribution to GDP, jobs created and taxes generated. These figures do, however, become fairly erratic and thus attempts have not been made to do the forecasting per property type in each province, but only for each property type nationally and each province across all property types.
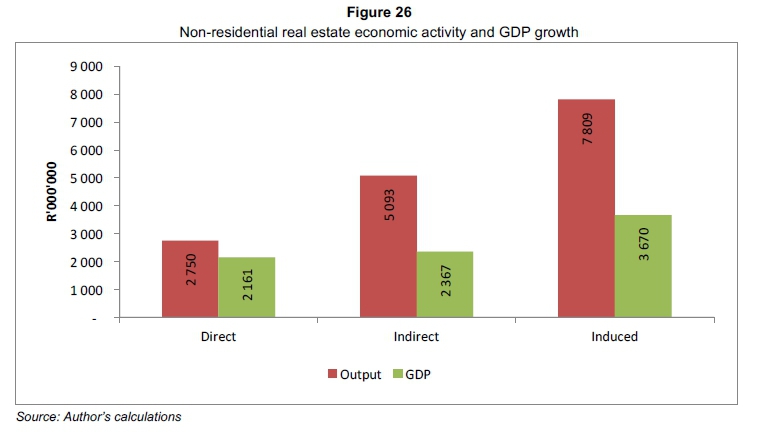
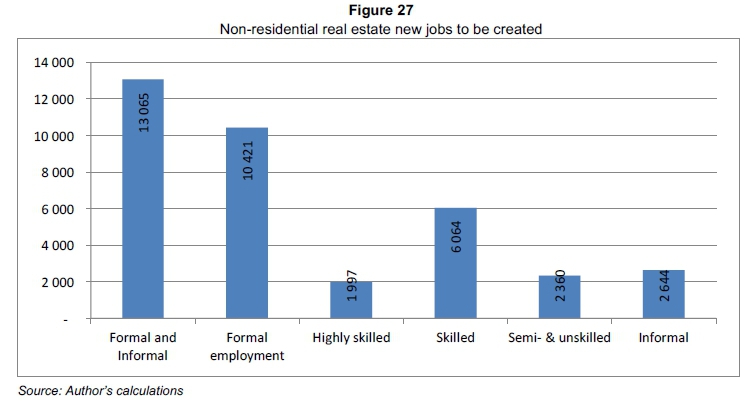
As indicated in Figure 26, it is estimated that the non-residential real estate sector will contribute an additional approximately R2,750 million in direct economic activity in South Africa during 2014 over and above the activity that is already taking place. In addition to this, the direct impact will also cause indirect and induced impacts, causing these to increase economic activity created by the sector to R5,093 million and R7,809 million respectively. In line with this, the contribution to GDP will be R2,161 million through direct activity, R2,367 million through indirect activity and R3,670 million by induced activity. This will also result in a total of 13,065 new jobs being created, which are made up by 10,421 formal jobs and 2,644 informal jobs being created as per Figure 27. The sector will also contribute an additionally estimated R20,800,000 in net taxes, made up of Rl,400,000 net taxes on products and Rl9,300,000 net taxes on production as displayed in Figure 28.
a) Influence on economic activity
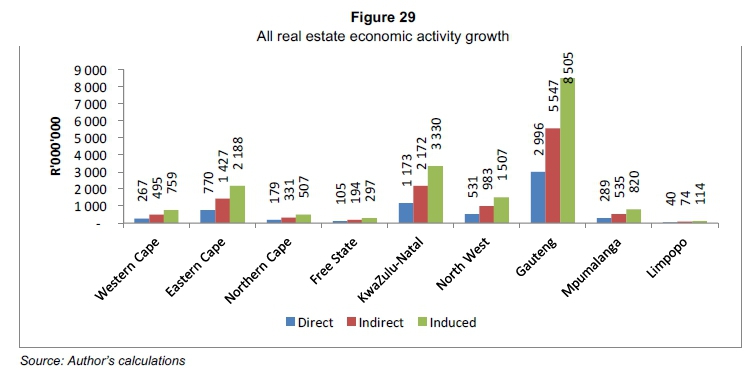
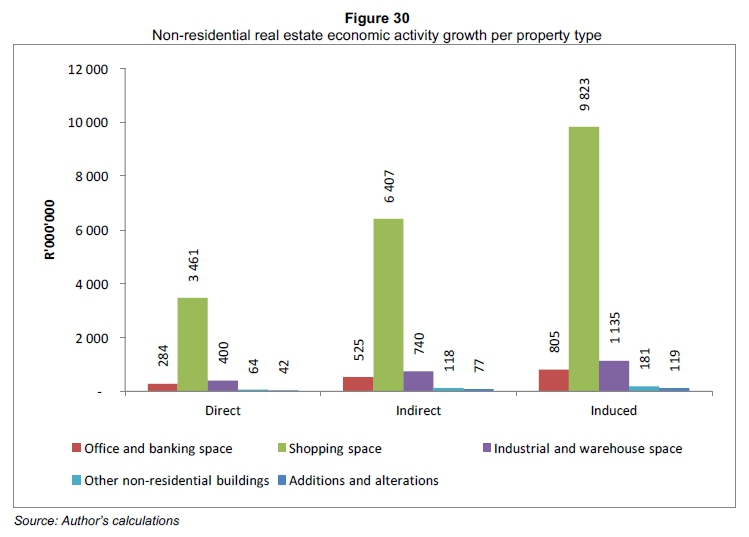
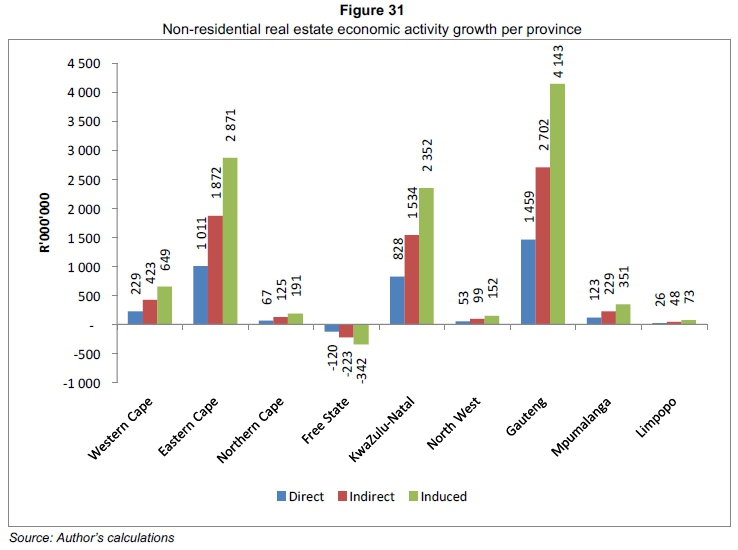
The total growth in economic activity to be generated by the real estate sector as estimated per province is indicated in Figure 29. For the non-residential real estate sector, this is then shown nationally per property type in Figure 30 and for all non-residential property per province in Figure 31.
It is clear that Gauteng dominates the expected economic growth in all real estate, while KwaZulu-Natal is estimated to contribute the second highest level of growth in economic activity, followed by the Western Cape. In terms of non-residential real estate, KwaZulu-Natal is expected to fall slightly behind the Western Cape, indicating that the expected activity in KwaZulu-Natal is expected to be focussed more on the residential side, while the Western Cape's figure for nonresidential real estate is higher than total real estate growth expected, suggesting a decline in residential real estate activity in that province. The Free State has the opposite, with a negative growth in the non-residential real estate sector, while the total is positive, indicating a possible larger expansion in the residential real estate sector.
In terms of property types, it can be seen in Figure 30 that growth is largely dominated by shopping centre development, followed by industrial and warehouse properties, then office and banking properties.
b) Influence on gross domestic product
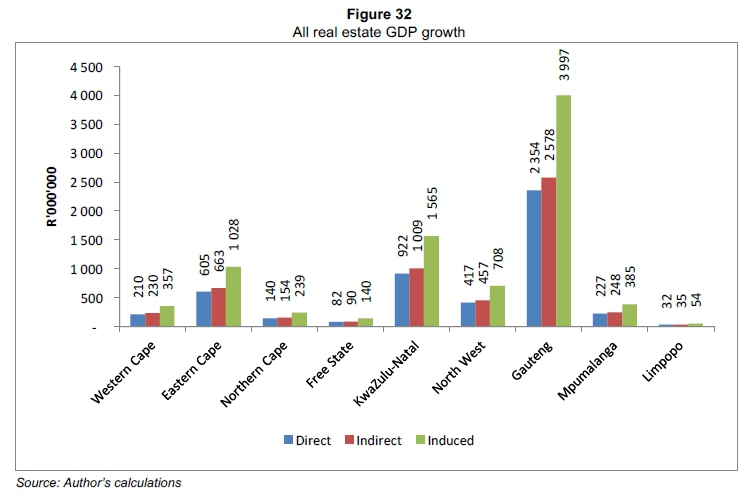
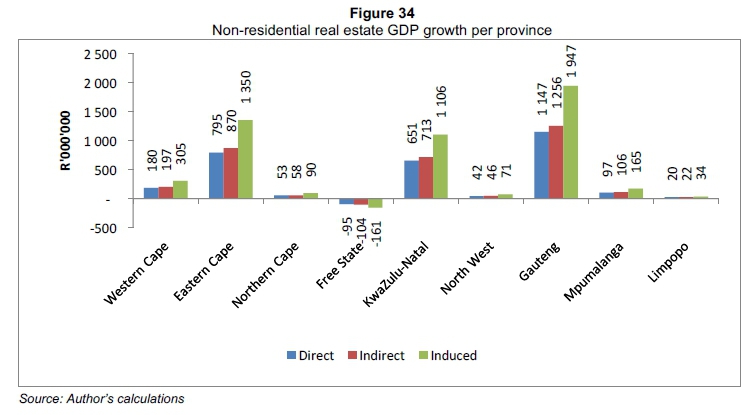
The growth in GDP is directly related to the growth in economic activity, although the scale differs. The result is, however, a different contribution to the GDP of the country. In line with economic activity, the GDP growth for which the real estate sector will be responsible, as estimated per province, is indicated in Figure 32. The non-residential sector's growth is then shown per property type nationally in Figure 33 and for all property per province in Figure 34.
c) Employment to be created
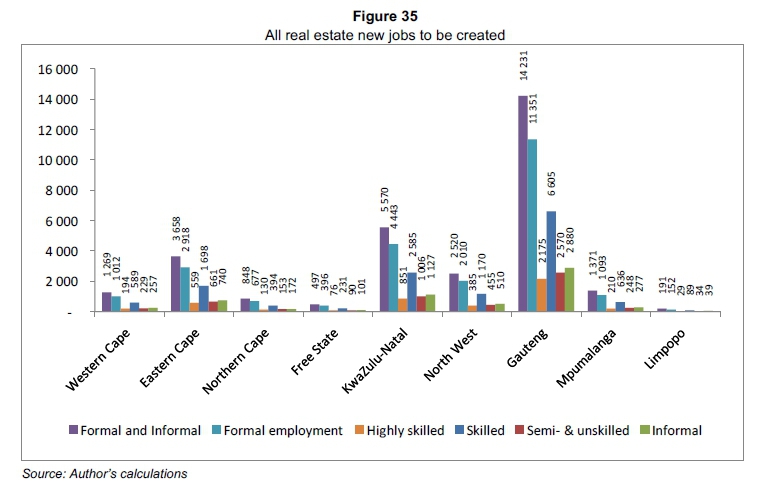
The growth in economic activity and resultant GDP growth will also create new jobs within the sector, directly as well as indirectly. The total number of new jobs to be created in the nonresidential real estate sector due to planned activity is estimated to be in excess of 13,000 as shown at the beginning of this section. The total number of real estate jobs to be created is estimated as per Figure 35, shown per province.
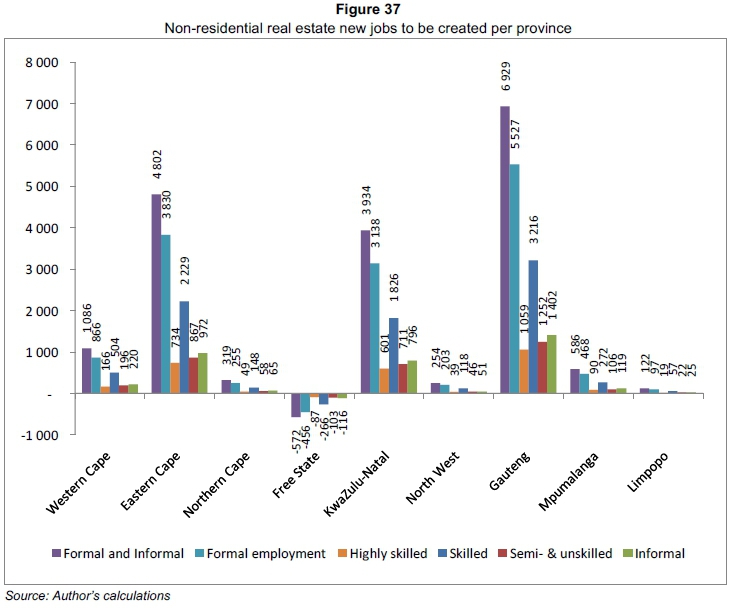
The new jobs to be created due to non-residential real estate activity is indicated in Figure 36, as distributed per property type, while Figure 37 shows the results for the different provinces.
d) Net taxes to be generated
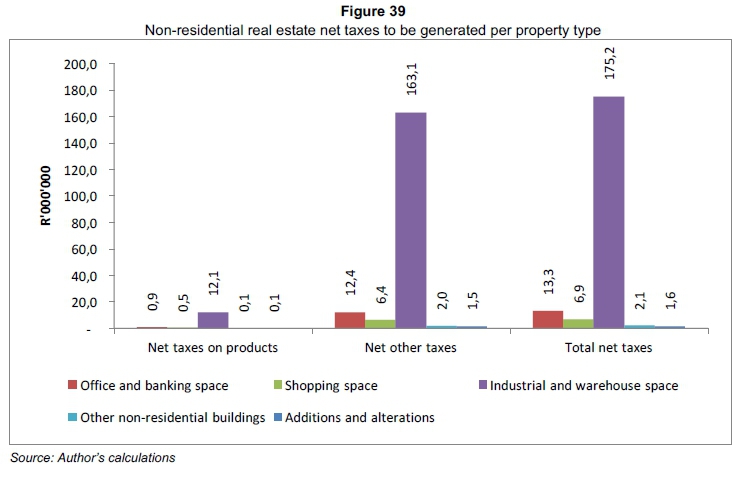
Last to be considered are the net taxes to be generated by the sector. Figure 38 shows net taxes to be generated throughout the sector, while the non-residential real estate net taxes are shown in Figure 39 per properly type and in Figure 40 per province.
7 Summary
In this study it was shown that the real estate sector has a marked influence on the economy in South Africa. The theoretical principles as explained in space and capital market theory were taken into consideration, but there is still a vast amount of research that could be performed empirically explaining the different relationships as mentioned at any given point in time, over different time periods, or in different economic climates. The essence of this study was to provide a view on the ability of I-0 analysis to calculate the total activity that is taking place in the real estate sector and how this then feeds into the total economy and contributes to economic activity and job creation. It is shown that property activity has a two-way causality in that it is influenced by the economy, but in itself also adds to the economic activity in the country. This validation allowed to use I-0 analysis to estimate the short-term future activity that will take place within the sector and the subsequent impact that it would have on the total economy of South Africa. The implication of this is that economic activity could be stimulated by property activity and supports principles of supply-side economics and wealth effects of property in the economy, among others. These concepts and the interdependencies within the economic system need to be further researched.
Acknowledgement
It is hereby acknowledged that this paper is based on research funded by the South African Property Association (SAPOA).
References
ARCHER, W.R. & LING, D.C. 1997. The three dimensions of real estate markets: Linking space, capital, and property markets. Real Estate Finance, 14:7-14. [ Links ]
ARCHOUR-FISCHER, D. 1999. An integrated property market model: A pedagogical tool. Journal of Real Estate Practice and Education, 2(1). [ Links ]
BOSHOFF, D.G.B. 2010. The impact of affordability on house price dynamics in South Africa. Acta Structillia, 17(2):126-148. [ Links ]
BOSHOFF, D.G.B. 2013. Empirical analysis of space and capital markets in South Africa - A review of the REEFM- and FDW models. South African Journal of Economic and Management Sciences, 16(4). [ Links ]
D'HERNONCOURT, J., CORDIER, M. & HADLEY, D. 2011. Input-output multipliers -Specification sheet and supporting material. Spicosa Project Report. UniversiteLibre de Bruxelles. CEESE, Brussels. [ Links ]
DIPASQUALE, D. & WHEATON, W.C. 1992. The markets for real estate assets & space: A conceptual framework. Journal of the American Real Estate and Urban Economics Association, 20(1):187-97. [ Links ]
DU TOIT, H. 2002. Appraisal of the Fischer-DiPasquale-Wheaton (FDW) real estate model and development of an integrated asset market model (IPAMM). Unpublished treatise submitted in part fulfilment of the requirements for the MSc (Real Estate), University of Pretoria. [ Links ]
FISHER, J.D. 1992. Integrating research on markets for space and capital. Journal of Real Estate and Urban Economics Association, 20(1):161-80. [ Links ]
FISHER, J.D., HUDSON-WILSON, S. & WURTZEBACH, C.H. 1993. Equilibrium in commercial real estate markets: Linking space and capital markets. Journal of Portfolio Management, 19:101-107. [ Links ]
ORGANISATION FOR ECONOMIC CO-OPERATION AND DEVELOPMENT (OECD). 2006. Input-output analysis in an increasingly globalised world: Applications of OECD's harmonized international tables. STI/Working Paper 2006/7. OECD. [ Links ]
SOUTH AFRICAN RESERVE BANK. 2014. Online statistical queries. https://www.resbank.co.za/Research/Statistics/Pages/OnlineDownloadFacility.aspx [accessed February to June 2014. [ Links ] ]
SPORRI, C., MORSUK, M., PETERS, I. & REICHERT, P. 2007. The economic impacts of river rehabilitation: A regional input-output analysis. Ecological Economics, 62(2007):341-351. [ Links ]
STATISTICS SOUTH AFRICA. 2015a. Quarterly labour force survey, Quarter 3 2015. Statistical release P0211, October 2015. xxipp. [ Links ]
STATISTICS SOUTH AFRICA. 2015b. Input-output tables for South Africa, 2012. Report 04-04-02, March 2015. [ Links ]
STATISTICS SOUTH AFRICA. 2013a. Quarterly employment statistics. Statistical release P0277, December 2013. 38pp. [ Links ]
STATISTICS SOUTH AFRICA. 2013b. Selected building statistics of the private sector as reported by local government institutions. Statistical release P5041.1, December 2013. 43pp. [ Links ]
SURUGIU, G. 2009. The economic impact of tourism: An input-output analysis. Romanian Journal of Economics. Institute of National Economy, 29(2):142-16. [ Links ]
VIEZER, T.W. 1998. Statistical strategies for real estate portfolio diversification. Doctoral Dissertation, Ohio State University, Columbus, OH. [ Links ]
VIEZER, T.W. 1999. Econometric integration of real estate's space and capital markets. Journal of Real Estate Research, 18(3):503-19. [ Links ]
Accepted: October 2016

