


Services on Demand
Article
 English (pdf)
 Article in xml format
 Article references
Indicators

Related links
-
 Cited by Google
 -
 Similars in Google
Share

 Permalink
South African Journal of Economic and Management Sciences
On-line version ISSN 2222-3436
Print version ISSN 1015-8812
S. Afr. j. econ. manag. sci. vol.19 n.4 Pretoria 2016
http://dx.doi.org/10.17159/2222-3436/2016/v19n4a10
ARTICLES
A nutritional goods and a complete consumer demand system estimation for South Africa using actual price data
Marius Louis van Oordt
African Tax Institute, University of Pretoria
ABSTRACT
Empirical analysis of South African indirect tax policy reform and the welfare consequences of such reform has been limited by a lack of reliable consumer demand system estimations. One reason for potentially unreliable demand estimations is not using actual price data in estimation. In this paper, the results of a nutritional goods demand system estimation and a complete demand system estimation are reported. Both systems were estimated with the use of the quadratic almost ideal demand system (QUAIDS) model incorporating demographic variables and using actual price and expenditure data. Subsequent to estimations, expenditure, own and cross-price elasticities of demand were calculated for both demand systems. The coefficients estimated provided largely statistical significant results and all elasticities calculated seem plausible in sign and magnitude.
Key words: quadratic almost ideal demand system, indirect tax, elasticities
JEL: D12, 63
1 Introduction
Despite relatively strong economic growth in recent times, many African countries are faced with several challenges, including high unemployment, poverty and income inequality, food insecurity, and a lack of economic transformation (United Nations, 2014). Further, sustained development for African countries will require additional publicly financed investments, but, unfortunately, most government budgets do not allow for these investments (Cnossen, 2015). Owing to the decrease in aid from developed countries, decreases in taxes on imports and exports, uncertain future foreign investment and generally high levels of debt, African countries will have to look to increasing domestic tax revenues for sustained development (African Economic Outlook, 2010; Cnossen, 2015).
Africa's economic growth has also benefited South Africa (Lipton, 2013), which faces similar challenges. With a Gini coefficient of 0.65, South Africa has the highest level of income inequality in the world (World Bank, 2015).1 The level of income inequality also appears to be on an upward trend, being measured at 0.56 in 1995, 0.57 in 2000, 0.63 in 2009 and 0.65 in 2012 (World Bank, 2015). Besides income inequality, South Africa has the sixth-highest unemployment rate in the world, a population of which less than half the inhabitants are food-secure, and an education system ranked 146 out of 148 countries considered (World Bank, 2015; South African National Health and Nutrition Examination Survey, 2012; EFA Global Monitoring Report, 2010). If South Africa were to address these challenges (as mentioned in the objectives of the government's National Development Plan 2030), additional domestic tax revenues would be required (Davis Tax Committee, 2014).
South Africa may well consider reform of indirect taxes, especially the value-added tax, but such reform should be coupled with empirical analysis of welfare consequences (Davis Tax Committee, 2014; Ebrill, Keen, Bodin & Summers, 2001). A key determinant of the accuracy of such an empirical analysis is accurate measures of individual (or household) consumer behavioural changes in relation to a change in indirect tax policy (Banks, Blundell & Lewbel, 1997). These behavioural changes can be estimated with the use of a consumer demand model.
Models that have been proposed in estimating demand systems include the linear expenditure system (see Stone, 1954), the Rotterdam model (see Theil, 1965), the translog model (see Christensen, Jorgenson & Lau, 1975), the almost ideal demand system (see Deaton & Muellbauer, 1980a), the CBS demand system (see Keller & Van Driel, 1985), and, more recently, the quadratic almost ideal demand system (see Banks et.al, 1997). Although the use of each of these models for demand system estimation has received attention in the literature, in recent years most demand systems have been estimated by either a linear approximated form of the almost ideal demand system (LA/AIDS) (Deaton & Muellbauer, 1980a), the almost ideal demand system (AIDS) or the quadratic almost ideal demand system (QUAIDS).
Within the South African context, demand system estimation has received some attention in the literature. Contributions include those of Alderman and Del Ninno (1999) as well as Dune and Edkins (2008), who applied the AIDS model in estimating the demand for different food groups. Also estimating the demand for food, Agbola (2003) applied the LA/AIDS model, while Bopape and Myers (2007) applied the QUAIDS model (only for demand in KwaZulu-Natal). Selvanathan and Selvanathan (2004) estimated a complete consumer demand system by way of a comparison between the CBS demand system and the AIDS model.2
However, the surveys on household expenditure used for previous estimations of demand in South Africa did not record price data. Although it was mentioned by Bopape and Myers (2007) that the KwaZulu-Natal Income Dynamics Survey included price data, closer inspection of this data set revealed no recorded prices. The Living Standards and Development Survey used by Alderman and Del Ninno (1999) required households to record either total expenditure or quantity purchased. In the case where a household reported both, an indication of market price can be obtained, although this could also be an indication of quality of the good purchased (Deaton, 1987). Other recent surveys include the National Income Dynamics Study and the Income and Expenditure Survey of Households of South Africa. Both of these data sets only recorded expenditures.
In this paper, the results of two demand estimations with the use of the QUAIDS model are reported. The first estimation is a complete demand system estimation of all goods and services supplied in South Africa (grouped into eight categories). The second estimation is a nutritional goods demand system estimation of all food and drink supplied in South Africa (grouped into five food groups). Expenditure, own and cross-price elasticities of demand are also calculated for both demand systems.
The research reported contributes to the previous literature on demand estimation for South Africa, as no previous estimation of demand in South Africa has used actual price data. Further, the QUAIDS model has not been previously applied to all goods and services or all food groups in South Africa. This is a contribution in its own right, since, as is shown in this paper and by Bopape and Myers (2007), South African household expenditure is non-linear and only the QUAIDS model (of the previously mentioned models) provides for non-linearity. As noted by Blundell and Robin (1999:209):
It is not reasonable to assume linearity of expenditures in terms of total budget and relative prices; even the log linear expenditure share models that form the underlying shape of the popular Translog and Almost Ideal models of Jorgenson, Christensen and Lau ... and Deaton and Muellbauer ... respectively have been shown to require further non-linear terms. These terms reflect the growing evidence from a series of recent empirical studies that suggest quadratic logarithmic income terms are required for certain expenditure share equations... .
The research reported in this paper also distinguishes itself from most of the previously mentioned studies by incorporating demographic variables.3 Lastly, when considering the previous use of the QUAIDS model by Bopape and Myers (2007) for KwaZulu-Natal, the research conducted for the present study provides a larger number of statistically significant results.
In the remainder of this paper the AIDS model and, as an extension thereof, the QUAIDS model are described. Next, the data used for estimation are discussed, followed by a discussion on determining the demand systems' categories, groups, and category and group prices. Thereafter, the empirical results of the research conducted are provided and discussed. The conclusion then follows.
2 The AIDS and QUAIDS models
The AIDS model proposed by Deaton and Muellbauer (1980a) builds on the Rotterdam and translog models, with advantages over these two models. The AIDS model gives an arbitrary firstorder approximation to any demand system; it satisfies the axioms of choice exactly; it aggregates perfectly over consumers without invoking parallel linear Engel curves; it has a functional form which is consistent with known household-budget data; it is simple to estimate, largely avoiding the need for non-linear estimation; and it can be used to test the restrictions of homogeneity and symmetry through linear restrictions on fixed parameters (Deaton & Muellbauer, 1980(a):312) The AIDS model has also been shown to perform well when estimating known elasticities (Barnett & Seck, 2008).
As with most demand systems, the AIDS model is specified with household budget shares (Wj) as the dependent variable, with the budget share for good t defined as

where pi is the price paid for commodity i, qi; is the quantity of commodity i purchased, and m is the total expenditure on all commodities in the demand system. The AIDS model in budget shares form follows:
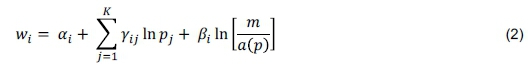
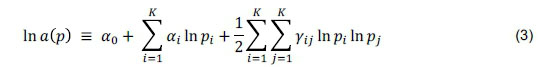
where pjis the price of commodity j and a(p) is a price index used to deflate total expenditure, defined as
For the model to adhere to consumer demand theory, adding up conditions requires that
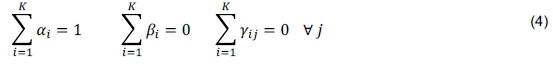
Homogeneity conditions require that
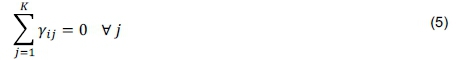
Lastly, Slutsky's symmetry implies that

The consumer demand theory conditions in notation (4), (5) and (6) are imposed during estimation and ensure that notation (3) defines a(p) as a linearly homogeneous function of the individual prices. Further, where notation (4), (5) and (6) hold, notation (2) provides a system of demand functions which add up to total expenditure (Σ Wi = 1), are homogeneous of degree zero in prices and total expenditure, and adhere to the Slutsky symmetry theory (Deaton & Muellbauer, 1980b). The AIDS model can, therefore, be interpreted as follows: if relative prices (pj) and "real" expenditure  do not change, the expenditure shares (Wi) are constant (ai).
As an extension to the AIDS model, the QUAIDS model proposed by Banks et al. (1997) adds a quadratic term in the logarithm of expenditure. This allows for household expenditure share Engel curves that are non-linear and thereby permit commodities to be necessities at some expenditure level and luxuries at others (Banks et al., 1997).
The QUAIDS model in budget shares form follows:
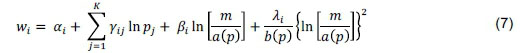
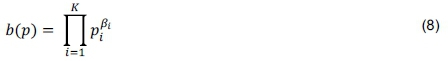
Where all terms are as in (2) and b(p) is the simple Cobb-Douglas price aggregator, defined as
To adhere to consumer demand theory, an additional adding-up condition is required, given as
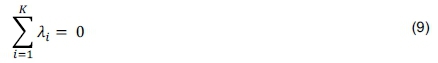
From the above it is evident that the QUAIDS model will be equal to the AIDS model when all the λ's are zero across all equations. Statistical-significance testing of the λ's would, therefore, indicate whether or not the QUAIDS model is preferable to the AIDS model for the data considered (i.e. whether household expenditures are linear or non-linear).
For purposes of the research reported in this paper, a set of demographic variables is added for each household using Ray's (1983) method based on an expenditure (cost) function of the form

where z represents a vector of s household characteristics, eR(p, u) is the expenditure function of a reference household, and m0(p,z,u) scales the expenditure function to account for household characteristics and can be decomposed as

where  measures the increase in a household's expenditures as a function of z, and Ø controls for changes in relative prices and the actual goods consumed. Further,
  is parameterised as

where ρ is a vector of parameters to be estimated. Ø(ρ, z, u) is parameterised as
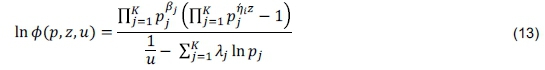
where ηjrepresents the jth column of sxk parameter matrix η. To adhere to consumer demand theory, a further adding-up condition is required, given as
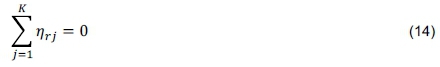
for r = 1,..., s. The QUAIDS model for purposes of estimation takes the form

where
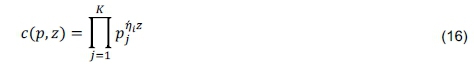
Similar to the AIDS model, where the consumer demand theory conditions in notation (4), (5), (6), (9) and (14) hold (which are imposed during estimation), notation (15) provides a system of demand functions which add up to total expenditure (Σ wi; = 1), are homogeneous of degree zero in prices and total expenditure, and adhere to the Slutsky symmetry theory.
Subsequent to estimation of the QUAIDS model, the coefficients obtained can be used to calculate price and expenditure elasticities of the commodities. The uncompensated price elasticity of good t with respect to changes in the price of good j is calculated as
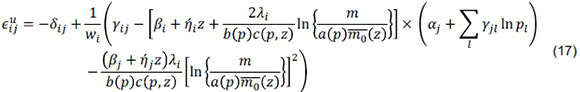
where δij is the Kronecker delta taking the value of δij = 1 if i = j and δij = 0 if i ≠ j. The expenditure elasticity for good t is calculated as

By invoking the Slutksy equation, the compensated price elasticities are calculated as

Notations (1) to (6) are borrowed directly from Deaton and Muellbauer (1980a), and notations (7) to (19) are borrowed from Poi (2012) with reference to Banks et al. (1997).
3 Data used for estimation
3.1 Data used for budget share and demographic variables
Data on budget share and demographic variables used for purposes of estimating the QUAIDS model in notation (15) were obtained from the 2010/2011 Income and Expenditure Survey of Households (IES 2010/2011) of South Africa. This survey was conducted by Statistics South Africa and used three data-collection instruments: a household questionnaire, a weekly diary and a summary questionnaire (Statistics South Africa, 2012).
The household questionnaire consisted of four modules. The first module recorded a variety of demographic variables in respect of each household. The second to fourth modules collected information on different categories of expenditure covering education, health, dwellings and services, clothing, footwear, expenditure when away from home, domestic workers, furniture and equipment, transport, computers, telecommunications, finance and banking, as well as particulars of income (Statistics South Africa, 2012).
The weekly diary (completed for two weeks by each household) consisted of a booklet wherein households recorded their daily expenditures, where they incurred these expenditures, and the purpose of the expenditure (e.g. own consumption or a gift). The summary questionnaire consisted of questions that were only used by the interviewer. The purpose of this questionnaire was to assign consumption according to purpose (COICOP) codes to the weekly diary expenditures of household, and to ensure accuracy and completeness of the diary (Statistics South Africa, 2012).
The survey was conducted over a period of one year, with each household being in the sample for a period of four weeks. The sampling frame was obtained from Statistics South Africa's Master Sample, which provides a national coverage of all households in South Africa, excluding certain institutions (e.g. prisons). Although an initial sample of 33 420 households was identified, only 82.8 per cent were in scope and, of these households, the overall response rate was 91.6 per cent (Statistics South Africa, 2012).
The IES 2010/2011 was preferred for the purposes of this paper, as it is the largest recent survey of its kind for South Africa. It is also the only large survey in South Africa that attempts to capture all consumption expenditure by households. It appears that an appropriate methodology was followed in obtaining the data and that the data is representative of the population of South Africa.
3.2 Data used for prices
As previously mentioned, the IES 2010/2011 (as well as any other large sample data set currently collected in South Africa) does not include price or quantity purchase data, but only expenditure data. This is a limitation as far as consumer demand estimation in South Africa is concerned, a limitation that also applies to the research reported on in this paper. It was therefore necessary to calculate the prices faced by households from another data set, of which the best data set available is the data set on prices collected by Statistics South Africa and predominantly used in calculating the South African Consumer Price Index (herein after referred to as "the CPI data set").
The CPI data set is not publicly available, but application can be made to Statistics South Africa to obtain it. The CPI data set is obtained by way of field-based and head office collections (Statistics South Africa, 2013). Field-based collection entails the use of fieldworkers who record actual prices at sample outlets (enumerator method of collection). This collection is carried out monthly and mostly includes prices of goods, although some prices for services are also included. Head office collections makes use of staff based at the Statistics South Africa head office and mostly involve the collection of prices of services by means of telephone, Internet, e-mail or other similar methods. These collections are done monthly for certain services and at other intervals for other services (Statistics South Africa, 2013). For purposes of the CPI data set, prices for a specific good or service (e.g. one litre of full-cream, long-life milk) collected in more than one municipal area are averaged for each of the nine provinces in South Africa (i.e. the data set show price per month and per province in respect of a specific good or service).
4 Determining demand systems' categories, groups, and category and group price
4.1 Demand system categories and groups
In utility maximisation theory, a consumer or household allocates its budget to all goods taking into account the price of a specific good, the price of all other goods, and its own income (Varian, 2010). Owing to the complexity of empirically analysing the budget allocation of each consumer on all goods, these goods are mostly grouped into larger commodity groups. This approach also decreases issues with multicollinearity between prices.
One of two approaches are generally applied in grouping commodities. The first is the generalised composite commodity theorem (Hicks, 1936; Lewbel, 1996) that treats goods in respect of which prices increase or decrease similarly as a single good. Owing to relative prices fluctuating considerably in practice, the composite commodity theorem's usefulness is limited for the purpose of empirical analysis (Deaton & Muellbauer, 1980b). The second approach is that of separability, according to which commodities are grouped in accordance with consumer preferences. Commodities are grouped so that "preferences within a group can be described independently of the quantities in other groups" (Deaton & Muellbauer, 1980b:122). If preferences for specific goods are weakly separable, those commodities are grouped together.
Although weak separability can be tested empirically, these tests are largely limited to time series data and were not used for the purposes of this paper. Further, multicollinearity in aggregate price data limits the usefulness of these tests (Bopape & Myers, 2007). Weak separability is, therefore, commonly assumed and is also assumed for the purposes of this paper. This means that it is assumed that sub-utility functions can be defined for each group of commodities so that the sum of the value of each of these sub-utilities will give total utility.
A general problem in estimating demand systems is observed zero expenditures on categories or groups of goods. Such zero expenditure categories or groups result in inaccurate estimated coefficients and deleting households with zero expenditure categories will be subject to selection bias. Certain methods have been proposed to address the observed zero expenditure problem when establishing the market demand (for a recent example, refer to Shonkwiler & Yen, 1999), but these methods are not employed. Although the market demand is estimated and provided in the results of this paper, it is the objective of this paper to estimate the demand of individual households (since it is household behaviour towards changes in indirect tax policy that is of interest).
To address the zero expenditure problem, households with zero total expenditure on all goods and services were removed from the data set. Households with zero expenditure on food were also removed from the data set. This approach seems reasonable, since it could be expected that a household has some expenditures during the survey period. Further, as shown to be acceptable by Blundell and Robin (2000), certain weakly separable groups of commodities (transport and communication; and edible oils and other nutritional goods) which contained observed zero expenditures were grouped together. These three strategies that have been mentioned greatly decreased the amount of observed zero expenditures, but it should be noted that this paper is limited by some zero expenditures that remained in the sample. To avoid selection bias, further strategies were not employed.
Following the assumption of weak separability in grouping commodities and also addressing the problem of observed zero expenditures, for purposes of the complete demand system the 899 COICOP items in the IES 2010/2011 were grouped into eight expenditure categories. The expenditure categories are: nutritional goods; clothing; housing and utilities; household contents; health; transport and communication; recreation (including dining at restaurants); and other goods and services (these include mainly luxury items and other items not previously listed).
Similarly, for purposes of the nutritional goods demand system, the 288 food items in the IES 2010/2011 were grouped into five nutritional goods groups. The five nutritional goods groups are: grains, bread and cereals; meat and fish; dairy; fruit and vegetables; and other nutritional goods (these include sugars and sweets, edible oils and non-alcoholic beverages).
The two demand systems allow for the estimation of a two-stage budgeting process followed by households concerning nutritional goods expenditures. Closely related to the concept of a utility tree, as proposed by Strotz (1957), two-stage budgeting is based on the premises that consumers first allocate their expenditure to broad groups of goods (or, in the present case, expenditure categories) and thereafter allocate the expenditure on that group of goods to the goods in that group (in the present case, the nutritional goods groups). Consumer behaviour as a result of changes to indirect tax policy applicable to foodstuffs can, therefore, be particularly accurately measured.
4.2 Category and group prices
Calculating representative prices for each of the eight expenditure categories and five nutritional goods groups is a methodologically tedious task (predominantly since code can likely not be written to simplify this task). The CPI data set includes prices for 830 different goods and services for each month and in each of the nine provinces of South Africa. As previously indicated, prices are not provided for categories of goods (e.g. milk), but rather for specific goods (e.g. one litre of long-life, full-cream milk; one litre of fresh full-cream milk; 500 millilitres of long-life, full-cream milk - and the same for low-fat milk, etc.). The physical weight of edible goods is also provided. The manner in which the data are collected improves the accuracy of prices, since they are not dependent on changes in quality. However, it also increases the methodological burden of calculating group prices.
The first methodological issue is that, for some provinces, data is not consistently collected for all goods and services. This limits the amount of goods and services that can be included for each province, since the representative price should be consistently determined for each province. To overcome this issue, only prices and goods and services that were included for each province were used. In only a few instances where a price was not available for a single month in a single province, the provincial consumer price index and the price during the previous month were referred to in estimating a representative price for that month.
Another methodological issue is the physical measurement used when calculating prices. For instance, when calculating the representative price for hake, fresh hake may be given as price per kilogram, but frozen hake is sold per box and weighs 500 grams. To address this issue, the average price that a consumer can be expected to face in deciding whether to spend on an item, was calculated. This was done by calculating an average price based on the average weight at which goods are bought. This approach was followed, as it would make little sense to determine the price of, for instance, eye drops per litre (which would cost approximately R2 466) when this is not the price faced by consumers in deciding whether to purchase eye drops.
A further methodological issue is that a consumer is unlikely to give equal consideration to each good and service in an expenditure category or food group. It stands to reason that goods and services on which more is spent by the average consumer should carry a greater weight towards the expenditure category or nutritional goods group price. Not doing so would, for instance, give equal weight to beef mince (which is purchased often) and pork fillet (which is generally purchased less). Some expensive goods, such as biltong (which is similar to beef jerky), will also drive the representative price of a category or group up, although few households can afford this good. To address this issue, expenditure weights were obtained from Statistics South Africa.
The expenditure weights are used by Statistics South Africa for the purpose of determining the prices of the provincial consumer price indexes. The weights are calculated based on household expenditure in the IES 2010/2011 data set (the same data set as used to obtain household expenditures for the estimations in this paper). Weights are calculated based on COICOP codes and are provided for each sub-subcategory (e.g. fish), subcategory (e.g. meat and fish) and category (e.g. foods) of goods. These weights were then applied to the representative prices for each sub-subcategory, subcategory and category of expenditure items.
For a few services (e.g. electricity, household rent), prices are not provided in the CPI data set. All of these services are services which are typically only paid for once during a month. To align with the method used in calculating a representative price for goods and services in the CPI data set, the representative price for these services was calculated as the average expenditure of households in a specific month in a specific province. This method is, therefore, also an approximation of the average price faced by households.
The resulting 117 prices per expenditure category and food group were matched with the relevant households based on month surveyed and the province in which the household is located.4
5 Empirical results
5.1 Results pertaining to the complete demand system
The parameters of the QUAIDS model were estimated in Stata 12 by way of iterated, feasible, generalised non-linear least-squares estimation, with the theoretical restrictions of adding up, homogeneity and symmetry imposed during estimation. This method aims to address heteroscedasticity in the residuals while adhering to economic theory. Although there exists some multicollinearity between prices of commodity groups, this should only influence the standard errors of the estimates, resulting in less significant estimates.
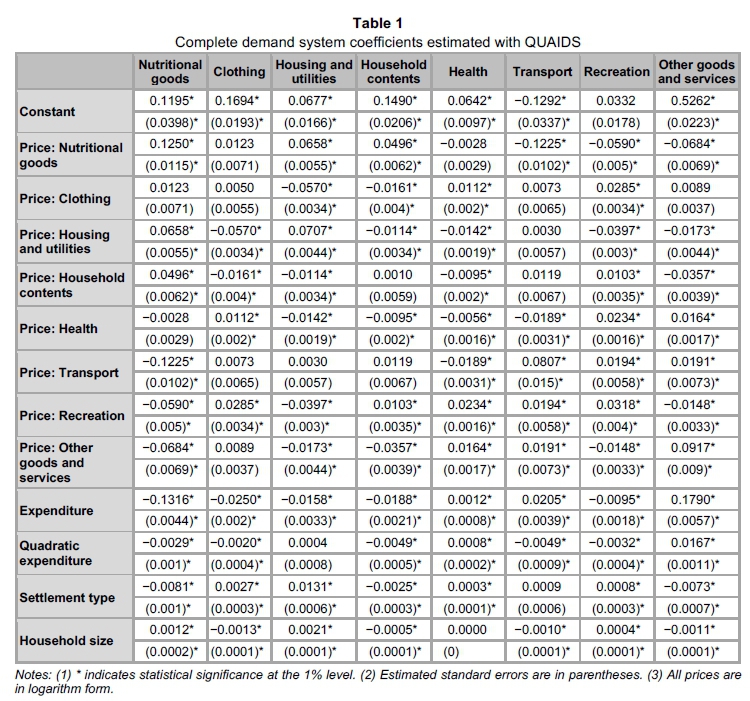
Table 1 provides the coefficients estimated for the complete demand system, with 86 of the 104 coefficients estimated being statistically significant at the 1 per cent level of significance.
In determining whether the QUAIDS model is preferable to the AIDS model for the data set, the quadratic expenditure term is relevant. As is evident from Table 1, the quadratic expenditure terms (A's) are all significant at the 1 per cent level, except in the case of housing and utilities.
Consequently, a Wald's test was performed to determine whether the sum of the quadratic expenditure coefficients is significantly different from zero. This test statistic is 373.42 (p-value = 0.0000). As it cannot be accepted that the quadratic expenditure terms are equal to zero, the QUAIDS model is preferred to the AIDS model for the data set. This means that South African total household expenditure is non-linear.
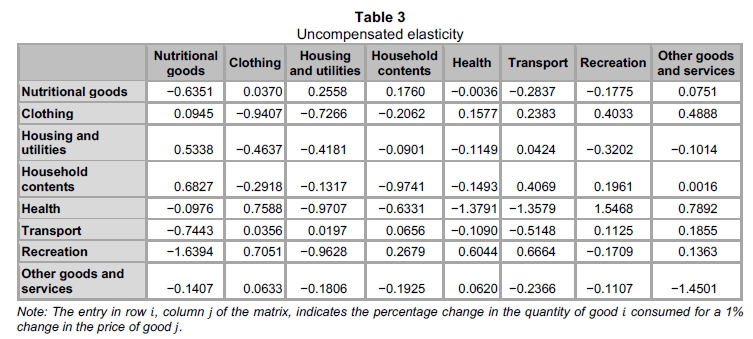
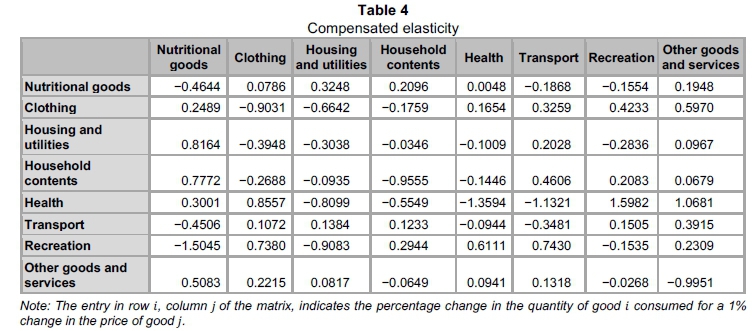
For empirical analysis of indirect tax reforms, expenditure and, in particular, own and cross-price elasticity of demand are of importance. It should be noted that the elasticities at the household level are required (and were calculated) for accurately estimating welfare consequences as a result of indirect tax reform. As it is not possible to provide the result for each household here, only the mean results (market demand) are reported here. Table 2 provides the expenditure elasticity for the expenditure categories, and Table 3 and Table 4 provide the uncompensated and compensated own and cross-price elasticity, respectively.
As is evident from Table 2, none of the expenditure categories' expenditure elasticities can be associated with inferior goods, as all expenditure elasticities are positive. All expenditure categories' expenditure elasticities are associated with normal goods, and health and other goods and services' expenditure elasticities are associated with luxury goods. It should be considered that the other goods and services expenditure category includes a large number of items which are generally deemed to be luxury goods. Regarding the view that health is a luxury item, it should be taken into account that most medicine and hospital fees are subsidised by the state through public hospitals, and that only 17 per cent of South African households (IES 2010/2011) are members of a medical aid fund. However, expenditure on health items is arguably expenditure that is not subsidised by the state and not covered by a medical aid. Most items that are generally considered to be luxury items are included in the other goods and services' expenditure category.
Economic theory requires that all own price elasticities are negative and this requirement is upheld, as is evident from the diagonal of Table 3. This means that, for expenditure categories in the complete consumer demand system, demand for a category will decrease if the price of that category increases. Further, the own price elasticities seems plausible in magnitude, with nutritional goods, housing and utilities, transport and communication, and, interestingly, recreation being relatively inelastic. Clothing, household contents, and other goods and services are relatively unit elastic and health is relatively elastic.
It seems reasonable that nutritional goods, housing and utilities, and transport and communication would have inelastic demand, since these goods can be argued to be necessities.
The finding that recreation expenditure is inelastic seems to suggest that, despite the increase in prices, consumers are slower to respond to the higher cost of recreation or are unwilling to decrease expenditures on recreational items. This result is similar to the results of Selvanathan and Selvanathan (2004), the only other study that could be found that also considers the demand for recreation (in totality) in South Africa. The finding that health is relatively elastic appears to align with the finding that health is a luxury item, as previously discussed.
The magnitude and patterns of cross-price elasticity evident from the off-diagonal of Table 3 and Table 4, indicating substitution and complementary expenditure categories, seem plausible. Many of the cross-price elasticities are close to zero, which would indicate that the two applicable expenditure categories are independent. A positive cross-price elasticity, as in the case of household contents and nutritional goods, indicates substitutes. Negative cross-price elasticities, as with recreation and nutritional goods, indicate complementarities (Varian, 2010).
5.2 Results pertaining to the nutritional goods demand system
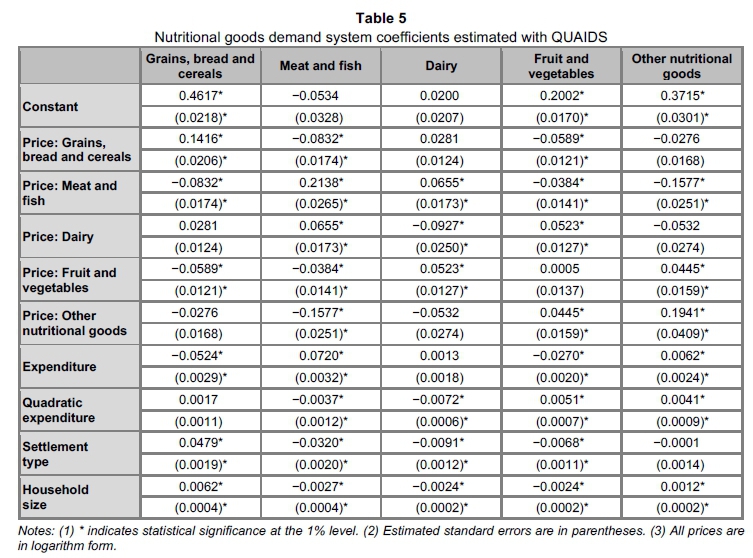
The same model (QUAIDS) and method as used for the estimation of the expenditure categories previously described were used in estimating the parameters for the five nutritional goods groups. These results, of which 38 of 50 of the estimated coefficients are significant at the 1 per cent level of significance, are provided in Table 5.
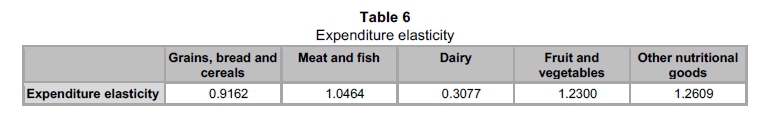
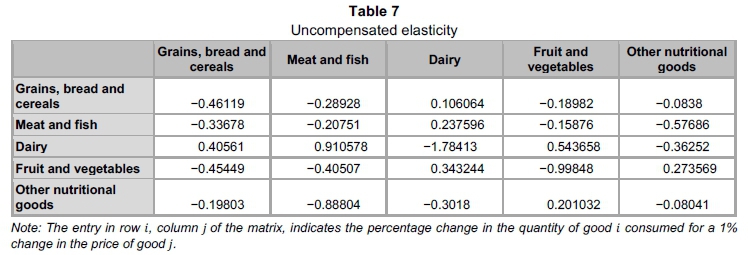
Subsequent to estimation, a Wald's test was performed to test whether the sum of the quadratic expenditure coefficients is significantly different from zero. This test statistic is 157.36 (p-value = 0.0000). The QUAIDS model is therefore also preferred for this estimation and South African households' nutritional goods expenditure is also non-linear. Similar to the above, Table 6, Table 7 and Table 8 provide expenditure, own and cross-price elasticity of demand for the food groups.
It is evident from Table 6 that all nutritional groups are normal goods. Grains, bread and cereals, together with dairy, are necessities. Meat and fish have an expenditure elasticity of 1 and can therefore be regarded as a necessity or a luxury good. Fruits and vegetables and other food are luxury goods. These results seems plausible when considering that a large portion of poor (income decile 5 or lower) South African households spend the majority of their nutritional goods budget on grains, bread and milk (IES 2010/2011). Meat and fish, fruit and vegetables, and other food are purchased more by wealthier households than poorer households (IES 2010/2011).
It is further evident (see Table 7) that all uncompensated own price elasticities are negative, as required by economic theory. This means that the demand for any nutritional-good groups will decrease if the price for that nutritional-good group increases. Grains, bread and cereals, meat and fish, and other nutritional goods (which include sugars and sweets, cooking oils, and non-alcoholic beverages) are inelastic. Fruit and vegetables are unit elastic and dairy is elastic. The finding that the demand for dairy is elastic, although being a necessity, appears contradictory. In interpreting this result, it should be considered that the dairy nutritional group contains items that can be regarded as luxury items (e.g. cheese). It is therefore suggested that further research may want to consider the individual demand for the items within the dairy nutritional-good group in order to obtain a better understanding of the demand dynamics within this group. The cross-price elasticities provided in Table 7 and Table 8 seem plausible in magnitude and sign.
6 Conclusion
South Africa is faced with a number of challenges which, in order to be addressed, may require additional tax revenues. In considering additional domestic tax revenues from indirect taxes, the South African government may do well to consider the welfare consequences as a result of a change in indirect tax policy. The results of the complete consumer demand system and a nutritional goods demand system reported in this paper form a necessary part of the base of an empirical analysis to determine such welfare consequences.
It was shown in this paper that South African household expenditure is non-linear. This supports Bopape and Myers' (2007) findings that the QUAIDS model is preferred when applied to South African household data. The QUAIDS model was therefore used to estimate the demand for eight expenditure categories and five food groups. This is the first study of multiple-good demand systems in South Africa that incorporates actual price data. Further, it is the only study of demand systems in South Africa that allows for a two-stage budgeting process by households.
The estimation of the complete consumer demand system provided largely significant statistical results, with 86 of the 104 coefficients estimated being significant at the 1 per cent level of significance. The calculated expenditure elasticities indicate that all goods in this demand system are normal goods. Nutritional goods, clothing, housing and utilities, household contents, transport and recreation are necessities. Health and other goods and services are luxury goods. The price elasticities calculated for this demand system indicate that the demand for nutritional goods, housing and utilities, and transport and communication are inelastic. The demand for clothing, household contents, and other goods and services is unit elastic and the demand for health is elastic.
The estimation of the nutritional goods groups also provided results that are largely statistically significant, with 38 of the 50 estimates significant at the 1 per cent level of significance. The calculated expenditure elasticities indicate that all food groups are normal goods. Grains, bread and cereals and dairy are necessities. Meat and fish can be regarded as either a necessity or a luxury good, and fruit and vegetables and other nutritional goods are luxuries. The calculated price elasticities indicate that the demand for grains, bread and cereals, meat and fish, and other nutritional goods are inelastic. Further, the demand for fruit and vegetables is unit elastic and the demand for dairy is elastic.
These results form part of a larger study of quantitative measurements of policy options to inform VAT reform in South Africa. 5 Apart from being used for purposes of this larger study, the estimated elasticities could be used by other researchers and government in the empirical analysis of policy changes. This may include policy on farmer subsidies, housing subsidies, food subsidies or increases in wealth (e.g. property taxes) and consumption taxes.
References
AFRICAN ECONOMIC OUTLOOK. 2010. https://sustainabledevelopment.un.org/content/documents/AEO2010_part1_p76.pdf [accessed June 2015]. [ Links ]
AGBOLA, F.W. 2003. Estimation of food demand patterns in South Africa based on a survey of households. Journal of Agricultural and Applied Economics, 35:663-670. [ Links ]
ALDERMAN, H. & DEL NINNO, C. 1999. Poverty issues for zero rating VAT in South Africa. Journal of African Economies, 8:182-208. [ Links ]
BANKS, J., BLUNDELL, R. & LEWBEL, A. 1997. Quadratic Engel curves and consumer demand. Review of Economics and Statistics, 79:527-539. [ Links ]
BARNETT, W.A. & SECK, O. 2008. Rotterdam model versus almost ideal demand system: Will the best specification please stand up? Journal of Applied Econometrics, 23:699-728. [ Links ]
BLUNDELL, R. & ROBIN, J.M. 1999. Estimation in large and disaggregated demand systems: An estimator for conditionally linear systems. Journal of Applied Econometrics, 14:209-232. [ Links ]
BLUNDELL, R. & ROBIN, J.M. 2000. Latent separability: Grouping goods without weak separability. Econometrica, 68(1):53-84. [ Links ]
BOPAPE, L. & MYERS, R. 2007. Analysis of household demand for food in South Africa: Model selection, expenditure endogeneity, and the influence of socio-demographic effects. Paper presented at the African Econometrics Society annual conference, Cape Town, South Africa, July. [ Links ]
CHRISTENSEN, L.R., JORGENSON, D.W. & LAU, L.J. 1975. Transcendental logarithmic utility functions. The American Economic Review, 367-383. [ Links ]
CNOSSEN, S. 2015. Mobilizing VAT revenues in African countries. International Tax and Public Finance, 22:1. [ Links ]
DAVIS TAX COMMITTEE. 2014. http://www.taxcom.org.za/docs/New_Folder/1%20DTC%20BEPS%20Interim%20Report%20-%20The%20Introductory%20Report.pdf [accessed June 2015]. [ Links ]
DEATON, A. 1987. Estimation of own- and cross-price elasticities from household survey data. Journal of Econometrics, 36:7-30. [ Links ]
DEATON, A. & MUELLBAUER, J. 1980a. An almost ideal demand system. The American Economic Review, 312-326. [ Links ]
DEATON, A. & MUELLBAUER, J. 1980b. Economics and consumer behaviour. Cambridge: Cambridge University Press. [ Links ]
DUNE, J.P. & EDKINS, B. 2008. The demand for food in South Africa. South African Journal of Economics, 76:104-117. [ Links ]
EBRILL, L., KEEN, M., BODIN, J.P. & SUMMERS, V. 2001. The modern VAT. Washington: International Monetary Fund. [ Links ]
EFA GLOBAL MONITORING REPORT. 2010. Reaching the marginalized. http://unesdoc.unesco.org/images/0018/001866/186606E.pdf [accessed August 2015]. [ Links ]
HICKS, J.R. 1936. Keynes' theory of employment. The Economic Journal, 46:238-253. [ Links ]
KELLER, W.J. & VAN DRIEL, J. 1985. Differential consumer demand systems. European Economic Review, 27(3):375-390. [ Links ]
LEWBEL, A. 1996. Aggregation without separability: A generalized composite commodity theorem. American Economic Review, 86(3):524-542. [ Links ]
LIPTON, D. 2013. South Africa: Facing the challenges of the global economy. https://www.imf.org/external/np/speeches/2013/050813.htm [accessed May 2015]. [ Links ]
NATIONAL DEVELOPMENT PLAN FOR 2030. http://www.gov.za/sites/files/Executive%20Summary-NDP%202030%20-%20Our%20future%20-%20make%20it%20work.pdf [accessed March 2014]. [ Links ]
POI, B.P. 2012. Easy demand-system estimation with QUAIDS. Stata Journal, 12:433-446. [ Links ]
RAY, R. 1983. Measuring the costs of children: An alternative approach. Journal of Public Economics, 22: 89-102. [ Links ]
SELVANATHAN, S. & SELVANATHAN, E.A. 2004. Empirical regularities in South African consumption patterns. Applied Economics, 36:2327-2333. [ Links ]
SHONKWILER, J.S. & YEN, S.T. 1999. Two-step estimation of a censored system of equations. American Journal of Agricultural Economics, 81:972-982. [ Links ]
SOUTH AFRICAN NATIONAL HEALTH AND NUTRITION EXAMINATION SURVEY. 2012. http://www.hsrc.ac.za/en/research-outputs/view/6493 [accessed May 2015]. [ Links ]
STATISTICS SOUTH AFRICA. 2012. Income and expenditure of households 2010/2011, Statistical release P0100. http://www.statssa.gov.za/Publications2/P0100/P01002011.pdf [accessed January 2014]. [ Links ]
STATISTICS SOUTH AFRICA. 2013. The South African CPI sources and methods manual (version 2). http://www.statssa.gov.za/CPI/documents/The%20South%20African%20CPI%20sources%20and%20methods%20-%2026Feb13.pdf [accessed June 2014]. [ Links ]
STONE, R. 1954. Linear expenditure systems and demand analysis: An application to the pattern of British demand. The Economic Journal, 511-527. [ Links ]
STROTZ, R.H. 1957. The empirical implications of a utility tree. Econometrica: Journal of the Econometric Society, 269-280. [ Links ]
TALJAARD, P.R., ALEMU, Z.G. & VAN SCHALKWYK, H.D. 2004. The demand for meat in South Africa: An almost ideal estimation. Agrekon, 43:430-443. [ Links ]
THEIL, H. 1965. The information approach to demand analysis. Econometrica: Journal of the Econometric Society, 67-87. [ Links ]
UNITED NATIONS. 2014. Economic development in Africa. http://unctad.org/en/PublicationsLibrary/aldcafrica2014_en.pdf [accessed May 2015]. [ Links ]
VAN SCHALKWYK, H.P., VAN SCHALKWYK, H.D., ALEMU, Z.G., TALJAARD, P.R. & OBI, A. 2005. The primary demand for oilseeds in South Africa: An error correction linear approximated almost ideal demand system. South African Journal of Economic and Management Sciences, 8:117-127. [ Links ]
VARIAN, H.R. 2010. Intermediate microeconomics: A modern approach. New York: W.W. Norton & Company. [ Links ]
WORLD BANK. 2015. http://data.worldbank.org/indicator/SI.POV.GINI?order=wbapi_data_value_2010+wbapi_data_value+wbapi_data_value-firstandsort=asc [accessed May 2015]. [ Links ]
Accepted: Augustus 2016
1 It should be noted that the data of the World Bank (2015) do not contain inequality measures for all countries.
2 Demand estimation of a single group of goods is not included here. Examples of such estimations are Taljaard, Alemu and Van Schalkwyk (2004), in estimating the demand for meat, and Van Schalkwyk, Van Schalkwyk, Alemu, Taljaard and Obi (2005), in estimating the demand for oilseeds. There are also a number of research papers on the demand for electricity in South Africa.
3 Agbola (2003) and Bopape and Myers (2007) also incorporate demographic variables into their models.
4 The prices used can be obtained by contacting the author at marius.vanoordt@up.ac.za.
5 This is a PhD study that was funded by the National Research Foundation and is publicly available from the University of Pretoria (UP Space).

