


Services on Demand
Article
 English (pdf)
 Article in xml format
 Article references
Indicators

Related links
-
 Cited by Google
 -
 Similars in Google
Share

 Permalink
South African Journal of Economic and Management Sciences
On-line version ISSN 2222-3436
Print version ISSN 1015-8812
S. Afr. j. econ. manag. sci. vol.19 n.4 Pretoria 2016
http://dx.doi.org/10.17159/2222-3436/2016/v19n4a8
ARTICLES
Users' corporate environmental information needs
Pieter Nasiema Kamala; Christa Wingard; Christo Cronjé
College of Accounting Sciences, University of South Africa
ABSTRACT
Most listed South African companies appear to have embarked on environmental reporting without enquiring what the users' needs are. If users' needs are not determined prior to reporting, it is unlikely that the resulting reports will meet those needs. Using a questionnaire, this study investigated the environmental information needs of South African users of environmental reports. The study was deemed necessary to unveil users' preferences which, if incorporated in reports, could enhance their perceived decision-usefulness, thus increasing readership. The results of the survey revealed that users need balanced environmental information that identifies and describes key, relevant issues and that is both specific and accurate. In addition, users need future-oriented information that identifies and addresses key stakeholders' concerns, and which demonstrates the integration of environmental issues into core business processes. Furthermore the information should be summarised in an integrated annual report and posted on a company's website. Based on its findings, this study recommends that standard setters and regulators should recognise that both financial and non-financial users need decision-useful environmental reports. Disclosure standards and regulations should therefore be amended to accommodate this reality.
Key words: environmental reports, users, relevance, reliability, verifiability, comparability, understandability, timeliness, conceptual framework
JEL: M4
1 Introduction
In response to the mounting public pressure for companies to account for their environmental performance, growing numbers have increased the volume and scope of their environmental reports (Jira & Toffel, 2013; Marquis & Toffel, 2014). However the number of environmental reports produced appears to have increased without regard to users' needs (Laud & Schepers, 2009).
Given the widespread lack of meaningful stakeholder engagement by companies, most appear to have embarked on environmental reporting without enquiring what the users require (De Villiers & Van Staden, 2008). Accordingly, the stakeholders have not influenced the content presented in the reports to suit their needs, an approach that has undermined the perceived relevance of the reports (Marquis & Toffel, 2014). Despite the advancements in information technology that can enable a company to tailor their environmental reports to suit the unique needs of stakeholders, most companies have failed to exploit their online capabilities to serve this purpose (KPMG, 2011; Radley, Yeldar & GRI, 2011).
Notwithstanding the emergence of assurance standards and the growing uptake of independent third party assurance of environmental reports, the assurance statements in environmental reports have varied significantly with regard to their titles, objectives, scope of assignment, amount of description of the nature, timing and extent of procedures employed, as well as the wording of their conclusions (Furmann, Ott, Looks & Gunther, 2013). Company stakeholders have also been sidelined from the assurance process, a situation that has made them dismissive of the assurance practices of companies (Furmann et al., 2013). Indeed, the assurance engagements are typically determined by and undertaken for the companies' management, an approach that has undermined the perceived independence of the assurance providers (ACCA, 2009). In addition, most companies' environmental performance measurement systems are inept and error prone, given their reliance on manual or simple spreadsheet software that cannot guarantee the accuracy of the reports produced (Ernst & Young, & Greenbiz, 2013). Furthermore, the users have lamented the apparent disconnection between the environmental reporting practice and the actual environmental performance given that companies with a poor environmental track record appear to report more comprehensively than their counterparts with a good track record for legitimisation purposes (Leavoy, 2010).
Despite the widespread uptake of the Internet as a medium of environmental reporting and the resulting proliferation of environmental information reported, no efforts have been made to standardise online reporting practices (Laud & Schepers, 2009). In addition, numerous environmental reporting guidelines and frameworks have emerged that do not harmonise with one another (KPMG, CFCGIA, GRI & UNEP, 2013). The foregoing has impaired the ease with which environmental reports may be compared (Menselsohn, Hjartarson & Pearce, 2010). Besides, most companies have proliferated their environmental reports in different formats and types, using a varying range of media including paper and electronic which has not only led to multiplication of data but has also further made it more difficult for readers to compare the reports (Laud & Schepers, 2009;.
By purporting to cater for diverse stakeholder groups, many companies have expanded their reports by simply 'dumping' verbose, un-prioritised and unintelligible information into them, an approach that has impaired the clarity of the reports (Business & Society, Morris & Chapman, 2010). Although technological advancements have made more frequent reporting at a low cost possible, most companies have not leveraged their online capabilities to produce more timely reports using HyperText Markup Language (HTML) format files (KPMG, 2011). Instead, they have increasingly relied on PDF files that take longer to upload, and that are aligned to the annual reports, thus missing an opportunity to produce more timely environmental reports (Radley, Yeldar & GRI, 2011).
Environmental reporting, like any other form of accounting, is aimed at providing information that is useful to a wide range of users for making decisions (GRI, 2013). However, the concerns raised above cast serious doubt on the ability of the current environmental reporting practices to meet users' decision-making needs. Consequently, it is debatable whether the environmental information provided by companies meets users' needs or whether these needs are even known (Hwang, Khoo & Wong, 2013; Said, Sulaiman, Ahmad & Senik, 2013).
In the South African context, the lack of knowledge of users' needs is exacerbated by a lack of research on environmental information needs of users (Kamala, 2015). This research article aims to fill this gap in the literature by investigating the environmental information needs of both financial and non-financial users of environmental reports. The rest of the paper proceeds as follows: Section 2 reviews the relevant prior literature; Section 3 provides the theoretical perspective adopted in this paper as well as the expectations developed for interpreting the results; Section 4 presents the methodology; Section 5 presents results and discussion; and finally, Section 6 provides the summary and conclusion.
2 Literature review
Although extensive research has been conducted on environmental disclosure patterns (Ernst & Young, 2007; Trucost & Environmental Agency, 2009; KPMG, 2011; KPMG, 2013), only a few studies have asked the users of such information what they need (De Villiers & Van Staden, 2010b). Even fewer have investigated the extent to which users actually read environmental reports, how they read the reports, the reasons for not reading the reports, and where environmental information should be reported (Solomon & Solomon, 2006; KPMG & SustainAbility, 2008; European Commission, 2011; Miller, 2012).
From the limited studies that employ questionnaires to determine users' needs, it is apparent that financial stakeholders do not read or even need environmental reports, given their narrative nature (De Villiers & Van Staden, 2010b; European Commission, 2011). However, studies that employ experimental methodology have revealed that financial stakeholders do use environmental information for making investment decisions when the information is provided, confirmation that they actually do need such information (Chan & Milne, 1999; Rikhardsson & Holm, 2005). Unlike questionnaires, experiments only require participants to make an investment decision, therefore they do not explore other possible reasons users may want environmental information (De Villiers & Van Staden, 2010b).
In the South African context, surveys that investigate users' needs are few and far between (Kamala, 2015). In one rare such study, De Villiers and Van Staden (2010b) investigated the preferences of individual shareholders and found that 97 per cent of the sampled respondents wanted companies to provide a description of their major environmental risks and impacts, 94 per cent wanted the disclosure of a company's environmental policy, while 81 per cent wanted a disclosure of actual performance against environmental targets. In addition, 80 per cent wanted disclosure of environmental costs by category, 78 per cent wanted a disclosure of measurable targets based on environmental policy, while 75 per cent wanted an independent audit of environmental disclosures.
With regard to where the environmental information should be disclosed, De Villiers and Van Staden's (2010b) survey revealed that that 90 per cent of the individual shareholders preferred that environmental information be disclosed in a company's annual report; 82 per cent wanted the information to be disclosed on a company's website; while 62 per cent wanted the information to be disclosed in a company's separate environmental report. However, De Villiers and Van Staden's (2010b) study focused only on individual shareholders, thus neglecting the needs of the voiceless non-financial stakeholders. In addition, De Villiers and Van Staden's (2010b) study did not interrogate whether shareholders actually read environmental reports, how they read the reports, and for those that did not read them, the reasons for not doing so.
In another South African study that focused only on the environmental information needs of non-financial users, Mitchell and Hill (2010) found that non-financial stakeholders were generally dissatisfied with the Corporate Social Responsibility (CSR) disclosures as issues perceived to be important were poorly or inadequately reported on and even omitted from the reports. However, Mitchell and Hill's (2010) study did not focus on environmental reports nor did it investigate whether users had actually read environmental reports, how they read the reports, and for those that did not read the reports, the reasons for not doing so. From the foregoing, it is apparent that at present, little is known about users' environmental information needs. Specifically, there may be a gap in knowledge of whether users read environmental reports; how they read the reports; reasons for not reading the reports; their preferences as to what an environmental report should contain; how the information should be reported; and where.
The main objective of accounting, and environmental reporting is no exception, is to provide information that is useful to users for making decisions (FASB, 2010; IASB, 2010; GRI, 2013). Providing environmental information without enquiring about the users' needs from the users themselves casts doubt on the usefulness of that information, particularly where research on users' needs may be lacking, as is the case in the South African context. Given the high monetary costs that are incurred in producing environmental reports, it seems imperative that those costs be justified by ensuring that environmental reports meet users' needs and are widely used. Accordingly, research from a South African viewpoint to investigate users' needs seems necessary.
In an attempt to fill in the gaps in the literature produced to date, this study, being arguably the first South African study, according to the authors' best knowledge, to investigate the environmental information needs of both financial and non-financial users (including impartial users, namely academics) in the post-King III report era, aims to:
• determine whether users read environmental reports and if they do, to determine how they read the reports;
• determine the reasons why potential users may not read environmental reports; and
• elicit users' preferences as to which information should be contained in environmental reports and how that information should be reported.
3 Theoretical perspectives and development of expectations
This survey aims to investigate the information needs of both financial and non-financial users of environmental reports, therefore some of the theories that are typically employed in social and environmental reporting research such as legitimacy, stakeholder and accountability theories are inappropriate because they explain only why companies undertake environmental reporting and therefore do not take users' perspectives into account (De Villiers & Van Staden, 2010b). Likewise, the agency theory is deemed inappropriate as it focuses only on the needs of shareholders as the principals and on managers as the agents, and thus ignores the needs of non-financial stakeholders.
Suitably, the decision-usefulness theory is adopted in this survey. This theory is premised on the view that the primary purpose of accounting, including environmental reporting, is to provide information to permit informed judgements and decisions by users of the information (FASB, 2010). The decision-usefulness theory, unlike legitimacy, stakeholder and accountability theories, takes a users' perspective and not that of reporting entities, and does not focus exclusively on the needs of financial stakeholders as is the case with the agency theory, but rather also recognises the information needs of non-financial stakeholders (IASB, 1989; FASB, 2010).
According to the decision-usefulness theory, accounting reports are only useful if they are perceived to be relevant and reliable (the two fundamental qualitative characteristics that decision-useful information must possess) (FASB, 2008; IASB, 2008; FASB, 2010). If accounting information is perceived to be completely lacking in either of these two characteristics, it will be neither useful nor read (FASB, 2008; IASB, 2008). It is therefore expected that those who do not perceive accounting reports to be either relevant or reliable will not read the reports (Expectation 1).
The decision-usefulness theory also posits that understandability, comparability, timeliness, and verifiability are the qualitative characteristics that enhance the decision-usefulness of accounting information (IASB, 2008; FASB, 2010; IASB, 2010). However, the enhancing qualitative characteristics, either individually or collectively, cannot make information useful if the information is irrelevant or unreliable (FASB, 2010). Therefore users are expected to prefer information that has more fundamental qualitative characteristics than enhancing qualitative characteristics (Expectation 2).
Also posited by the decision-usefulness theory is the notion that users' perceptions of decision-useful accounting information are limited by the cost constraint, according to which the information can be useful and yet too costly to access (FASB, 2008; IASB, 2008; FASB, 2010; IASB, 2010). The cost in accessing accounting information does not necessarily refer to monetary expense, but may take the form of the time required as well as the inconvenience faced when accessing the information (FASB, 2008). Accordingly, users are expected to prefer accessing accounting information in a fast and convenient way (Expectation 3).
4 Methodology
A questionnaire was employed to collect the data, which was analysed using both descriptive and inferential statistics. The following sub-sections further elaborate on this.
4.1 Questionnaire design
The questionnaire comprised 10 primarily closed-ended questions meant to maximise the response rate. Only one question was open-ended to capture the full richness and complexity of the perspectives held by the respondents (O'Dwyer, Unerman & Hession, 2005).
The questionnaire was divided into three sections. The first section requested data concerning demographic characteristics such as gender, age, highest educational qualification and occupation. This information was deemed relevant to ascertain the suitability of the respondents to participate in this survey. The second section dealt with questions pertaining to whether environmental reports are read, how they are read, and reasons why potential users may not have read these reports. The third section focused on users' preferences as to how and where environmental information should be reported.
Prior to disseminating the questionnaire, it was completed and critically evaluated by ten selected experienced researchers to ensure that the questions were clear, unambiguous, and understandable. The questionnaire was revised according to the recommendations made by the researchers and tested on ten full-time fourth-year accounting students (acting as surrogates for users) who found it to be clear, concise, and understandable.
4.2 Population and sample selection
The population comprised users of environmental reports produced by companies listed on the Johannesburg Securities Exchange (JSE). Given that the population of users as defined in the accounting conceptual framework could foreseeably include the entire South African population (GRI, 2008; IASB, 2008; FASB, 2010), this study focused only on user groups actively involved in 1) ethical investment, 2) environmental protection and 3) environmental reporting research. Accordingly, the study focused only on ethical investment funds, environmental NGOs, and environmental reporting researchers.
In view of the fact that there appears to be no comprehensive public listing of all ethical investment funds, environmental NGOs and environmental reporting researchers in South Africa, a compilation of a population frame list was done through a thorough Internet search that yielded 100 users comprising 30 ethical investment funds, 30 environmental NGOs and 40 accounting researchers. Consistent with prior studies, a census of the identified users was conducted considering that the population was relatively small (Tilt, 1994; Danastas & Gadenne, 2004).
4.3 Questionnaire distribution
The 100 identified users were contacted telephonically in order to obtain their co-operation. The author explained the purpose of the study, and the reason why the user had been selected. An Email link was sent to the users who had consented to participate. Attached to the E-mail link was a detailed covering letter that explained the purpose of the study and invited the respondents to participate in the survey by clicking on the Uniform Resource Locator (URL) link provided. A click on the URL link re-directed respondents to a web-based questionnaire which they were required to complete anonymously. This implies that only respondents who had E-mail addresses were included in this survey. The E-mail was sent out on the 1st of July 2013 with a deadline of the 31st of August 2013 for the completion of the questionnaire.
5 Results and discussion
The analysis and discussion of the results of this study are presented in the following sub-sections.
5.1 Response rate and test for non-response bias
From the 100 respondents, 54 usable questionnaires were returned, resulting in a response rate of 54 per cent. This rate was higher than that achieved by Tilt (1994) (46.8 per cent), and O'Dwyer et al. (2005) (52.8 per cent), and conforms to Fowler's (1988) recommendation that a response rate should be at least 20 per cent to provide credible statistics about a population. Of the respondents, 55.56 per cent were male whereas 44.44 per cent were female. All the respondents were above 26 years old and had a minimum of a post matric certificate/diploma. Most of the respondents were accounting researchers (39.62 per cent), followed by other professionals (32.08 per cent), representatives of environmental groups (22.64 per cent), followed by representatives of environmental groups (22.64 per cent). The respondents thus represented a broad cross-section of users, which did not only increase the likelihood that respondents of different persuasions had answered the questionnaire (De Villiers & Van Staden, 2010a), but was also consistent with the broad definition of users in the accounting conceptual framework (FASB, 2010; IASB, 2010).
To further test for non-response bias, the responses of early respondents (the first 27) were compared to those of late respondents (last 27). Early respondents were taken to represent individuals who were favourably disposed towards the subject of the questionnaire, whereas the late respondents were taken to represent those who were less in favour, as well as those who chose not to complete the questionnaires (De Villiers & Van Staden, 2010a). For each of the three main Likert-scale questions, a series of T-Tests was conducted. There were no significant differences in the questionnaire answers between those who responded early compared to those who responded late. Accordingly, there was no evidence of non-response bias in this test. Although this kind of test is not conclusive in ruling out a non-response bias, given the relatively high and acceptable response rate, different user groups' opinions and similarity of early and late responders' responses, it is unlikely that non-response bias influenced the results significantly (De Villiers & Van Staden, 2010b).
5.2 Whether users read environmental reports
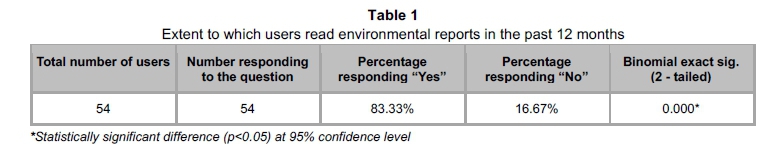
Users were asked by the way of a yes/no question whether they had read an environmental report in the past 12 months. The responses to this question are reported in Table 1. As shown in the table, 83.33 per cent of the users indicated that they had read an environmental report in the past 12 months, whereas only 16.67 per cent indicated that they had not done so.
A binomial test (2-tailed) was conducted to determine whether there was a significant difference between the total number of users who read the environmental report, and those who did not. A significant difference was found between the proportion of the users who had read the environmental reports (83.33 per cent), and the proportion of those who had not read them (16.67 per cent) (p<0.05). The fact that an overwhelming majority of the sampled users (83.33 per cent) had read an environmental report in the past 12 months confirms that an appropriate sample of users had been selected as it is only those who have read an environmental report that can really articulate their environmental information needs.
5.3 How users read environmental reports
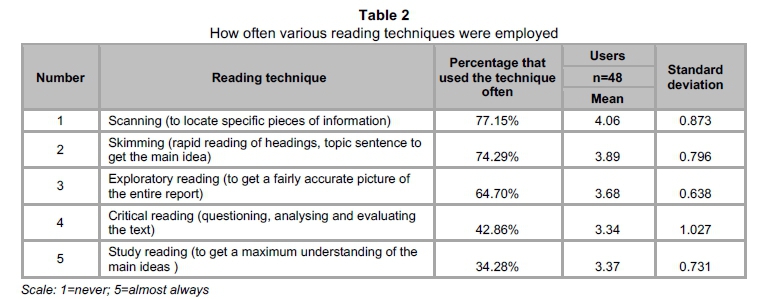
To determine how users read environmental reports, the respondents were asked to indicate how often they employed five reading techniques, namely: scanning (to locate specific information); skimming (rapid reading of headings, topic sentence to get the main idea); exploratory reading (to get a fairly accurate picture of the entire report); study reading (to maximise understanding of the main ideas); and critical reading (questioning, analysing, and evaluating the text).
A five-point Likert scale was used with weightings of one for 'never', two for 'rarely', three for 'sometimes', four for 'often', and five for 'almost always'. Therefore the closer the mean was to five, the more often a reading technique was used by the users. For the sake of clarity and brevity, the percentages of those who indicated that they had used the five reading techniques either 'often' or 'almost always' were added up together, and reported as "percentage that used the technique often" in the third column of Table 2. In essence therefore, those who indicated that they had used a reading technique 'sometimes' or 'rarely' are conservatively reported as never having used the technique, as the words "sometimes" and "rarely" suggest infrequent to almost non-usage of a technique. This approach is justified because it ensures that only those who frequently use a reading technique are reported as such, and it has also been used in prior studies (See De Villiers & Van Staden, 2010b).
As Table 2 shows, most users (77.15 per cent) indicated that they used the scanning reading technique, followed by skimming (74.29 per cent), then exploratory reading (64.70 per cent). The least often used reading technique was study reading (34.28 per cent), followed by critical reading (42.86 per cent). With the exception of the critical reading technique, the above results reveal an agreement in the responses of the users in view of the fact that the standard deviations of the responses are below one.
The users' preference of scanning, skimming and exploratory reading as opposed to critical reading and study reading suggests users' inclination to quick, convenient reading which suggests a need of summarised information of the kind that is contained in executive summaries, fact sheets of key indicators, tables, charts, graphs, scorecards, GRI index tables, dashboards and pictures. These findings are consistent with the decision-usefulness theory's cost constraint, and confirm the third expectation (Expectation 3), that users are expected to prefer accessing environmental information as fast and as conveniently as possible, as opposed to time-consuming and even inconvenient ways of doing so.
5.4 Reasons why some potential users do not read environmental reports
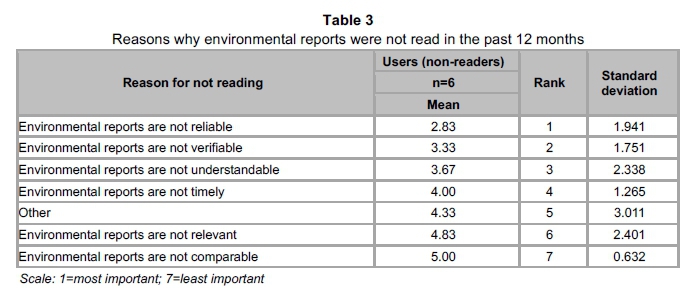
The potential users who had not read any environmental report in the past 12 months (hereafter referred to as non-readers) were asked to rank the various statements that could explain why they did not read any environmental report during the above-mentioned period. A scale of seven ranks was provided, with one being the most important statement, two being the second most important statement and seven being the least important statement. A rank was to be allocated once only to each statement. The mean rank for each statement was computed. The closer the mean of the statement was to one, the more important the statement was in explaining why environmental reports were not read. The ranking of means of the responses to this question is tabulated in Table 3.
As Table 3 shows, the most important statement that could explain why non-readers did not read environmental reports was that the reports were not perceived to be reliable. The second most important reason was that the reports were not perceived to be verifiable. The least important statement that could explain why environmental reports were not read was that they were not perceived to be comparable. The non-readers' views varied widely on all the statements except the last one (environmental reports were not comparable), as indicated by standard deviations above one. The above findings are consistent with Expectation 1 that those who did not perceive accounting reports to be either relevant or reliable will not read them.
5.5 Users' environmental information needs
Companies can only meet users' needs if they know what those needs are in the first place. This section was meant to explore users' needs by eliciting their views on what environmental information should be reported, how it should be presented, and where.
5.5.1 The information that an environmental report should contain and how it should be presented
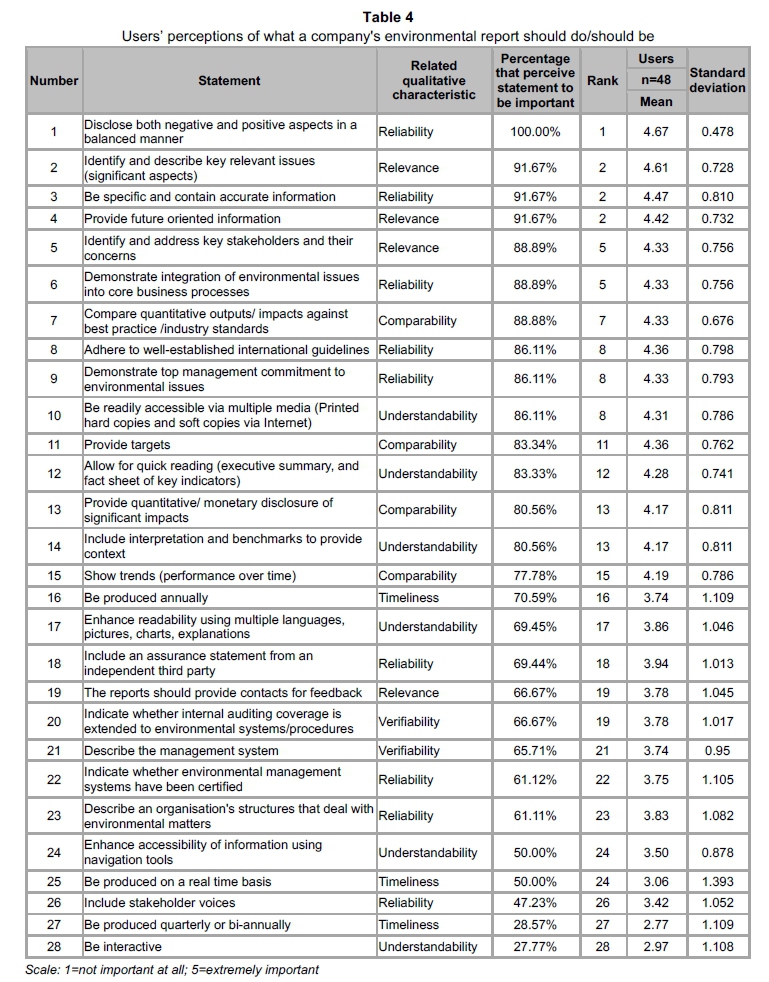
Bearing in mind that the users that have read an environmental report are in the best position to articulate their needs, the respondents who had read an environmental report in the past 12 months were asked to rate the importance of 28 statements about what a company's environmental reports should do or should be. A five-point Likert scale was used with weightings of one for 'not important at all', two for 'slightly important', three for 'fairly important', four for 'very important', and five, for 'extremely important'. Therefore the closer the mean was to five the more important the statement was to the users. For the sake of brevity, the percentages of those who perceived each of the 28 statements as either very important or extremely important were added up together, and reported as "percentage that perceive statement to be important" in the fourth column of Table 4. Therefore, those who perceived the statements to be fairly important were reported as perceiving the statements not to be important, as the words "fairly important" suggest neutrality in perception of the importance of the statements. This approach is justified to ensure that only those who perceived the statements to be important with certainty were reported as such, and it has also been used in prior studies (De Villiers & Van Staden, 2010b).
As can be seen from Table 4, the top six statements perceived by most respondents to be either 'very important' or 'extremely important' relate to the fundamental (primary) qualitative characteristics of decision-useful information, namely relevance or reliability. In fact, out of the top ten statements ranked according to the percentage of respondents that perceived them either as 'very important' or 'extremely important', only two statements relate to the qualitative characteristics that enhance the decision-usefulness of environmental information, whereas eight statements relate to the fundamental (primary) qualitative characteristics. Five out of the top ten statements relate to reliability and three relate to relevance. Each of the remaining two statements was either related to comparability or to understandability.
Another interesting observation that can be made from Table 4 is that four out of five bottom-ranked statements relate to the qualitative characteristics that enhance the decision-usefulness of environmental information, whereas only one statement relates to the fundamental qualitative characteristics. The above results are consistent with the decision-usefulness theory's assertion contained in the accounting conceptual framework that relevance and reliability are the two fundamental (primary) qualities that make accounting information useful for decision-making (FASB, 2010; FASB, 2008; IASB, 2010; IASB, 2008). The results thus confirm Expectation 2, that users are expected to prefer the environmental information that has more fundamental qualitative characteristics than enhancing qualitative characteristics.
5.5.2 Where environmental information should be reported
To determine which medium was preferred by the respondents, they were asked to indicate how often they read environmental reports from two types of media, namely print media and company websites. With regard to the print media, the users were required to specify how often they read environmental reports from integrated annual reports or sustainability reports. Likewise, with regard to the company websites, the users were required to specify how often they read environmental reports in integrated annual reports, or stand-alone sustainability reports, and the format of the reports that they often read HTML format or Portable Document Format (PDF)). A five-point Likert scale was used with weightings of one for 'never', two for 'rarely', three for 'sometimes', four for 'often', and five for 'almost always'. Therefore, the closer the mean was to five the more often environmental reports were read from a given medium.
For the sake of clarity and conciseness, the percentages of those who indicated that they had read environmental reports from the various media, either 'often' or 'almost always', were added up together, and reported as "percentage of users that read from the medium often" in the third column of Table 5. In essence therefore, those who indicated that they had read from a given medium 'sometimes' or 'rarely' are conservatively reported as never having read from a given medium, as the words "sometimes" and "rarely" suggest infrequent reading of the reports. This approach was used to ensure that only those who frequently read environmental reports from a specific medium were reported as such. Besides, the approach has also been used in prior studies, such as that undertaken by De Villiers & Van Staden (2010b).
As summarised in Table 5, most users read environmental reports from companies' websites as opposed to the print medium. Of the users, 51.43 per cent often read environmental reports in PDF integrated annual reports posted on companies' websites; 45.72 per cent of users often read environmental reports in PDF format stand-alone sustainability reports posted on companies' websites; while 42.86 per cent of users often read environmental reports in HTML format standalone sustainability reports posted on companies' websites. By contrast, only 34.29 per cent of users often read environmental reports in print medium integrated annual reports. Likewise, only 26.47 per cent of users often read environmental reports from print medium stand-alone sustainability reports. The users' opinions were mixed as the standard deviation of their responses for the three media were above one whereas for the other three it was below one.
The preceding results highlight the emergence of companies' websites as the medium of choice for users as this medium made environmental reports easily accessible, readily searchable and portable, convenient and time-saving as opposed to print medium reports (Mlarvizhi & Yadav, 2008). The preference of websites by users is consistent with the accounting conceptual frameworks' assertion that users incur costs, in terms of time and inconvenience to obtain information (FASB, 2008; IASB, 2008). Hence users are bound to prefer a medium that minimises these costs such as a company's website which, unlike the printed media, minimises the inconvenience and time spent in searching and accessing the desired information. The above results thus confirm Expectation 3 that users can be expected to prefer accessing environmental information as fast and as conveniently as possible.
6 Summary and conclusion
The purpose of this paper was to investigate the environmental information needs of both financial and non-financial users of environmental reports. To this end, three expectations based on decision-usefulness theory were developed and a survey conducted to determine users' needs. The results of the survey revealed that a majority (83.33 per cent) of the sampled users had read an environmental report in the last 12 months while only 16.67 per cent had not.
As far as how environmental reports were read was concerned, the results revealed that the most preferred reading techniques were scanning, skimming and exploratory reading, as opposed to study reading and critical reading. The preference of these quick and convenient reading techniques suggested that the users needed summarised information presented in the manner of executive summaries, fact sheets of key indicators, tables, charts, graphs, scorecards, GRI index tables, dashboards and pictures. This result confirmed Expectation 3 that, given the resource/ cost constraint, users could be expected to prefer accessing environmental information as fast and conveniently as possible, as opposed to time-consuming and even inconvenient ways of accessing the information.
Concerning the reasons why some potential users had not read any environmental reports in the past 12 months, the results of this survey revealed that the most important reason was the perception that the environmental reports were not reliable. Considering that reliability is one of the fundamental characteristics that decision-useful information must possess, this result confirmed Expectation 1 that those who do not perceive accounting reports to be either relevant or reliable will not read the reports.
In respect of users' preferences as to which information should be contained in environmental reports and how that information should be reported, the results of this survey revealed that the top six most popular environmental information attributes were all related to the two fundamental qualitative characteristics of decision-useful information. Likewise, four out of five of the least popular attributes were related to the enhancing qualitative characteristics of decision-useful information. The preceding results confirm Expectation 2 that users are expected to prefer the environmental information that has more fundamental qualitative characteristics of decision-useful information than the enhancing qualitative characteristics.
The above results show that ethical investors, accounting researchers and environmental groups as a collective need environmental information that contains both negative and positive aspects in a balanced manner, identifies and describes key relevant issues and provides specific, accurate information. In addition, the above users need future-oriented information that identifies and addresses key stakeholders and their concerns, and that demonstrates the integration of environmental issues into core business processes. Furthermore, the results show that users prefer summarised environmental information included in an integrated annual report that is posted on a company's website. This finding has not been reported in any other prior study. Among the most popular improvements in environmental reports that users wanted to see was an improvement in reliability of the reports, most notably the independent verification of the reports. Other improvements were mostly centred on the relevance of the reports, particularly relating to the deployment of an effective stakeholder engagement approach.
In conclusion, bearing in mind that relevance and reliability are the two fundamental qualitative characteristics that decision-useful accounting information must possess, and considering that users overwhelmingly need information that has these two characteristics, it can be concluded that users need decision-useful environmental information provided in a convenient, and readily accessible manner. The above results have implications for the standard setters and regulators who need to recognise that both financial and non-financial users need decision-useful environmental reports, and therefore they may consider changing the disclosure standards and regulations to make the required information obligatory.
Among the limitations of this study is that it focused only on the needs of three user groups, namely the ethical investors, accounting researchers and environmental groups, so its findings may not be generalisable to all the user groups of environmental reports. Further research could investigate the environmental information needs of other user groups such as environmental regulators, company employees, local communities, and green consumers. This study also did not examine the specific type of environmental information needed by specific user groups. Future studies could usefully explore these aspects.
References
ASSOCIATION OF CHARTERED CERTIFIED ACCOUNTANTS (ACCA). 2009. Key issues in sustainability assurance. http://www.accaglobal.com/pubs [accessed November 2010]. [ Links ]
BUSINESS & SOCIETY, MORRIS & CHAPMAN 2010. Survey of best practices, trends and benchmarks in sustainability reporting. http://www.businessandsociety [accessed December 2010]. [ Links ]
CHAN, CCC & MILNE, MJ. 1999. Investor reactions to corporate environmental saints and sinners: An experimental analysis. Accounting and Business Research, 29(4):265-279. [ Links ]
DANASTAS, L & GADENNE, D. 2004. A Study of external pressure groups: Users of corporate social disclosure. Paper presented at the Corporate Governance and Ethics Conference, Sydney. June. [ Links ]
DE VILLIERS, C. & VAN STADEN, C. 2008. Environmental accountability: A shareholder requirement? Paper presented at the accounting & finance association of Australia and New Zealand (AFAANZ), Adelaide. July. [ Links ]
DE VILLIERS, C. & VAN STADEN, C.J. 2010A. Shareholders' requirements for corporate environmental disclosures: A cross country comparison. British Accounting Review, 429(4):227-240. [ Links ]
DE VILLIERS, C.J. & VAN STADEN, C.J. 2010B. Shareholders' corporate environmental disclosure need. South African Journal of Economic and Management Sciences, 13(4):436-445. [ Links ]
ERNST & YOUNG. 2007. Keep the balance steady: Survey on the quality of sustainability reports 2007. http://www.ec.europa.eu/enterprise/newsroom [accessed January 2010]. [ Links ]
ERNST & YOUNG, & GREENBIZ. 2013. Value of sustainability reporting. http://www.ey.com/US/en/Services/Specialty-Services/Climate [accessed March 2013]. [ Links ]
EUROPEAN COMMISSION. 2011. The state of play in sustainability reporting in the European Union. http://www.ec.europa.eu/social/BlobServlet [accessed January 2012]. [ Links ]
FINANCIAL ACCOUNTING STANDARDS BOARD (FASB). 2008. Conceptual framework: Statement of financial accounting concepts No. 8. http://www.fasb.org/cs [accessed June 2010]. [ Links ]
FINANCIAL ACCOUNTING STANDARDS BOARD (FASB). 2010. Conceptual framework: Statement of financial accounting concepts No. 8. http://www.fasb.org/cs/Blob Server [accessed January 2011]. [ Links ]
FOWLER, F.J. 1988. Survey research methods. Beverly Hills, California: Sage. [ Links ]
FURMANN, S., OTT, C. LOOKS, E. & GUNTHER, T.W. 2013. The contents of assurance statements of sustainability reports and information asymmetry. http://www.arw-suisse.ch/wp-content/uploads/2013/05/fuhrmann-etal1.pdf [accessed September 2014]. [ Links ]
GLOBAL REPORTING INITIATIVE (GRI). 2008. Global Reporting Initiative sustainability report. https://www.globalreporting.org/resourcelibrary/G3-English-Financial-Services-Sector-Supplement.pdf [accessed May 2011]. [ Links ]
GLOBAL REPORTING INITIATIVE (GRI). 2013. G4 Guidelines - Reporting principles and standard disclosures. http://www.globalreporting.org/resourcelibrary/GRIG4-Part1-Reporting-Principles-and-Standard-Disclosures.pdf [accessed September 2014]. [ Links ]
HWANG, S.C., KHOO, T.A. & WONG, D.C. 2013. Perception of preparers and users on sustainability reporting in Singapore. Journal of Education and Vocational Research, 4(6):174-183. [ Links ]
INTERNATIONAL ACCOUNTING STANDARDS BOARD (IASB). 1989. Framework for the preparation and presentation offinancial statements. London: International Accounting Standards Board. [ Links ]
INTERNATIONAL ACCOUNTING STANDARDS BOARD (IASB). 2008. Exposure draft of an improved conceptual framework for financial reporting. http://www.iasb.org/NR/...00FD.../conceptual_framework.pdf [accessed September 2011]. [ Links ]
INTERNATIONAL ACCOUNTING STANDARDS BOARD (IASB). 2010. Conceptual framework for financial reporting 2010. http://www.ifrs.org/News/Press-Releases/.pdf [accessed September 2011]. [ Links ]
JIRA, C.F. & TOFFEL, M.W. 2013. Engaging supply chains in climate change. Manufacturing and Service Operations Management, 15(4):559-577. [ Links ]
KAMALA, P.N. 2015. The decision-usefulness of corporate environmental reports in South Africa. Unpublished Doctor of Commerce thesis. Pretoria. University of South Africa. [ Links ]
KPMG. 2011. International survey of corporate responsibility reporting 2011. http://www.kpmg.com/global/en/issues/2011-survey.aspx [accessed July 2012]. [ Links ]
KPMG. 2013. The KPMG survey of corporate responsibility reporting 2013. http://www.kpmg.com/global/en/issuesandinsights/2013.aspx [accessed December 2013]. [ Links ]
KPMG & SUSTAINABILITY. 2008. Count me in - The readers' take on sustainability reporting. http://www.kpmg.com/GR/en/CountMeIn.pdf [accessed July 2012]. [ Links ]
KPMG, CENTRE FOR CORPORATE GOVERNANCE IN AFRICA (CFCGIA), GLOBAL REPORTING INITIATIVE (GRI) & UNITED NATIONS ENVIRONMENTAL PROGRAMME (UNEP). 2013. Carrots and sticks: Sustainability reporting policies worldwide - today's best practice, tomorrow's trends. http://www.globalreporting.org [accessed December 2013]. [ Links ]
LAUD, R.L. & SCHEPERS, D.H. 2009. Beyond transparency: Information overload and a model for intelligibility. Business and Society Review, 114:365-91. [ Links ]
LEAVOY, P. 2010. Does CSR reporting help the planet, or just help reporting? http://www.greenbiz.com/blog/2010/09/30/does-csr-reporting [accessed January 2011]. [ Links ]
MARQUIS, C. & TOFFEL, M.W. 2014. Scrutiny, norms, and selective disclosure: A global study of greenwashing. http://www.hbs.edu/faculty/Pages [accessed August 2014]. [ Links ]
MENSELSOHN, M. HJARTARSON, J. & PEARCE, J. 2010. Saving dollars and making sense an agenda for a more efficient, effective and accountable federation. http://www.mowatcentre [accessed November 2010]. [ Links ]
MILLER, H. 2012. Investors don't read CSR reports. http://www.triplepundit.com/2012/10/bsr-sustainability-business-trends [accessed September 2014]. [ Links ]
MITCHELL, C.G. & HILL, T.R. 2010. An exploratory analysis of stakeholders' expectations and perceptions of corporate social and environmental reporting in South Africa. SA Journal of Accounting Research, 24(1):49-78. [ Links ]
MLARVIZHI, P. & YADAV, S. 2008. Corporate environmental reporting on the internet: An insight into Indian practices, http://www.iitk.ac.in [accessed April 2011]. [ Links ]
O'DWYER, B., UNERMAN, J. & HESSION, E. 2005. User needs in sustainability accounting: Perspectives of stakeholders in Ireland. European Accounting Review, 14(4):759-787. [ Links ]
RADLEY YELDAR & GLOBAL REPORTING INITIATIVE (GRI). 2011. Trends in online sustainability reporting. http://www.globalreporting.org/ [accessed June 2011]. [ Links ]
RIKHARDSSON, P. & HOLM, C. 2005. Do as you say - say as you do: Measuring the actual use of environmental information in investment decisions. http://www.hha.dk/afl/wp/man/M_2005_02.pdf [accessed December 2011]. [ Links ]
SAID, R.M., SULAIMAN, M., AHMAD, N.N. & SENIK, R. 2013. Environmental information usefulness: Bank officers' perceptions in Malaysia. Paper presented at the 4th international conference on business and economic research, Bandung, Indonesia. March. [ Links ]
SOLOMON, J.F. & SOLOMON, A. 2006. Private social, ethical and environmental disclosure. Accounting, Auditing & Accountability Journal, 19(4):564-591. [ Links ]
TILT, C.A. 1994. The influence of external pressure groups on corporate social disclosure. Accounting, Auditing and Accountability Journal, 7(4):47-72. [ Links ]
TRUCOST AND ENVIRONMENTAL AGENCY. 2009. Environmental disclosures: The third major review of environmental reporting in the annual report & accounts of the FTSE all-share companies. http://www.environment-agency.gov.uk/.aspx [accessed December 2011]. [ Links ]
Accepted: July 2016

